Zip Codes with the Highest Percentage of Population Employed in Installation, Maintenance & Repair in Henderson, NC
RELATED REPORTS & OPTIONS
Installation, Maintenance & Repair
Henderson
Compare Zip Codes
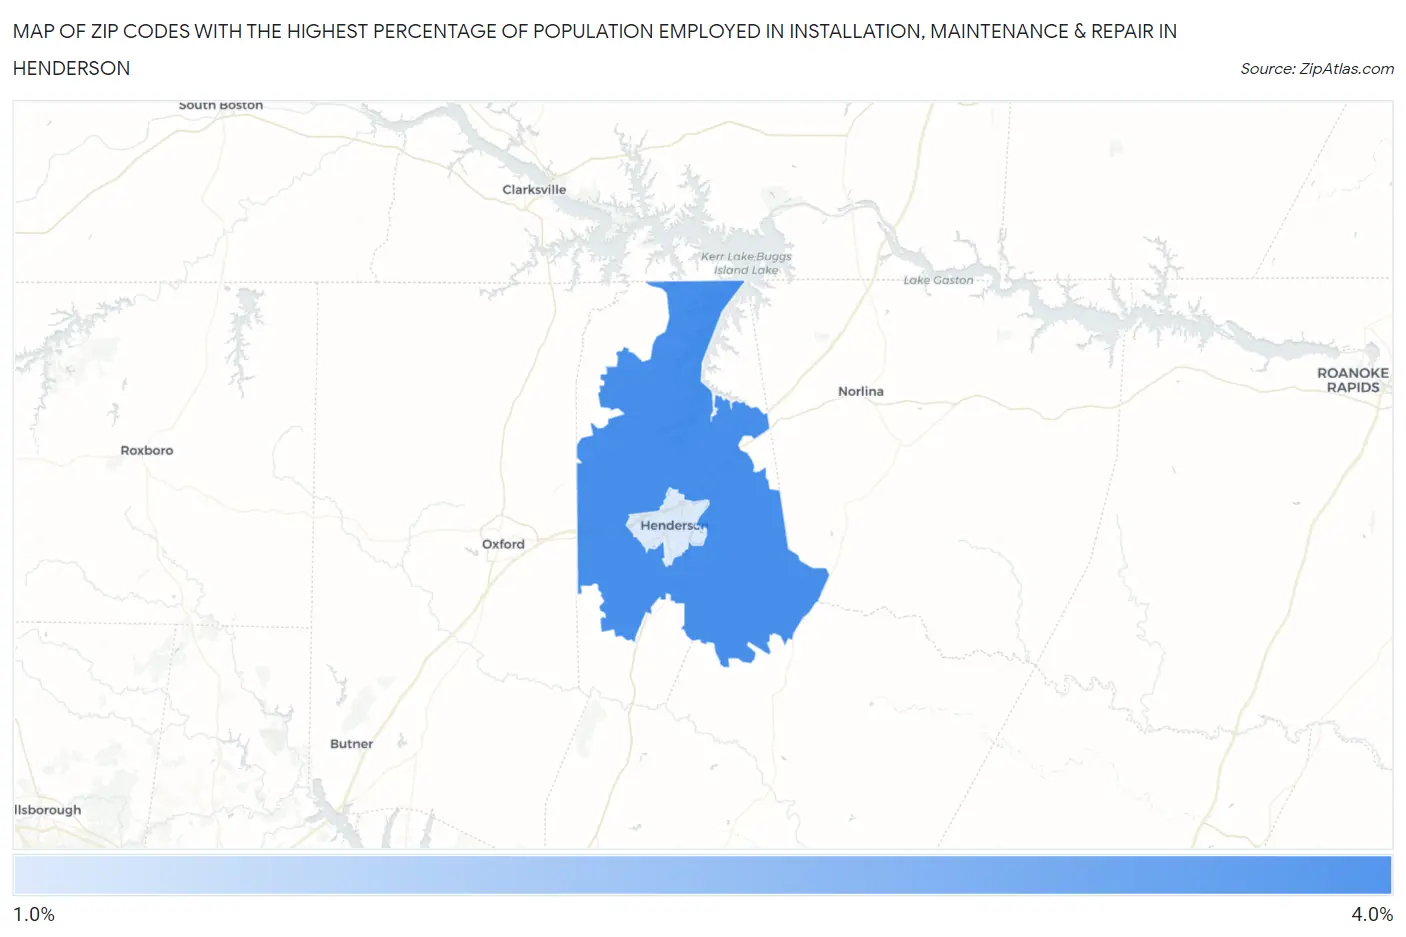
Map of Zip Codes with the Highest Percentage of Population Employed in Installation, Maintenance & Repair in Henderson
1.8%
3.8%
Zip Codes with the Highest Percentage of Population Employed in Installation, Maintenance & Repair in Henderson, NC
| Zip Code | % Employed | vs State | vs National | |
| 1. | 27537 | 3.8% | 3.4%(+0.408)#377 | 3.1%(+0.749)#13,160 |
| 2. | 27536 | 1.8% | 3.4%(-1.58)#605 | 3.1%(-1.24)#22,778 |
1
Common Questions
What are the Top Zip Codes with the Highest Percentage of Population Employed in Installation, Maintenance & Repair in Henderson, NC?
Top Zip Codes with the Highest Percentage of Population Employed in Installation, Maintenance & Repair in Henderson, NC are:
What zip code has the Highest Percentage of Population Employed in Installation, Maintenance & Repair in Henderson, NC?
27537 has the Highest Percentage of Population Employed in Installation, Maintenance & Repair in Henderson, NC with 3.8%.
What is the Percentage of Population Employed in Installation, Maintenance & Repair in Henderson, NC?
Percentage of Population Employed in Installation, Maintenance & Repair in Henderson is 1.2%.
What is the Percentage of Population Employed in Installation, Maintenance & Repair in North Carolina?
Percentage of Population Employed in Installation, Maintenance & Repair in North Carolina is 3.4%.
What is the Percentage of Population Employed in Installation, Maintenance & Repair in the United States?
Percentage of Population Employed in Installation, Maintenance & Repair in the United States is 3.1%.