Zip Codes with the Highest Percentage of Population Employed in Architecture & Engineering in Butte, MT
RELATED REPORTS & OPTIONS
Architecture & Engineering
Butte
Compare Zip Codes
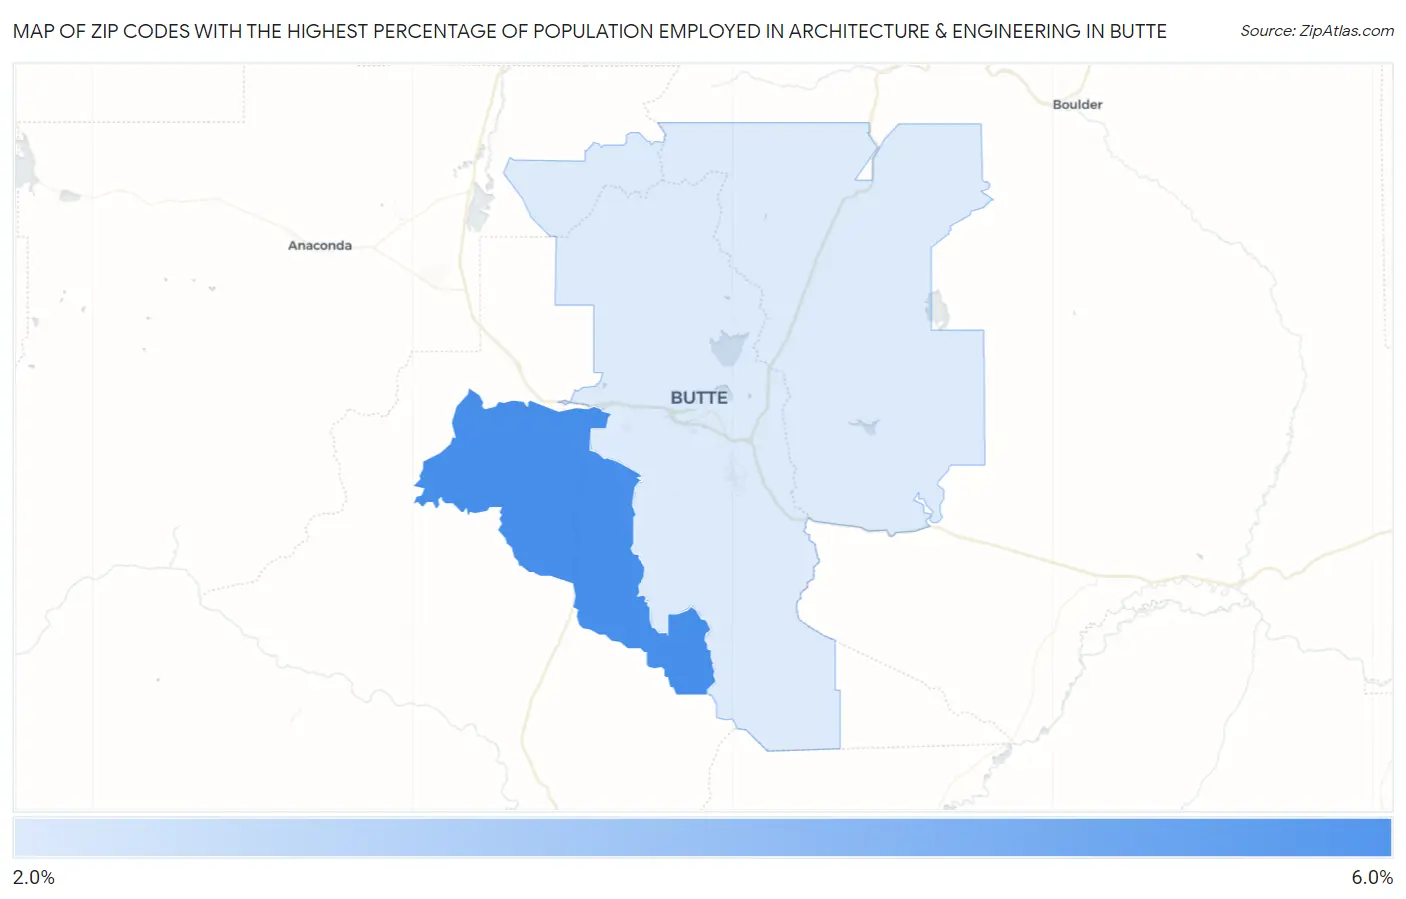
Map of Zip Codes with the Highest Percentage of Population Employed in Architecture & Engineering in Butte
2.6%
5.4%
Zip Codes with the Highest Percentage of Population Employed in Architecture & Engineering in Butte, MT
| Zip Code | % Employed | vs State | vs National | |
| 1. | 59750 | 5.4% | 1.8%(+3.67)#14 | 2.1%(+3.27)#1,372 |
| 2. | 59701 | 2.6% | 1.8%(+0.805)#41 | 2.1%(+0.410)#6,749 |
1
Common Questions
What are the Top Zip Codes with the Highest Percentage of Population Employed in Architecture & Engineering in Butte, MT?
Top Zip Codes with the Highest Percentage of Population Employed in Architecture & Engineering in Butte, MT are:
What zip code has the Highest Percentage of Population Employed in Architecture & Engineering in Butte, MT?
59750 has the Highest Percentage of Population Employed in Architecture & Engineering in Butte, MT with 5.4%.
What is the Percentage of Population Employed in Architecture & Engineering in Montana?
Percentage of Population Employed in Architecture & Engineering in Montana is 1.8%.
What is the Percentage of Population Employed in Architecture & Engineering in the United States?
Percentage of Population Employed in Architecture & Engineering in the United States is 2.1%.