Zip Codes with the Highest Percentage of Population Employed in Architecture & Engineering in Great Falls, MT
RELATED REPORTS & OPTIONS
Architecture & Engineering
Great Falls
Compare Zip Codes
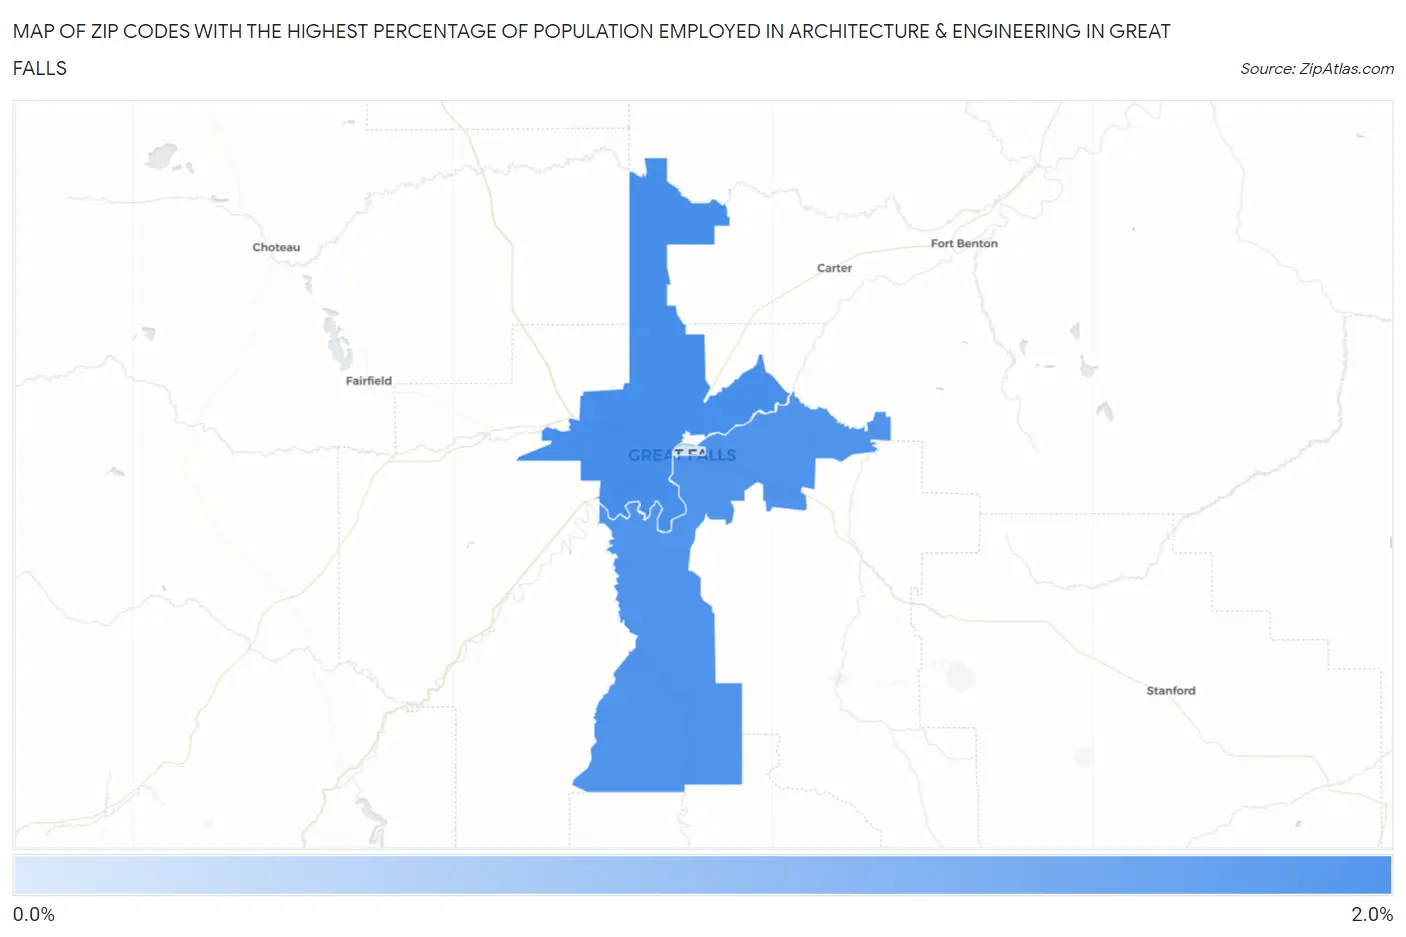
Map of Zip Codes with the Highest Percentage of Population Employed in Architecture & Engineering in Great Falls
0.63%
1.7%
Zip Codes with the Highest Percentage of Population Employed in Architecture & Engineering in Great Falls, MT
| Zip Code | % Employed | vs State | vs National | |
| 1. | 59404 | 1.7% | 1.8%(-0.048)#69 | 2.1%(-0.443)#11,448 |
| 2. | 59405 | 1.6% | 1.8%(-0.106)#73 | 2.1%(-0.501)#11,846 |
| 3. | 59401 | 0.63% | 1.8%(-1.13)#135 | 2.1%(-1.52)#19,423 |
1
Common Questions
What are the Top Zip Codes with the Highest Percentage of Population Employed in Architecture & Engineering in Great Falls, MT?
Top Zip Codes with the Highest Percentage of Population Employed in Architecture & Engineering in Great Falls, MT are:
What zip code has the Highest Percentage of Population Employed in Architecture & Engineering in Great Falls, MT?
59404 has the Highest Percentage of Population Employed in Architecture & Engineering in Great Falls, MT with 1.7%.
What is the Percentage of Population Employed in Architecture & Engineering in Great Falls, MT?
Percentage of Population Employed in Architecture & Engineering in Great Falls is 1.3%.
What is the Percentage of Population Employed in Architecture & Engineering in Montana?
Percentage of Population Employed in Architecture & Engineering in Montana is 1.8%.
What is the Percentage of Population Employed in Architecture & Engineering in the United States?
Percentage of Population Employed in Architecture & Engineering in the United States is 2.1%.