Zip Codes with the Highest Percentage of Population with a Degree in Literature and Languages in Ypsilanti, MI

RELATED REPORTS & OPTIONS

Literature and Languages
Population
Families and Households
Female Fertility
Female Fertility (Unmarried)
Race (Community Size)
Race (Percentage)
Ancestry (Community Size)
AfricanAlbanianAmericanApacheArabArmenianAustrianBelgianBhutaneseBlackfeetBolivianBritishBulgarianBurmeseCanadianCentral AmericanCentral American IndianCherokeeChippewaChoctawColombianCroatianCubanCzechCzechoslovakianDanishDutchEastern EuropeanEnglishEthiopianEuropeanFilipinoFinnishFrenchFrench CanadianGermanGreekGuatemalanHonduranHungarianIndian (Asian)IranianIraqiIrishIroquoisItalianJamaicanJapaneseJordanianKoreanLaotianLatvianLebaneseLithuanianMacedonianMalteseMexicanNative HawaiianNavajoNigerianNorthern EuropeanNorwegianPalestinianPeruvianPolishPortuguesePuerto RicanRomanianRussianSalvadoranScandinavianScotch-IrishScottishSerbianSlovakSloveneSomaliSouth AmericanSpanishSri LankanSubsaharan AfricanSwedishSwissSyrianThaiTrinidadian and TobagonianTurkishUkrainianUruguayanVenezuelanWelshYaqui
Ancestry (Percentage)
AfricanAlbanianAmericanApacheArabArmenianAustrianBelgianBhutaneseBlackfeetBolivianBritishBulgarianBurmeseCanadianCentral AmericanCentral American IndianCherokeeChippewaChoctawColombianCroatianCubanCzechCzechoslovakianDanishDutchEastern EuropeanEnglishEthiopianEuropeanFilipinoFinnishFrenchFrench CanadianGermanGreekGuatemalanHonduranHungarianIndian (Asian)IranianIraqiIrishIroquoisItalianJamaicanJapaneseJordanianKoreanLaotianLatvianLebaneseLithuanianMacedonianMalteseMexicanNative HawaiianNavajoNigerianNorthern EuropeanNorwegianPalestinianPeruvianPolishPortuguesePuerto RicanRomanianRussianSalvadoranScandinavianScotch-IrishScottishSerbianSlovakSloveneSomaliSouth AmericanSpanishSri LankanSubsaharan AfricanSwedishSwissSyrianThaiTrinidadian and TobagonianTurkishUkrainianUruguayanVenezuelanWelshYaqui
Immigrant Origin (Total)
Immigrant Origin (Percentage)
Income
Income (Families)
Income (Households)
Poverty
Poverty (Families)
Unemployment
Employment Occupations
Employment Industries
Employer Class
Commute Time
Commute Means
School Enrollment
Education by Degree Field
Occupancy
Finances
Physical Characteristics
Ypsilanti
Compare Zip Codes
Comparison Subject

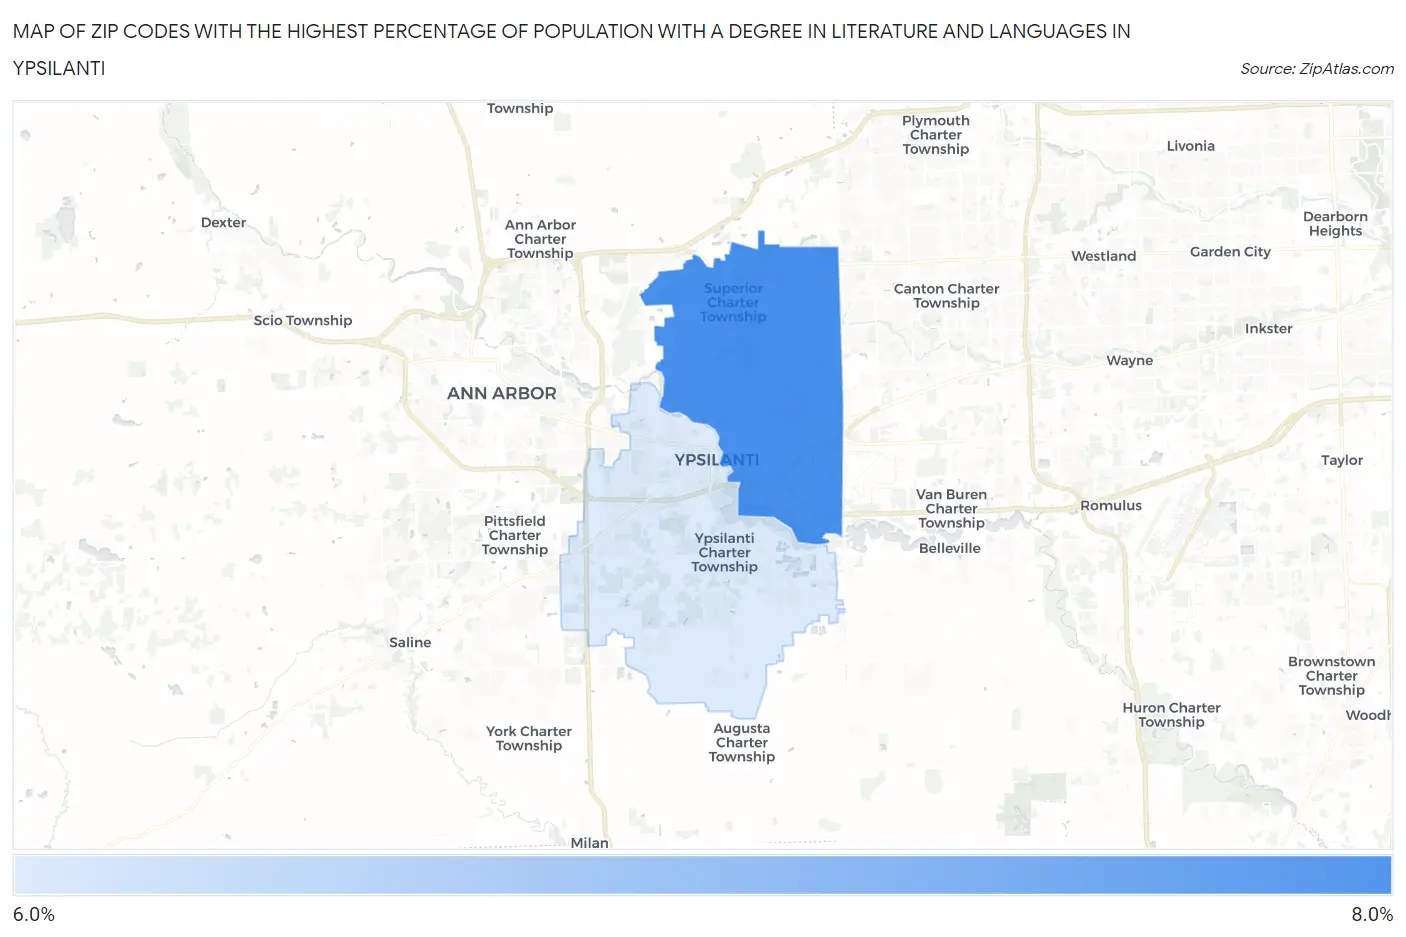
Map of Zip Codes with the Highest Percentage of Population with a Degree in Literature and Languages in Ypsilanti

0.0%
8.0%
Zip Codes with the Highest Percentage of Population with a Degree in Literature and Languages in Ypsilanti Map

Zip Codes with the Highest Percentage of Population with a Degree in Literature and Languages in Ypsilanti, MI

Zip Code % Graduates vs State vs National
1.481987.6%3.7%(+3.91)#624.4%(+3.20)#3,346
2.481976.7%3.7%(+3.01)#874.4%(+2.30)#4,350

Common Questions

What are the Top Zip Codes with the Highest Percentage of Population with a Degree in Literature and Languages in Ypsilanti, MI?
Top Zip Codes with the Highest Percentage of Population with a Degree in Literature and Languages in Ypsilanti, MI are:
#1
7.6%
#2
6.7%
What zip code has the Highest Percentage of Population with a Degree in Literature and Languages in Ypsilanti, MI?
48198 has the Highest Percentage of Population with a Degree in Literature and Languages in Ypsilanti, MI with 7.6%.
What is the Percentage of Population with a Degree in Literature and Languages in Ypsilanti, MI?
Percentage of Population with a Degree in Literature and Languages in Ypsilanti is 10.7%.
What is the Percentage of Population with a Degree in Literature and Languages in Michigan?
Percentage of Population with a Degree in Literature and Languages in Michigan is 3.7%.
What is the Percentage of Population with a Degree in Literature and Languages in the United States?
Percentage of Population with a Degree in Literature and Languages in the United States is 4.4%.