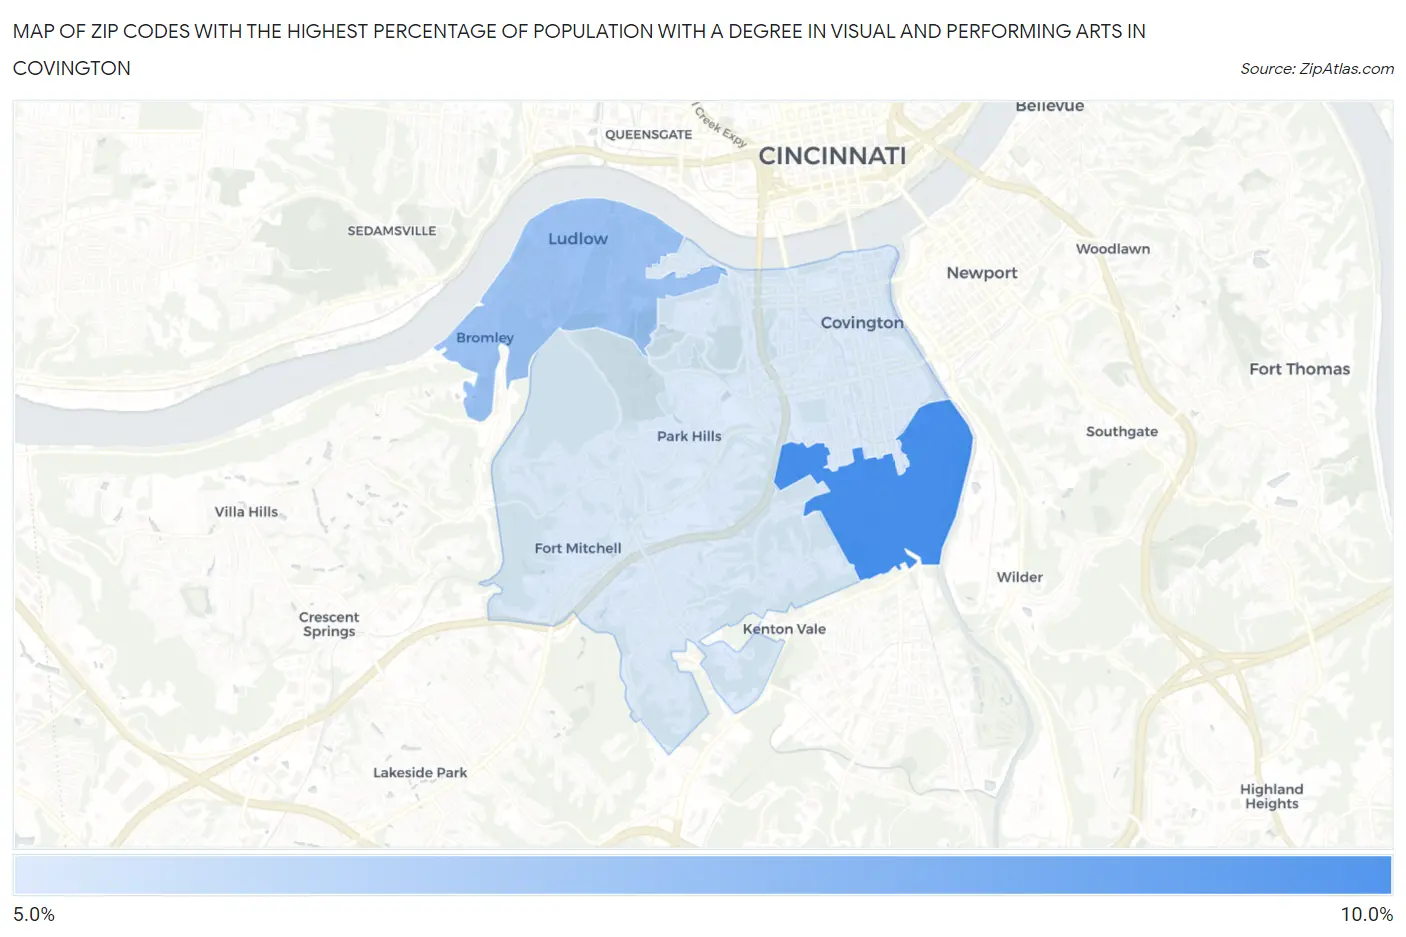
Zip Codes with the Highest Percentage of Population with a Degree in Visual and Performing Arts in Covington, KY
RELATED REPORTS & OPTIONS
Visual and Performing Arts
Covington
Compare Zip Codes
Map of Zip Codes with the Highest Percentage of Population with a Degree in Visual and Performing Arts in Covington
6.0%
9.3%
Zip Codes with the Highest Percentage of Population with a Degree in Visual and Performing Arts in Covington, KY
| Zip Code | % Graduates | vs State | vs National | |
| 1. | 41014 | 9.3% | 3.2%(+6.09)#35 | 4.3%(+5.07)#2,099 |
| 2. | 41016 | 7.4% | 3.2%(+4.19)#45 | 4.3%(+3.17)#3,280 |
| 3. | 41011 | 6.0% | 3.2%(+2.73)#63 | 4.3%(+1.70)#4,931 |
1
Common Questions
What are the Top Zip Codes with the Highest Percentage of Population with a Degree in Visual and Performing Arts in Covington, KY?
Top Zip Codes with the Highest Percentage of Population with a Degree in Visual and Performing Arts in Covington, KY are:
What zip code has the Highest Percentage of Population with a Degree in Visual and Performing Arts in Covington, KY?
41014 has the Highest Percentage of Population with a Degree in Visual and Performing Arts in Covington, KY with 9.3%.
What is the Percentage of Population with a Degree in Visual and Performing Arts in Covington, KY?
Percentage of Population with a Degree in Visual and Performing Arts in Covington is 6.9%.
What is the Percentage of Population with a Degree in Visual and Performing Arts in Kentucky?
Percentage of Population with a Degree in Visual and Performing Arts in Kentucky is 3.2%.
What is the Percentage of Population with a Degree in Visual and Performing Arts in the United States?
Percentage of Population with a Degree in Visual and Performing Arts in the United States is 4.3%.