Zip Codes with the Highest Percentage of Self-Employed / Not Incorporated in Leawood, KS
RELATED REPORTS & OPTIONS
Self-Employed / Not Incorporated
Leawood
Compare Zip Codes
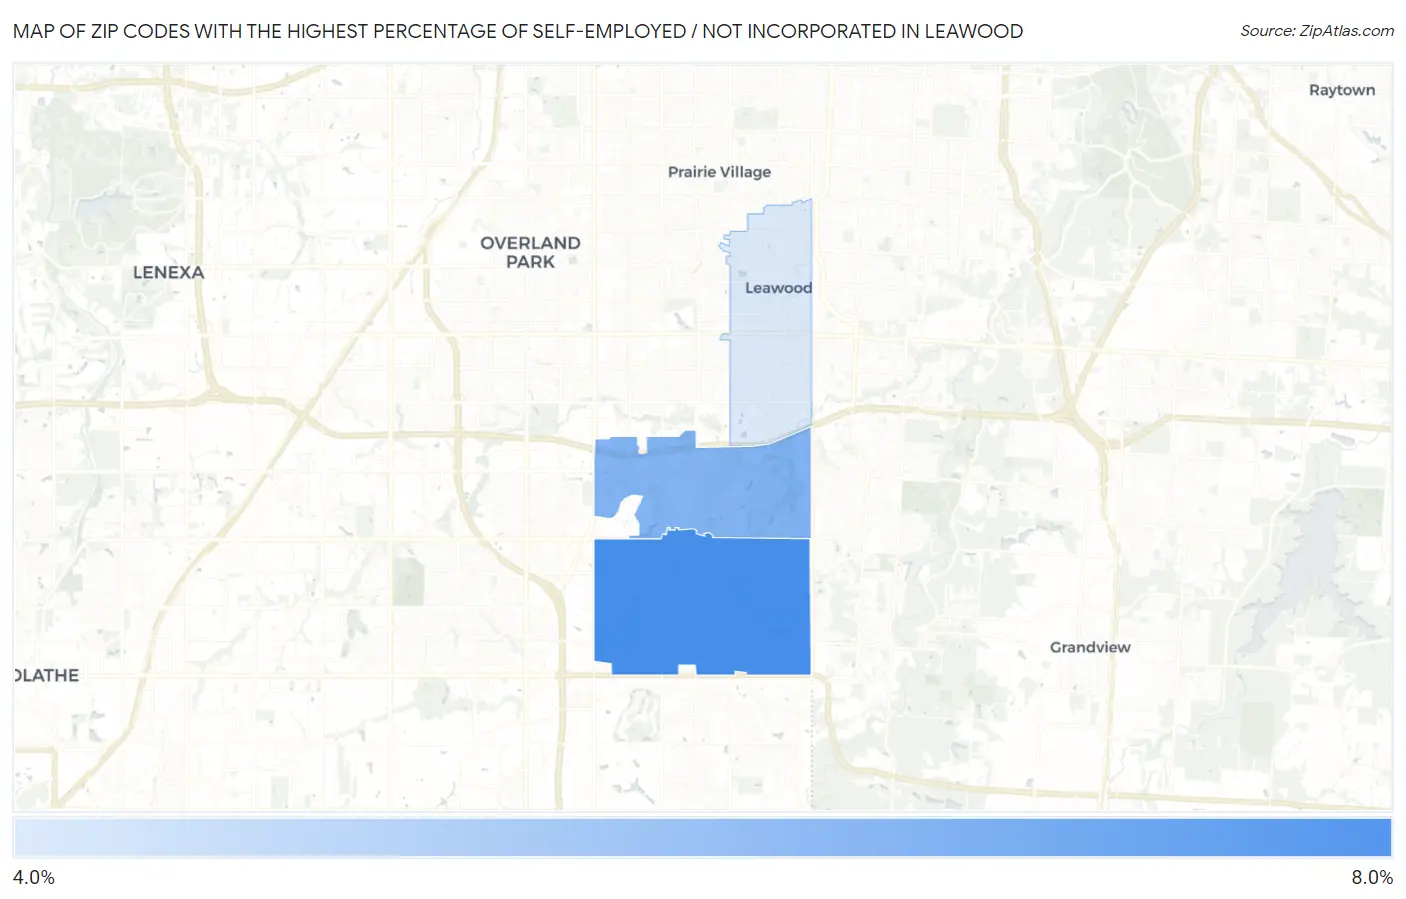
Map of Zip Codes with the Highest Percentage of Self-Employed / Not Incorporated in Leawood
0.0%
8.0%
Zip Codes with the Highest Percentage of Self-Employed / Not Incorporated in Leawood, KS
| Zip Code | % Self-Employed / Not Incorporated | vs State | vs National | |
| 1. | 66209 | 6.6% | 5.9%(+0.703)#415 | 5.8%(+0.788)#14,125 |
| 2. | 66211 | 5.9% | 5.9%(-0.022)#451 | 5.8%(+0.063)#16,457 |
| 3. | 66206 | 4.7% | 5.9%(-1.17)#524 | 5.8%(-1.08)#20,671 |
1
Common Questions
What are the Top Zip Codes with the Highest Percentage of Self-Employed / Not Incorporated in Leawood, KS?
Top Zip Codes with the Highest Percentage of Self-Employed / Not Incorporated in Leawood, KS are:
What zip code has the Highest Percentage of Self-Employed / Not Incorporated in Leawood, KS?
66209 has the Highest Percentage of Self-Employed / Not Incorporated in Leawood, KS with 6.6%.
What is the Percentage of Self-Employed / Not Incorporated in Leawood, KS?
Percentage of Self-Employed / Not Incorporated in Leawood is 4.9%.
What is the Percentage of Self-Employed / Not Incorporated in Kansas?
Percentage of Self-Employed / Not Incorporated in Kansas is 5.9%.
What is the Percentage of Self-Employed / Not Incorporated in the United States?
Percentage of Self-Employed / Not Incorporated in the United States is 5.8%.