Zip Codes with the Highest Percentage of Local Government Employees in Overland Park, KS
RELATED REPORTS & OPTIONS
Local Government Employees
Overland Park
Compare Zip Codes
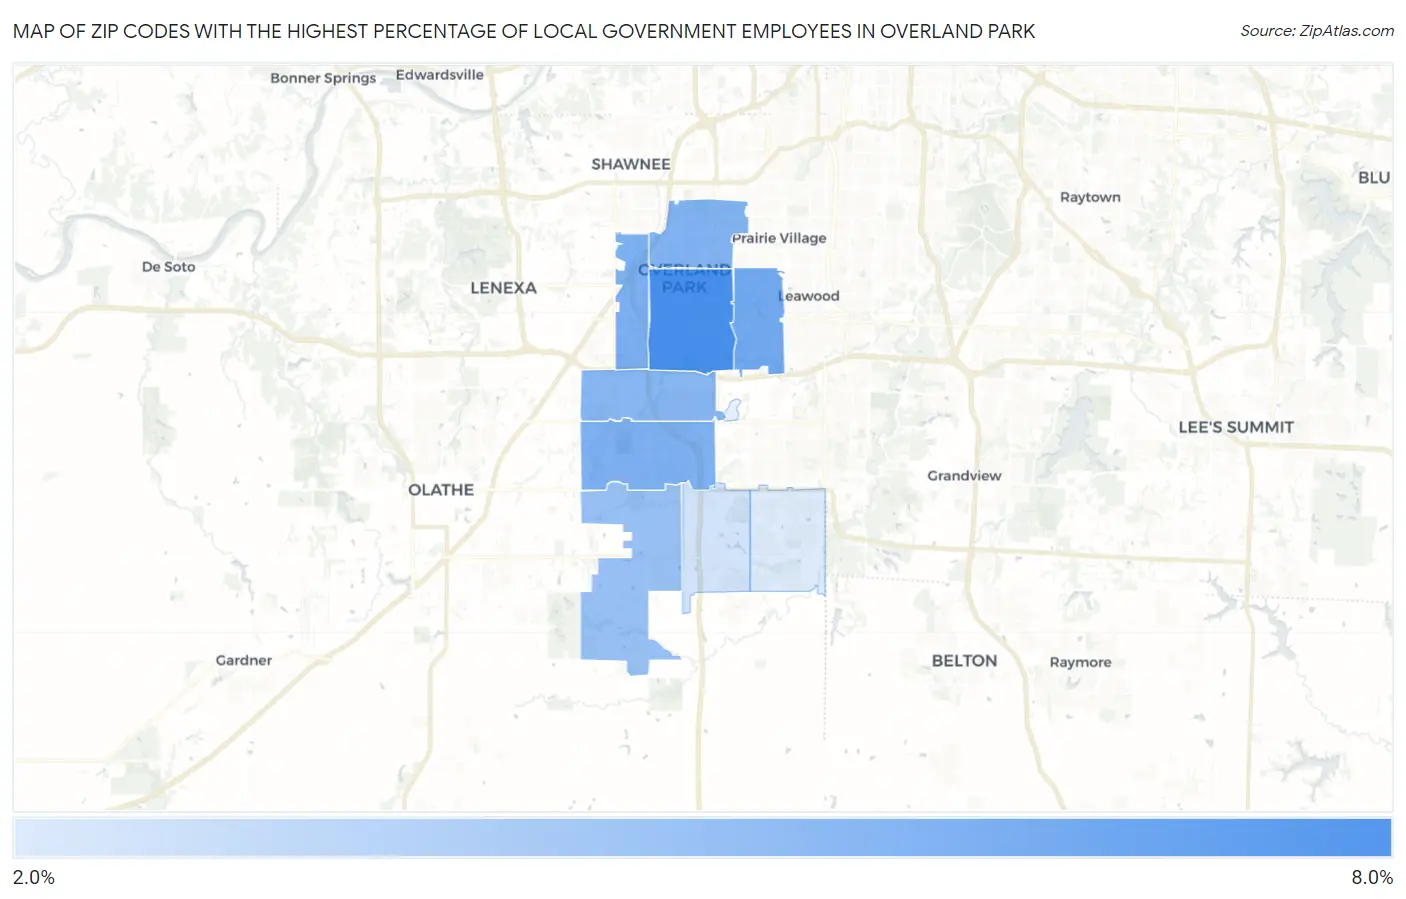
Map of Zip Codes with the Highest Percentage of Local Government Employees in Overland Park
2.4%
7.6%
Zip Codes with the Highest Percentage of Local Government Employees in Overland Park, KS
| Zip Code | % Local Government Employees | vs State | vs National | |
| 1. | 66212 | 7.6% | 8.1%(-0.528)#449 | 7.2%(+0.388)#14,383 |
| 2. | 66207 | 6.1% | 8.1%(-2.06)#515 | 7.2%(-1.14)#19,500 |
| 3. | 66214 | 5.7% | 8.1%(-2.42)#536 | 7.2%(-1.50)#20,709 |
| 4. | 66213 | 5.7% | 8.1%(-2.49)#539 | 7.2%(-1.57)#20,945 |
| 5. | 66204 | 5.6% | 8.1%(-2.56)#543 | 7.2%(-1.64)#21,206 |
| 6. | 66210 | 5.4% | 8.1%(-2.76)#559 | 7.2%(-1.84)#21,854 |
| 7. | 66221 | 4.8% | 8.1%(-3.31)#582 | 7.2%(-2.40)#23,537 |
| 8. | 66223 | 2.8% | 8.1%(-5.32)#629 | 7.2%(-4.40)#27,804 |
| 9. | 66224 | 2.4% | 8.1%(-5.72)#638 | 7.2%(-4.80)#28,280 |
1
Common Questions
What are the Top 5 Zip Codes with the Highest Percentage of Local Government Employees in Overland Park, KS?
Top 5 Zip Codes with the Highest Percentage of Local Government Employees in Overland Park, KS are:
What zip code has the Highest Percentage of Local Government Employees in Overland Park, KS?
66212 has the Highest Percentage of Local Government Employees in Overland Park, KS with 7.6%.
What is the Percentage of Local Government Employees in Overland Park, KS?
Percentage of Local Government Employees in Overland Park is 5.6%.
What is the Percentage of Local Government Employees in Kansas?
Percentage of Local Government Employees in Kansas is 8.1%.
What is the Percentage of Local Government Employees in the United States?
Percentage of Local Government Employees in the United States is 7.2%.