Zip Codes with the Highest Percentage of Mexican Population in Overland Park, KS
RELATED REPORTS & OPTIONS
Mexican
Overland Park
Compare Zip Codes
Map of Zip Codes with the Highest Percentage of Mexican Population in Overland Park
1.47%
100.00%
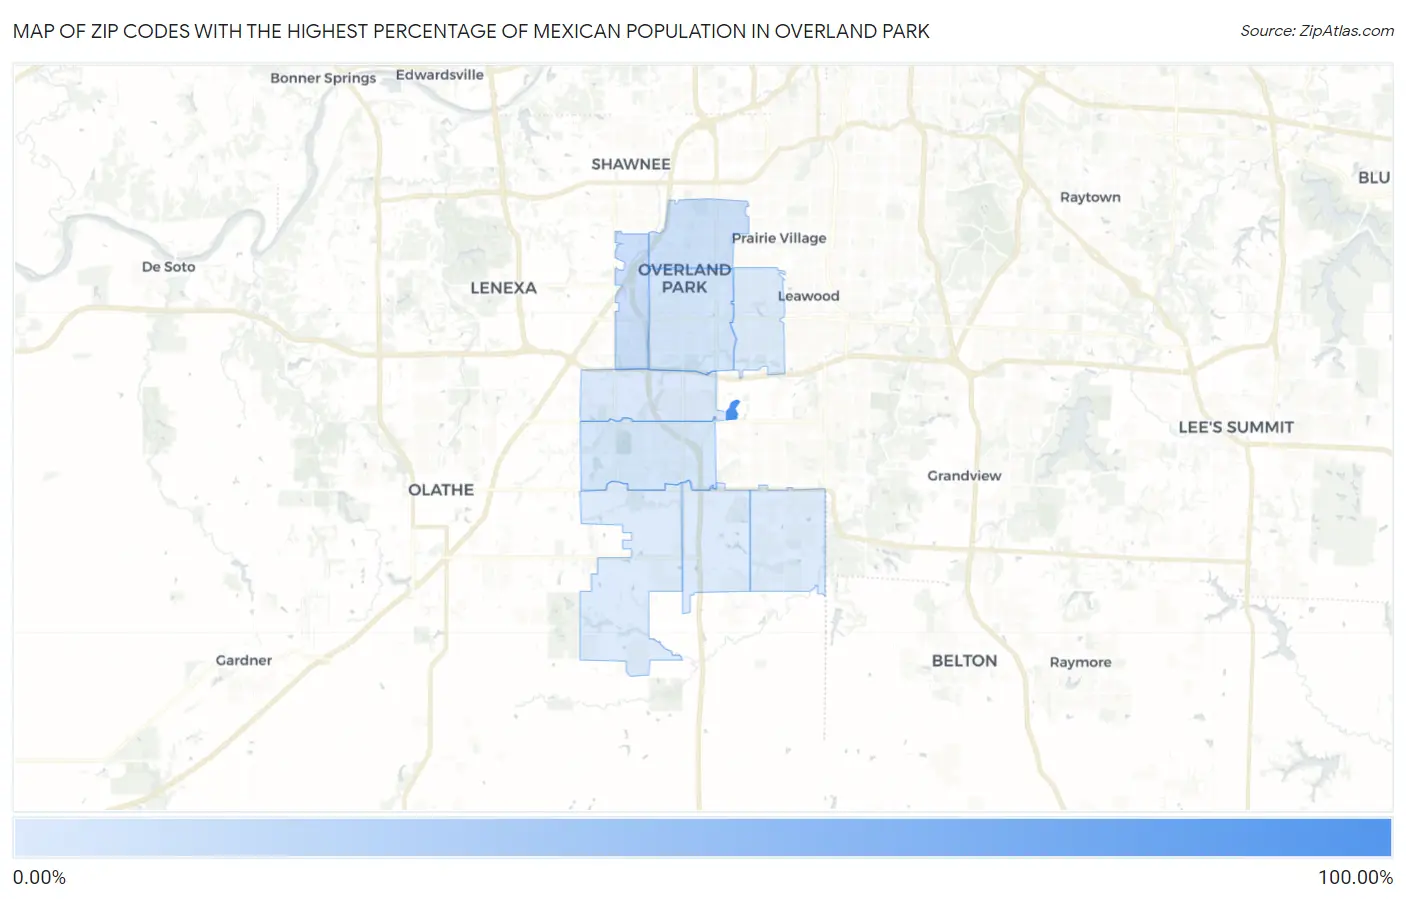
Zip Codes with the Highest Percentage of Mexican Population in Overland Park, KS
| Zip Code | Mexican | vs State | vs National | |
| 1. | 66251 | 100.00% | 9.97% (+90.0)#1 | 11.22% (+88.8)#33 |
| 2. | 66214 | 10.14% | 9.97% (+0.170)#108 | 11.22% (-1.08)#5,217 |
| 3. | 66204 | 9.36% | 9.97% (-0.612)#116 | 11.22% (-1.86)#5,556 |
| 4. | 66212 | 6.22% | 9.97% (-3.75)#179 | 11.22% (-5.00)#7,408 |
| 5. | 66213 | 4.26% | 9.97% (-5.71)#239 | 11.22% (-6.95)#9,380 |
| 6. | 66210 | 3.07% | 9.97% (-6.90)#313 | 11.22% (-8.15)#11,372 |
| 7. | 66221 | 1.70% | 9.97% (-8.27)#409 | 11.22% (-9.52)#15,130 |
| 8. | 66223 | 1.59% | 9.97% (-8.38)#420 | 11.22% (-9.62)#15,531 |
| 9. | 66207 | 1.49% | 9.97% (-8.48)#428 | 11.22% (-9.73)#15,925 |
| 10. | 66224 | 1.47% | 9.97% (-8.50)#431 | 11.22% (-9.75)#16,014 |
1
Common Questions
What are the Top 5 Zip Codes with the Highest Percentage of Mexican Population in Overland Park, KS?
Top 5 Zip Codes with the Highest Percentage of Mexican Population in Overland Park, KS are:
What zip code has the Highest Percentage of Mexican Population in Overland Park, KS?
66251 has the Highest Percentage of Mexican Population in Overland Park, KS with 100.00%.
What is the Percentage of Mexican Population in Overland Park, KS?
Percentage of Mexican Population in Overland Park is 4.38%.
What is the Percentage of Mexican Population in Kansas?
Percentage of Mexican Population in Kansas is 9.97%.
What is the Percentage of Mexican Population in the United States?
Percentage of Mexican Population in the United States is 11.22%.