Zip Codes with the Highest Percentage of Households with Income Above $200,000 in Overland Park, KS
RELATED REPORTS & OPTIONS
Household Income | $200k+
Overland Park
Compare Zip Codes
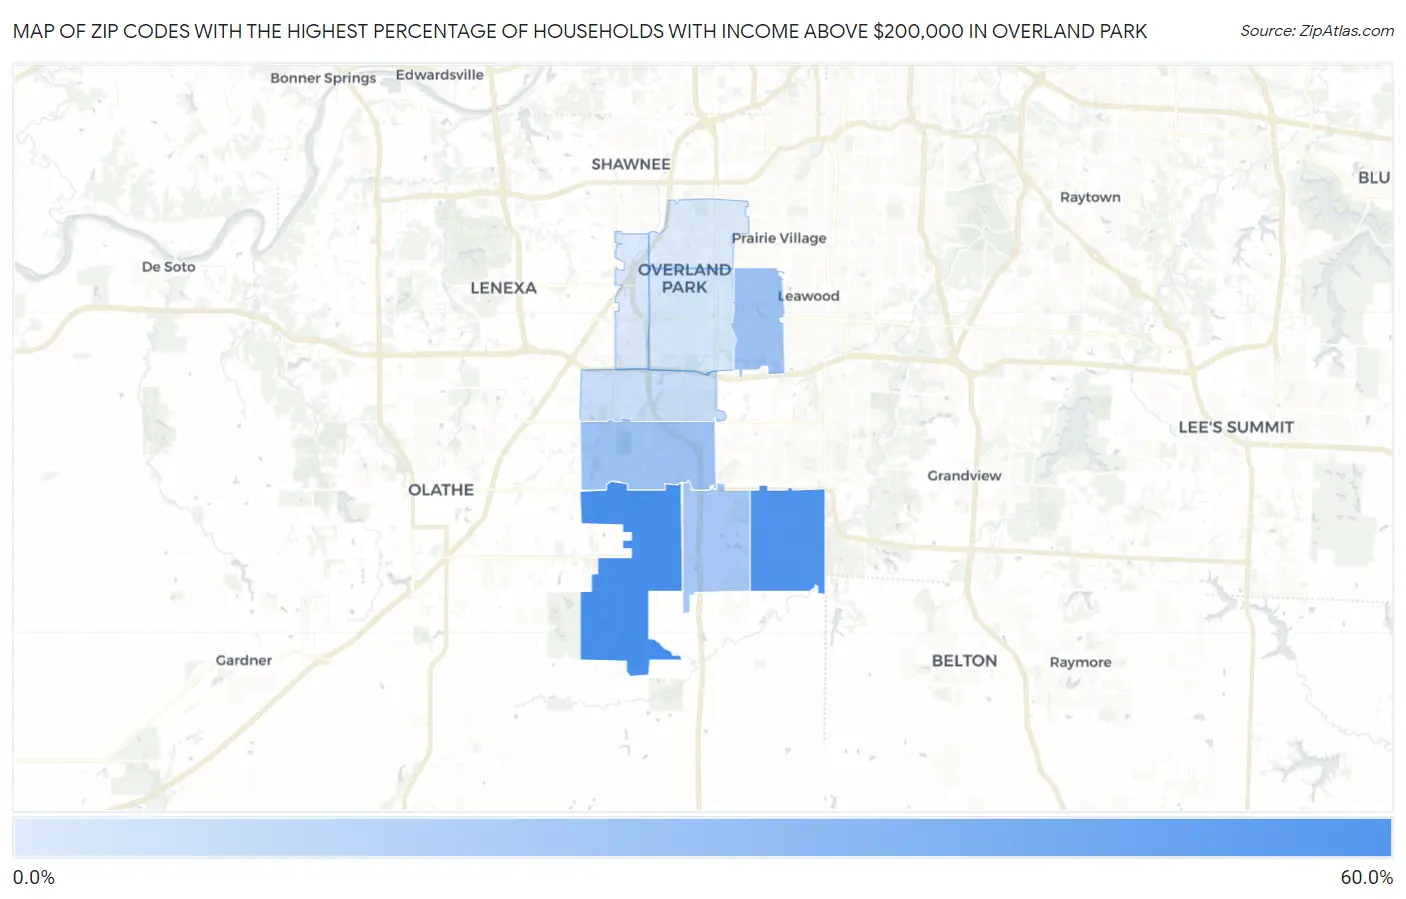
Map of Zip Codes with the Highest Percentage of Households with Income Above $200,000 in Overland Park
4.1%
50.9%
Zip Codes with the Highest Percentage of Households with Income Above $200,000 in Overland Park, KS
| Zip Code | Households with Income > $200k | vs State | vs National | |
| 1. | 66221 | 50.9% | 8.0%(+42.9)#1 | 11.4%(+39.5)#254 |
| 2. | 66224 | 47.4% | 8.0%(+39.4)#2 | 11.4%(+36.0)#343 |
| 3. | 66207 | 22.0% | 8.0%(+14.0)#26 | 11.4%(+10.6)#2,784 |
| 4. | 66213 | 21.9% | 8.0%(+13.9)#28 | 11.4%(+10.5)#2,795 |
| 5. | 66223 | 19.1% | 8.0%(+11.1)#32 | 11.4%(+7.70)#3,534 |
| 6. | 66210 | 9.7% | 8.0%(+1.70)#104 | 11.4%(-1.70)#8,561 |
| 7. | 66212 | 6.2% | 8.0%(-1.80)#190 | 11.4%(-5.20)#13,081 |
| 8. | 66214 | 4.7% | 8.0%(-3.30)#262 | 11.4%(-6.70)#16,318 |
| 9. | 66204 | 4.1% | 8.0%(-3.90)#303 | 11.4%(-7.30)#17,851 |
1
Common Questions
What are the Top 5 Zip Codes with the Highest Percentage of Households with Income Above $200,000 in Overland Park, KS?
Top 5 Zip Codes with the Highest Percentage of Households with Income Above $200,000 in Overland Park, KS are:
What zip code has the Highest Percentage of Households with Income Above $200,000 in Overland Park, KS?
66221 has the Highest Percentage of Households with Income Above $200,000 in Overland Park, KS with 50.9%.
What is the Percentage of Households with Income Above $200,000 in Overland Park, KS?
Percentage of Households with Income Above $200,000 in Overland Park is 18.3%.
What is the Percentage of Households with Income Above $200,000 in Kansas?
Percentage of Households with Income Above $200,000 in Kansas is 8.0%.
What is the Percentage of Households with Income Above $200,000 in the United States?
Percentage of Households with Income Above $200,000 in the United States is 11.4%.