Zip Codes with the Highest Percentage of Households Without a Vehicle in Overland Park, KS
RELATED REPORTS & OPTIONS
Households without a Cars
Overland Park
Compare Zip Codes
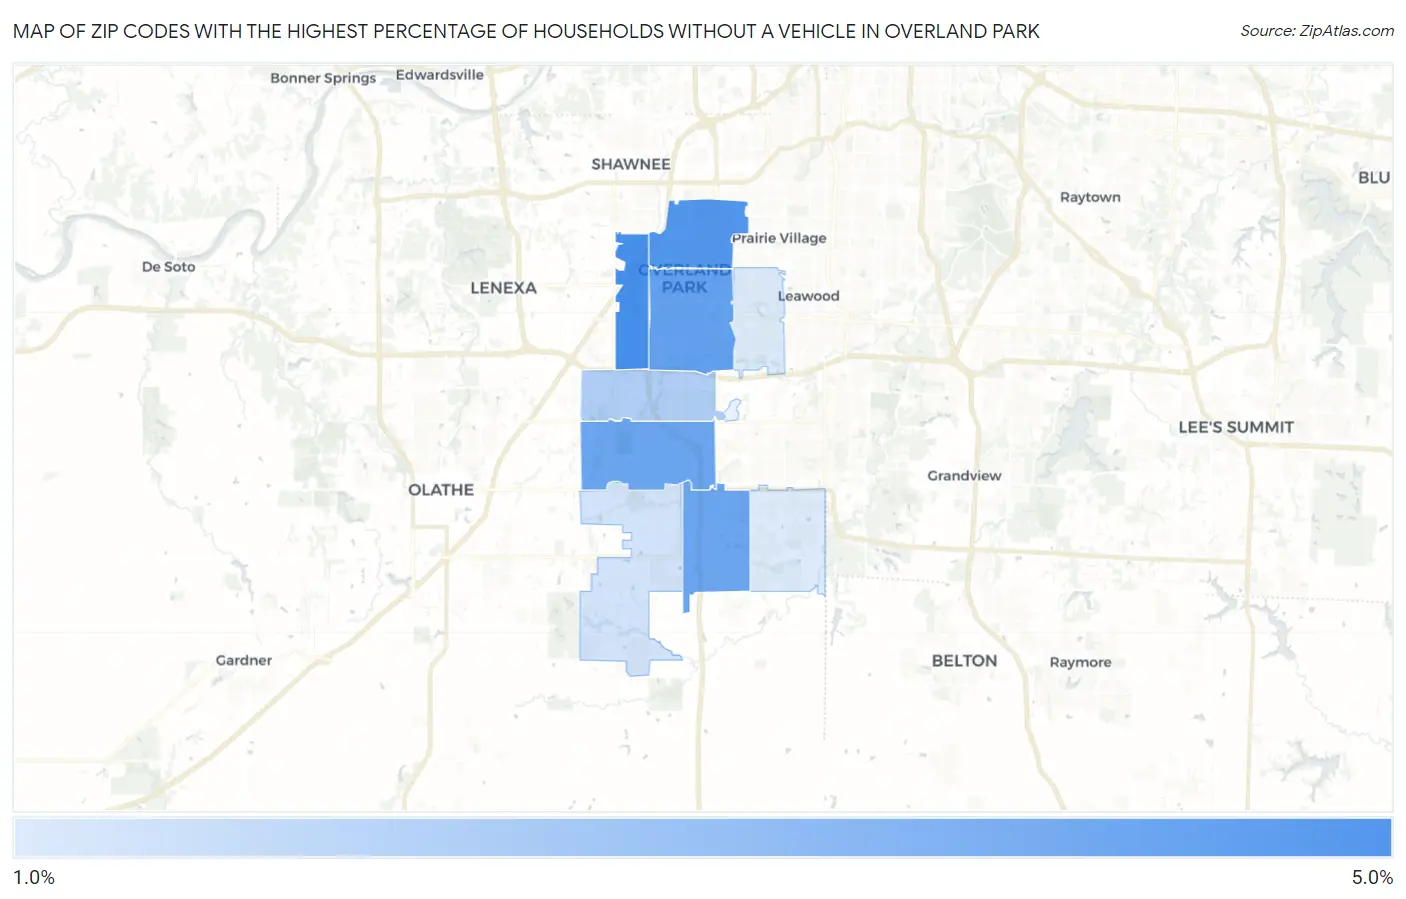
Map of Zip Codes with the Highest Percentage of Households Without a Vehicle in Overland Park
1.3%
5.0%
Zip Codes with the Highest Percentage of Households Without a Vehicle in Overland Park, KS
| Zip Code | Housholds Without a Car | vs State | vs National | |
| 1. | 66214 | 5.0% | 5.1%(-0.100)#186 | 8.3%(-3.30)#12,908 |
| 2. | 66204 | 4.7% | 5.1%(-0.400)#200 | 8.3%(-3.60)#13,690 |
| 3. | 66212 | 4.3% | 5.1%(-0.800)#226 | 8.3%(-4.00)#14,789 |
| 4. | 66213 | 4.1% | 5.1%(-1.00)#235 | 8.3%(-4.20)#15,394 |
| 5. | 66223 | 4.1% | 5.1%(-1.00)#236 | 8.3%(-4.20)#15,406 |
| 6. | 66210 | 2.4% | 5.1%(-2.70)#360 | 8.3%(-5.90)#21,082 |
| 7. | 66221 | 1.6% | 5.1%(-3.50)#428 | 8.3%(-6.70)#23,779 |
| 8. | 66207 | 1.3% | 5.1%(-3.80)#450 | 8.3%(-7.00)#24,752 |
| 9. | 66224 | 1.3% | 5.1%(-3.80)#451 | 8.3%(-7.00)#24,766 |
1
Common Questions
What are the Top 5 Zip Codes with the Highest Percentage of Households Without a Vehicle in Overland Park, KS?
Top 5 Zip Codes with the Highest Percentage of Households Without a Vehicle in Overland Park, KS are:
What zip code has the Highest Percentage of Households Without a Vehicle in Overland Park, KS?
66214 has the Highest Percentage of Households Without a Vehicle in Overland Park, KS with 5.0%.
What is the Percentage of Households Without a Vehicle in Overland Park, KS?
Percentage of Households Without a Vehicle in Overland Park is 3.6%.
What is the Percentage of Households Without a Vehicle in Kansas?
Percentage of Households Without a Vehicle in Kansas is 5.1%.
What is the Percentage of Households Without a Vehicle in the United States?
Percentage of Households Without a Vehicle in the United States is 8.3%.