Zip Codes with the Highest Percentage of Households Residing in Detached Homes in Overland Park, KS

RELATED REPORTS & OPTIONS

Detached Home Residency
Population
Families and Households
Female Fertility
Female Fertility (Unmarried)
Race (Community Size)
Race (Percentage)
Ancestry (Community Size)
AfghanAfricanAlbanianAmericanApacheArabArgentineanArmenianAustralianAustrianBelgianBhutaneseBlackfeetBrazilianBritishBulgarianBurmeseCanadianCelticCentral AmericanCentral American IndianCherokeeChippewaChoctawColombianCreekCroatianCubanCzechCzechoslovakianDanishDelawareDominicanDutchEastern EuropeanEgyptianEnglishEthiopianEuropeanFilipinoFinnishFrenchFrench CanadianGermanGreekGuamanian / ChamorroGuatemalanHaitianHonduranHungarianIndian (Asian)IranianIraqiIrishIsraeliItalianJamaicanJapaneseJordanianKenyanKoreanLaotianLatvianLebaneseLithuanianLuxembourgerMalaysianMexicanMexican American IndianMongolianNative HawaiianNavajoNigerianNorthern EuropeanNorwegianPakistaniPalestinianPanamanianParaguayanPennsylvania GermanPeruvianPolishPortuguesePotawatomiPuerto RicanRomanianRussianSalvadoranScandinavianScotch-IrishScottishSeminoleSerbianSiouxSlavicSlovakSloveneSouth AfricanSouth AmericanSpaniardSpanishSri LankanSubsaharan AfricanSudaneseSwedishSwissSyrianThaiTrinidadian and TobagonianTurkishUkrainianVenezuelanVietnameseWelshWest Indian
Ancestry (Percentage)
AfghanAfricanAlbanianAmericanApacheArabArgentineanArmenianAustralianAustrianBelgianBhutaneseBlackfeetBrazilianBritishBulgarianBurmeseCanadianCelticCentral AmericanCentral American IndianCherokeeChippewaChoctawColombianCreekCroatianCubanCzechCzechoslovakianDanishDelawareDominicanDutchEastern EuropeanEgyptianEnglishEthiopianEuropeanFilipinoFinnishFrenchFrench CanadianGermanGreekGuamanian / ChamorroGuatemalanHaitianHonduranHungarianIndian (Asian)IranianIraqiIrishIsraeliItalianJamaicanJapaneseJordanianKenyanKoreanLaotianLatvianLebaneseLithuanianLuxembourgerMalaysianMexicanMexican American IndianMongolianNative HawaiianNavajoNigerianNorthern EuropeanNorwegianPakistaniPalestinianPanamanianParaguayanPennsylvania GermanPeruvianPolishPortuguesePotawatomiPuerto RicanRomanianRussianSalvadoranScandinavianScotch-IrishScottishSeminoleSerbianSiouxSlavicSlovakSloveneSouth AfricanSouth AmericanSpaniardSpanishSri LankanSubsaharan AfricanSudaneseSwedishSwissSyrianThaiTrinidadian and TobagonianTurkishUkrainianVenezuelanVietnameseWelshWest Indian
Immigrant Origin (Total)
Immigrant Origin (Percentage)
Income
Income (Families)
Income (Households)
Poverty
Poverty (Families)
Unemployment
Employment Occupations
Employment Industries
Employer Class
Commute Time
Commute Means
School Enrollment
Education by Degree Field
Occupancy
Finances
Physical Characteristics
Overland Park
Compare Zip Codes
Comparison Subject

Map of Zip Codes with the Highest Percentage of Households Residing in Detached Homes in Overland Park

41.8%
87.3%
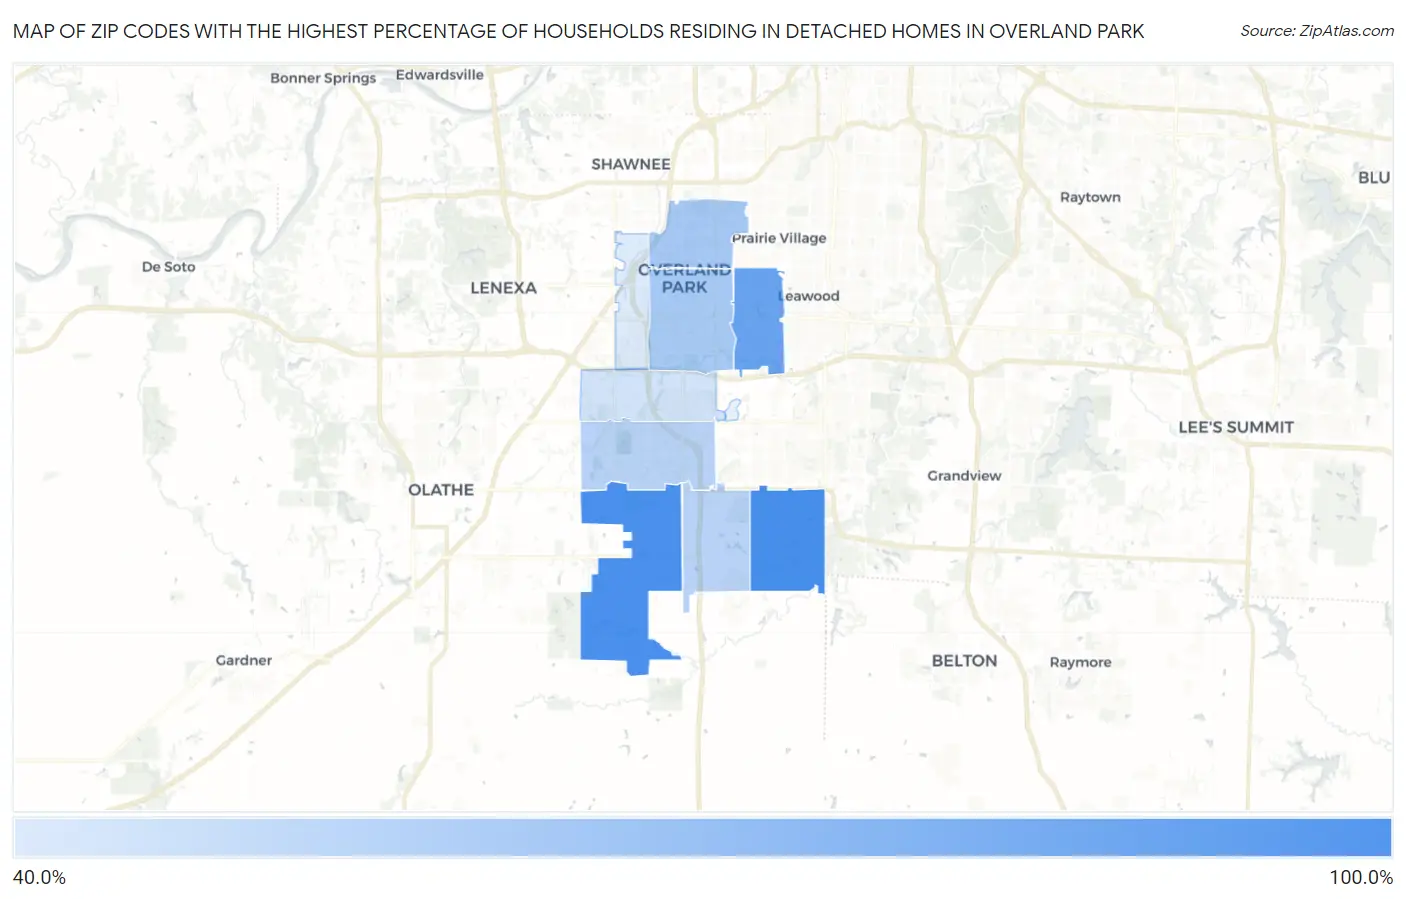
Zip Codes with the Highest Percentage of Households Residing in Detached Homes in Overland Park Map

Zip Codes with the Highest Percentage of Households Residing in Detached Homes in Overland Park, KS

Zip Code Detached Home Residency vs State vs National
1. 66224 87.3% 73.4% (+13.9)#342 62.5% (+24.8)#8,425
2. 66221 86.2% 73.4% (+12.8)#374 62.5% (+23.7)#9,280
3. 66207 75.7% 73.4% (+2.30)#569 62.5% (+13.2)#17,624
4. 66204 57.4% 73.4% (-16.0)#654 62.5% (-5.10)#27,360
5. 66212 56.7% 73.4% (-16.7)#657 62.5% (-5.80)#27,590
6. 66213 52.0% 73.4% (-21.4)#668 62.5% (-10.5)#28,766
7. 66223 51.7% 73.4% (-21.7)#669 62.5% (-10.8)#28,828
8. 66210 44.6% 73.4% (-28.8)#682 62.5% (-17.9)#30,006
9. 66214 41.8% 73.4% (-31.6)#683 62.5% (-20.7)#30,345

Common Questions

What are the Top 5 Zip Codes with the Highest Percentage of Households Residing in Detached Homes in Overland Park, KS?
Top 5 Zip Codes with the Highest Percentage of Households Residing in Detached Homes in Overland Park, KS are:
#1
87.3%
#2
86.2%
#3
75.7%
#4
57.4%
#5
56.7%
What zip code has the Highest Percentage of Households Residing in Detached Homes in Overland Park, KS?
66224 has the Highest Percentage of Households Residing in Detached Homes in Overland Park, KS with 87.3%.
What is the Percentage of Households Residing in Detached Homes in Overland Park, KS?
Percentage of Households Residing in Detached Homes in Overland Park is 58.8%.
What is the Percentage of Households Residing in Detached Homes in Kansas?
Percentage of Households Residing in Detached Homes in Kansas is 73.4%.
What is the Percentage of Households Residing in Detached Homes in the United States?
Percentage of Households Residing in Detached Homes in the United States is 62.5%.