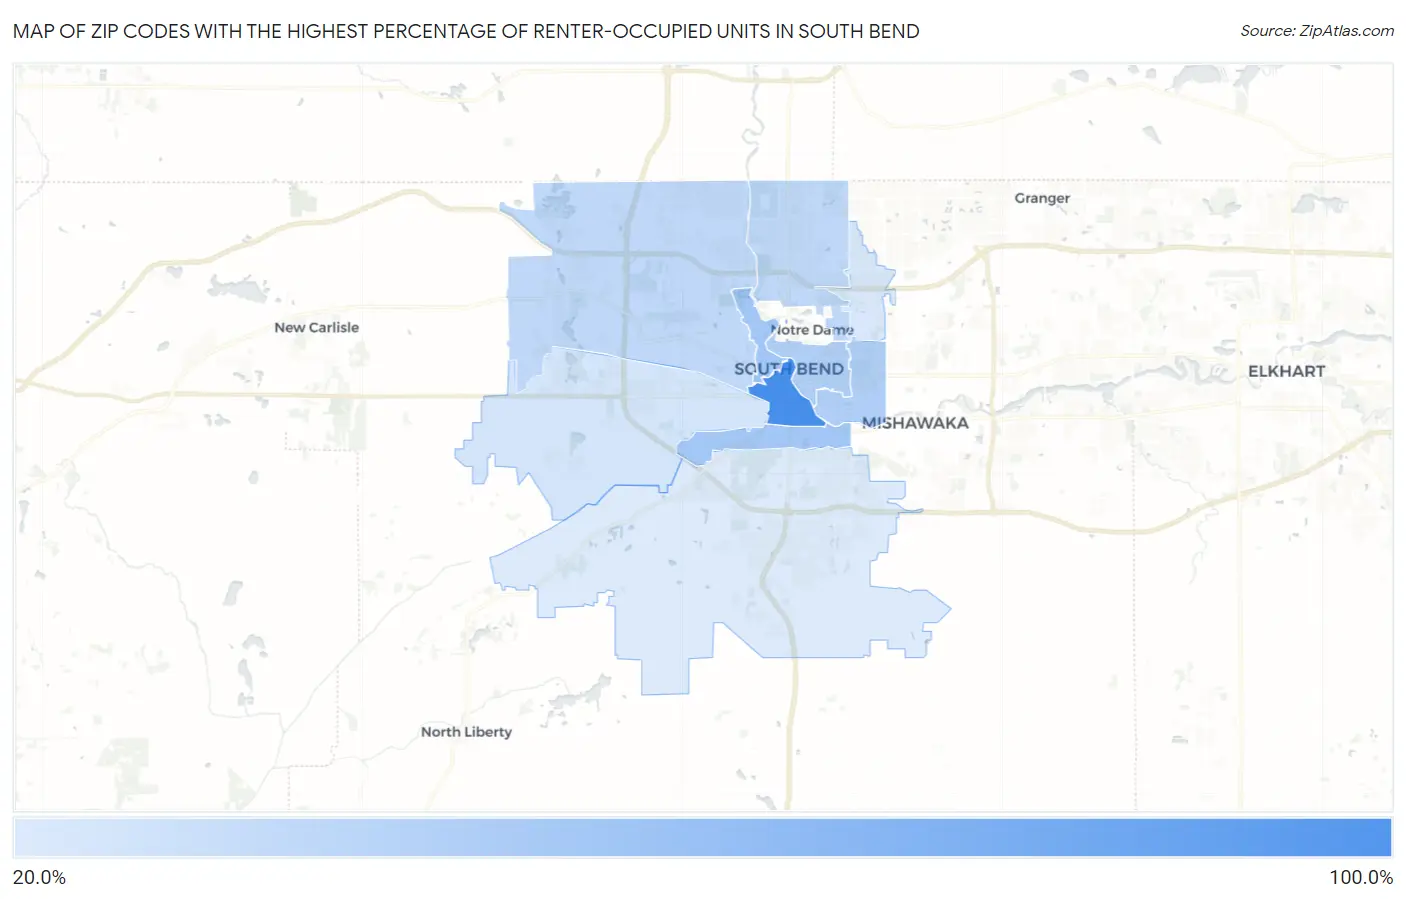
Zip Codes with the Highest Percentage of Renter-Occupied Units in South Bend, IN
RELATED REPORTS & OPTIONS
Highest Renter-Occupied
South Bend
Compare Zip Codes
Map of Zip Codes with the Highest Percentage of Renter-Occupied Units in South Bend
23.1%
80.6%
Zip Codes with the Highest Percentage of Renter-Occupied Units in South Bend, IN
| Zip Code | % Renter-Occupied | vs State | vs National | |
| 1. | 46601 | 80.6% | 29.9%(+50.7)#7 | 35.2%(+45.4)#656 |
| 2. | 46624 | 75.0% | 29.9%(+45.1)#11 | 35.2%(+39.8)#836 |
| 3. | 46613 | 42.9% | 29.9%(+13.0)#74 | 35.2%(+7.70)#4,603 |
| 4. | 46616 | 42.8% | 29.9%(+12.9)#75 | 35.2%(+7.60)#4,635 |
| 5. | 46615 | 38.1% | 29.9%(+8.22)#99 | 35.2%(+2.93)#6,050 |
| 6. | 46617 | 37.3% | 29.9%(+7.46)#102 | 35.2%(+2.17)#6,325 |
| 7. | 46628 | 33.0% | 29.9%(+3.10)#145 | 35.2%(-2.20)#8,332 |
| 8. | 46637 | 32.9% | 29.9%(+3.00)#147 | 35.2%(-2.29)#8,381 |
| 9. | 46619 | 25.9% | 29.9%(-3.94)#233 | 35.2%(-9.24)#12,858 |
| 10. | 46635 | 24.3% | 29.9%(-5.62)#265 | 35.2%(-10.9)#14,285 |
| 11. | 46614 | 23.1% | 29.9%(-6.76)#288 | 35.2%(-12.1)#15,329 |
1
Common Questions
What are the Top 10 Zip Codes with the Highest Percentage of Renter-Occupied Units in South Bend, IN?
Top 10 Zip Codes with the Highest Percentage of Renter-Occupied Units in South Bend, IN are:
What zip code has the Highest Percentage of Renter-Occupied Units in South Bend, IN?
46601 has the Highest Percentage of Renter-Occupied Units in South Bend, IN with 80.6%.
What is the Percentage of Renter-Occupied Units in South Bend, IN?
Percentage of Renter-Occupied Units in South Bend is 41.5%.
What is the Percentage of Renter-Occupied Units in Indiana?
Percentage of Renter-Occupied Units in Indiana is 29.9%.
What is the Percentage of Renter-Occupied Units in the United States?
Percentage of Renter-Occupied Units in the United States is 35.2%.