Zip Codes with the Highest Percentage of Population Employed in Computer & Mathematics in Dubuque, IA
RELATED REPORTS & OPTIONS
Computer & Mathematics
Dubuque
Compare Zip Codes
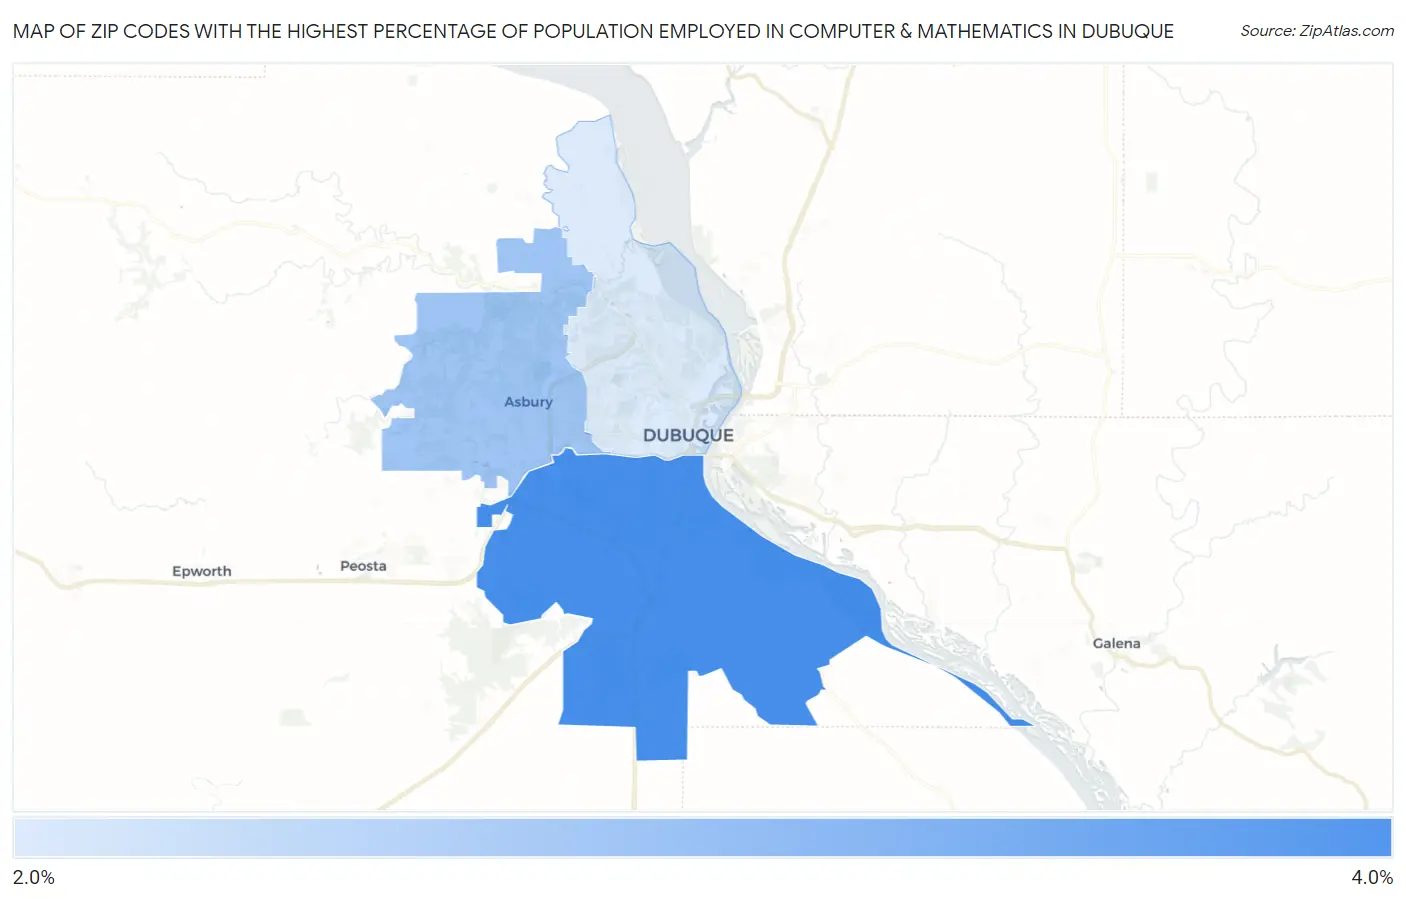
Map of Zip Codes with the Highest Percentage of Population Employed in Computer & Mathematics in Dubuque
2.4%
3.0%
Zip Codes with the Highest Percentage of Population Employed in Computer & Mathematics in Dubuque, IA
| Zip Code | % Employed | vs State | vs National | |
| 1. | 52003 | 3.0% | 2.7%(+0.323)#119 | 3.5%(-0.493)#7,626 |
| 2. | 52002 | 2.7% | 2.7%(-0.032)#157 | 3.5%(-0.848)#8,925 |
| 3. | 52001 | 2.4% | 2.7%(-0.283)#182 | 3.5%(-1.10)#9,941 |
1
Common Questions
What are the Top Zip Codes with the Highest Percentage of Population Employed in Computer & Mathematics in Dubuque, IA?
Top Zip Codes with the Highest Percentage of Population Employed in Computer & Mathematics in Dubuque, IA are:
What zip code has the Highest Percentage of Population Employed in Computer & Mathematics in Dubuque, IA?
52003 has the Highest Percentage of Population Employed in Computer & Mathematics in Dubuque, IA with 3.0%.
What is the Percentage of Population Employed in Computer & Mathematics in Dubuque, IA?
Percentage of Population Employed in Computer & Mathematics in Dubuque is 2.7%.
What is the Percentage of Population Employed in Computer & Mathematics in Iowa?
Percentage of Population Employed in Computer & Mathematics in Iowa is 2.7%.
What is the Percentage of Population Employed in Computer & Mathematics in the United States?
Percentage of Population Employed in Computer & Mathematics in the United States is 3.5%.