Zip Codes with the Highest Percentage of Population Employed in Accommodation & Food Services in Lithonia, GA
RELATED REPORTS & OPTIONS
Accommodation & Food Services
Lithonia
Compare Zip Codes
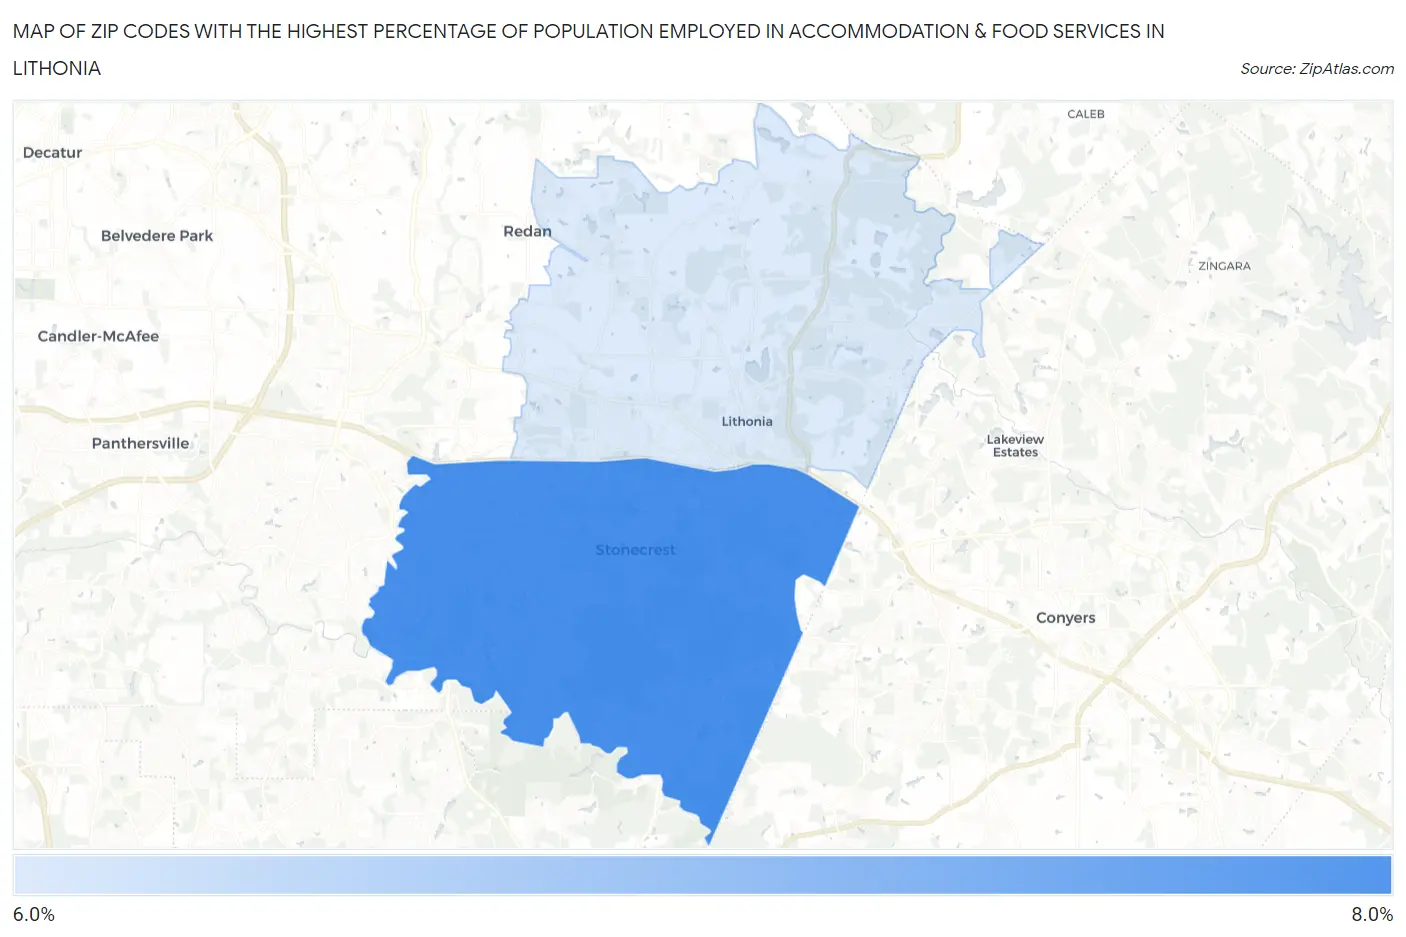
Map of Zip Codes with the Highest Percentage of Population Employed in Accommodation & Food Services in Lithonia
6.5%
6.9%
Zip Codes with the Highest Percentage of Population Employed in Accommodation & Food Services in Lithonia, GA
| Zip Code | % Employed | vs State | vs National | |
| 1. | 30038 | 6.9% | 7.2%(-0.307)#287 | 6.9%(+0.019)#10,601 |
| 2. | 30058 | 6.5% | 7.2%(-0.699)#323 | 6.9%(-0.374)#11,828 |
1
Common Questions
What are the Top Zip Codes with the Highest Percentage of Population Employed in Accommodation & Food Services in Lithonia, GA?
Top Zip Codes with the Highest Percentage of Population Employed in Accommodation & Food Services in Lithonia, GA are:
What zip code has the Highest Percentage of Population Employed in Accommodation & Food Services in Lithonia, GA?
30038 has the Highest Percentage of Population Employed in Accommodation & Food Services in Lithonia, GA with 6.9%.
What is the Percentage of Population Employed in Accommodation & Food Services in Lithonia, GA?
Percentage of Population Employed in Accommodation & Food Services in Lithonia is 8.5%.
What is the Percentage of Population Employed in Accommodation & Food Services in Georgia?
Percentage of Population Employed in Accommodation & Food Services in Georgia is 7.2%.
What is the Percentage of Population Employed in Accommodation & Food Services in the United States?
Percentage of Population Employed in Accommodation & Food Services in the United States is 6.9%.