Pima Male Disability

COMPARE

Pima
Race
Ancestry
AfghanAfricanAlaska NativeAlaskan AthabascanAlbanianAleutAlsatianAmericanApacheArabArapahoArgentineanArmenianAssyrian/Chaldean/SyriacAustralianAustrianBahamianBangladeshiBarbadianBasqueBelgianBelizeanBermudanBhutaneseBlackfeetBolivianBrazilianBritishBritish West IndianBulgarianBurmeseCajunCambodianCanadianCape VerdeanCarpatho RusynCelticCentral AmericanCentral American IndianCherokeeCheyenneChickasawChileanChineseChippewaChoctawColombianColvilleComancheCosta RicanCreeCreekCroatianCrowCubanCypriotCzechCzechoslovakianDanishDelawareDominicanDutchDutch West IndianEastern EuropeanEcuadorianEgyptianEnglishEstonianEthiopianEuropeanFijianFilipinoFinnishFrenchFrench American IndianFrench CanadianGermanGerman RussianGhanaianGreekGuamanian/ChamorroGuatemalanGuyaneseHaitianHmongHonduranHopiHoumaHungarianIcelanderIndian (Asian)IndonesianInupiatIranianIraqiIrishIroquoisIsraeliItalianJamaicanJapaneseJordanianKenyanKiowaKoreanLaotianLatvianLebaneseLiberianLithuanianLumbeeLuxembourgerMacedonianMalaysianMalteseMarshalleseMenomineeMexicanMexican American IndianMongolianMoroccanNative HawaiianNavajoNepaleseNew ZealanderNicaraguanNigerianNorthern EuropeanNorwegianOkinawanOsageOttawaPaiutePakistaniPalestinianPanamanianParaguayanPennsylvania GermanPeruvianPimaPolishPortuguesePotawatomiPuebloPuerto RicanPuget Sound SalishRomanianRussianSalvadoranSamoanScandinavianScotch-IrishScottishSeminoleSenegaleseSerbianShoshoneSierra LeoneanSiouxSlavicSlovakSloveneSomaliSouth AfricanSouth AmericanSouth American IndianSoviet UnionSpaniardSpanishSpanish AmericanSpanish American IndianSri LankanSubsaharan AfricanSudaneseSwedishSwissSyrianTaiwaneseThaiTlingit-HaidaTohono O'OdhamTonganTrinidadian and TobagonianTsimshianTurkishU.S. Virgin IslanderUgandanUkrainianUruguayanUteVenezuelanVietnameseWelshWest IndianYakamaYaquiYugoslavianYumanYup'ikZimbabwean
Immigration
NonimmigrantsImmigrantsAfghanistanAfricaAlbaniaArgentinaArmeniaAsiaAustraliaAustriaBahamasBangladeshBarbadosBelarusBelgiumBelizeBoliviaBosnia and HerzegovinaBrazilBulgariaBurma/MyanmarCabo VerdeCambodiaCameroonCanadaCaribbeanCentral AmericaChileChinaColombiaCongoCosta RicaCroatiaCubaCzechoslovakiaDenmarkDominicaDominican RepublicEastern AfricaEastern AsiaEastern EuropeEcuadorEgyptEl SalvadorEnglandEritreaEthiopiaEuropeFijiFranceGermanyGhanaGreeceGrenadaGuatemalaGuyanaHaitiHondurasHong KongHungaryIndiaIndonesiaIranIraqIrelandIsraelItalyJamaicaJapanJordanKazakhstanKenyaKoreaKuwaitLaosLatin AmericaLatviaLebanonLiberiaLithuaniaMalaysiaMexicoMicronesiaMiddle AfricaMoldovaMoroccoNepalNetherlandsNicaraguaNigeriaNorth AmericaNorth MacedoniaNorthern AfricaNorthern EuropeNorwayOceaniaPakistanPanamaPeruPhilippinesPolandPortugalRomaniaRussiaSaudi ArabiaScotlandSenegalSerbiaSierra LeoneSingaporeSomaliaSouth AfricaSouth AmericaSouth Central AsiaSouth Eastern AsiaSouthern EuropeSpainSri LankaSt. Vincent and the GrenadinesSudanSwedenSwitzerlandSyriaTaiwanThailandTrinidad and TobagoTurkeyUgandaUkraineUruguayUzbekistanVenezuelaVietnamWest IndiesWestern AfricaWestern AsiaWestern EuropeYemenZaireZimbabweAzores
Select to Compare
Race
Ancestry
AfghanAfricanAlaska NativeAlaskan AthabascanAlbanianAleutAlsatianAmericanApacheArabArapahoArgentineanArmenianAssyrian/Chaldean/SyriacAustralianAustrianBahamianBangladeshiBarbadianBasqueBelgianBelizeanBermudanBhutaneseBlackfeetBolivianBrazilianBritishBritish West IndianBulgarianBurmeseCajunCambodianCanadianCape VerdeanCarpatho RusynCelticCentral AmericanCentral American IndianCherokeeCheyenneChickasawChileanChineseChippewaChoctawColombianColvilleComancheCosta RicanCreeCreekCroatianCrowCubanCypriotCzechCzechoslovakianDanishDelawareDominicanDutchDutch West IndianEastern EuropeanEcuadorianEgyptianEnglishEstonianEthiopianEuropeanFijianFilipinoFinnishFrenchFrench American IndianFrench CanadianGermanGerman RussianGhanaianGreekGuamanian/ChamorroGuatemalanGuyaneseHaitianHmongHonduranHopiHoumaHungarianIcelanderIndian (Asian)IndonesianInupiatIranianIraqiIrishIroquoisIsraeliItalianJamaicanJapaneseJordanianKenyanKiowaKoreanLaotianLatvianLebaneseLiberianLithuanianLumbeeLuxembourgerMacedonianMalaysianMalteseMarshalleseMenomineeMexicanMexican American IndianMongolianMoroccanNative HawaiianNavajoNepaleseNew ZealanderNicaraguanNigerianNorthern EuropeanNorwegianOkinawanOsageOttawaPaiutePakistaniPalestinianPanamanianParaguayanPennsylvania GermanPeruvianPolishPortuguesePotawatomiPuebloPuerto RicanPuget Sound SalishRomanianRussianSalvadoranSamoanScandinavianScotch-IrishScottishSeminoleSenegaleseSerbianShoshoneSierra LeoneanSiouxSlavicSlovakSloveneSomaliSouth AfricanSouth AmericanSouth American IndianSoviet UnionSpaniardSpanishSpanish AmericanSpanish American IndianSri LankanSubsaharan AfricanSudaneseSwedishSwissSyrianTaiwaneseThaiTlingit-HaidaTohono O'OdhamTonganTrinidadian and TobagonianTsimshianTurkishU.S. Virgin IslanderUgandanUkrainianUruguayanUteVenezuelanVietnameseWelshWest IndianYakamaYaquiYugoslavianYumanYup'ikZimbabwean
Immigration
NonimmigrantsImmigrantsAfghanistanAfricaAlbaniaArgentinaArmeniaAsiaAustraliaAustriaBahamasBangladeshBarbadosBelarusBelgiumBelizeBoliviaBosnia and HerzegovinaBrazilBulgariaBurma/MyanmarCabo VerdeCambodiaCameroonCanadaCaribbeanCentral AmericaChileChinaColombiaCongoCosta RicaCroatiaCubaCzechoslovakiaDenmarkDominicaDominican RepublicEastern AfricaEastern AsiaEastern EuropeEcuadorEgyptEl SalvadorEnglandEritreaEthiopiaEuropeFijiFranceGermanyGhanaGreeceGrenadaGuatemalaGuyanaHaitiHondurasHong KongHungaryIndiaIndonesiaIranIraqIrelandIsraelItalyJamaicaJapanJordanKazakhstanKenyaKoreaKuwaitLaosLatin AmericaLatviaLebanonLiberiaLithuaniaMalaysiaMexicoMicronesiaMiddle AfricaMoldovaMoroccoNepalNetherlandsNicaraguaNigeriaNorth AmericaNorth MacedoniaNorthern AfricaNorthern EuropeNorwayOceaniaPakistanPanamaPeruPhilippinesPolandPortugalRomaniaRussiaSaudi ArabiaScotlandSenegalSerbiaSierra LeoneSingaporeSomaliaSouth AfricaSouth AmericaSouth Central AsiaSouth Eastern AsiaSouthern EuropeSpainSri LankaSt. Vincent and the GrenadinesSudanSwedenSwitzerlandSyriaTaiwanThailandTrinidad and TobagoTurkeyUgandaUkraineUruguayUzbekistanVenezuelaVietnamWest IndiesWestern AfricaWestern AsiaWestern EuropeYemenZaireZimbabweAzores
Male Disability
Income
Poverty
Unemployment
Labor Participation
Family Structure
Vehicle Availability
Education Level
Disability

Pima Male Disability
Tragic

12.8%
DISABILITY | MALES
0.0/ 100
METRIC RATING
290th/ 347
METRIC RANK

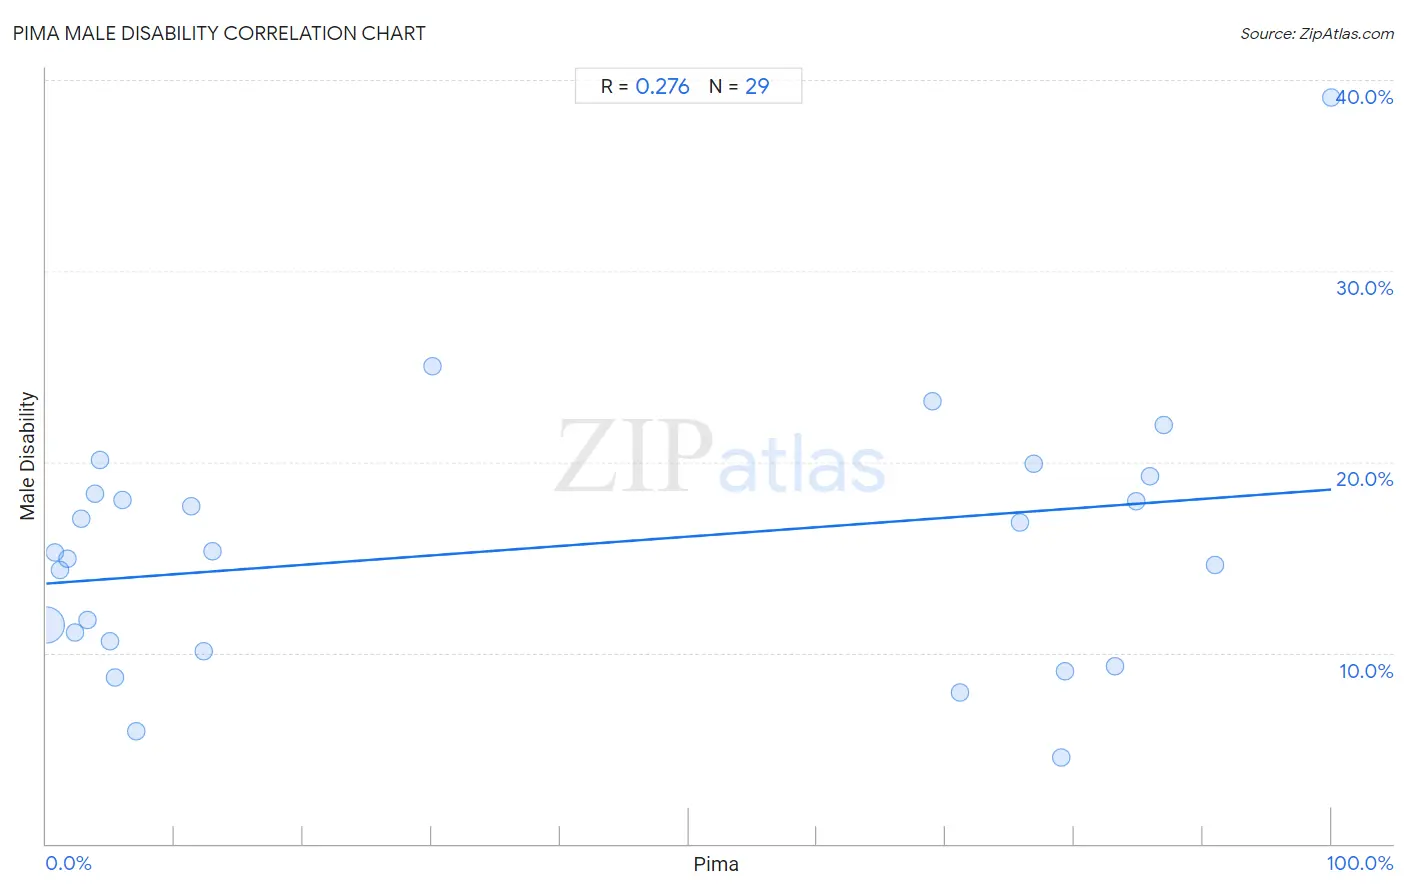
Pima Male Disability Correlation Chart

The statistical analysis conducted on geographies consisting of 61,540,793 people shows a weak positive correlation between the proportion of Pima and percentage of males with a disability in the United States with a correlation coefficient (R) of 0.276 and weighted average of 12.8%. On average, for every 1% (one percent) increase in Pima within a typical geography, there is an increase of 0.049% in percentage of males with a disability.
Pima Male Disability
It is essential to understand that the correlation between the percentage of Pima and percentage of males with a disability does not imply a direct cause-and-effect relationship. It remains uncertain whether the presence of Pima influences an upward or downward trend in the level of percentage of males with a disability within an area, or if Pima simply ended up residing in those areas with higher or lower levels of percentage of males with a disability due to other factors.

Demographics Similar to Pima by Male Disability

In terms of male disability, the demographic groups most similar to Pima are White/Caucasian (12.8%, a difference of 0.090%), Immigrants from Cabo Verde (12.8%, a difference of 0.15%), English (12.8%, a difference of 0.15%), Yup'ik (12.8%, a difference of 0.34%), and Yaqui (12.9%, a difference of 0.44%).
DemographicsRating | RankMale Disability
Germans
0.0
/100
|
#283
Tragic
12.7%
Spanish
0.0
/100
|
#284
Tragic
12.7%
Welsh
0.0
/100
|
#285
Tragic
12.7%
Scottish
0.0
/100
|
#286
Tragic
12.8%
Cape Verdeans
0.0
/100
|
#287
Tragic
12.8%
Yup'ik
0.0
/100
|
#288
Tragic
12.8%
Immigrants from Cabo Verde
0.0
/100
|
#289
Tragic
12.8%
Pima
0.0
/100
|
#290
Tragic
12.8%
Whites/Caucasians
0.0
/100
|
#291
Tragic
12.8%
English
0.0
/100
|
#292
Tragic
12.8%
Yaqui
0.0
/100
|
#293
Tragic
12.9%
Marshallese
0.0
/100
|
#294
Tragic
12.9%
Immigrants from Micronesia
0.0
/100
|
#295
Tragic
12.9%
Nonimmigrants
0.0
/100
|
#296
Tragic
12.9%
Inupiat
0.0
/100
|
#297
Tragic
13.0%

Pima Male Disability Correlation Summary

MeasurementPima DataMale Disability Data
Minimum0.038%4.5%
Maximum100.0%39.1%
Range100.0%34.6%
Mean37.7%15.5%
Median12.3%15.3%
Interquartile 25% (IQ1)3.5%10.3%
Interquartile 75% (IQ3)79.1%18.8%
Interquartile Range (IQR)75.6%8.5%
Standard Deviation (Sample)38.6%6.9%
Standard Deviation (Population)37.9%6.8%

Correlation Details

Pima PercentileSample SizeMale Disability
[
0.0%
-
0.5%
]
0.038%
60,538,17611.4%
[
0.5%
-
1.0%
]
0.71%
540,83815.3%
[
1.0%
-
1.5%
]
1.10%
224,37214.3%
[
1.5%
-
2.0%
]
1.66%
66,70214.9%
[
2.0%
-
2.5%
]
2.23%
53,05411.1%
[
2.5%
-
3.0%
]
2.76%
5,07817.0%
[
3.0%
-
3.5%
]
3.20%
7,27811.7%
[
3.5%
-
4.0%
]
3.77%
3,42618.4%
[
4.0%
-
4.5%
]
4.15%
5,83620.1%
[
4.5%
-
5.0%
]
4.99%
51,15610.6%
[
5.0%
-
5.5%
]
5.32%
1,3718.7%
[
5.5%
-
6.0%
]
5.92%
2,02718.0%
[
7.0%
-
7.5%
]
7.01%
1,3705.9%
[
11.0%
-
11.5%
]
11.29%
17,65917.7%
[
12.0%
-
12.5%
]
12.28%
1,27010.1%
[
12.5%
-
13.0%
]
12.92%
38715.3%
[
30.0%
-
30.5%
]
30.03%
38325.0%
[
68.5%
-
69.0%
]
68.98%
33223.2%
[
71.0%
-
71.5%
]
71.13%
4787.9%
[
75.5%
-
76.0%
]
75.80%
1,83516.8%
[
76.5%
-
77.0%
]
76.81%
47019.9%
[
78.5%
-
79.0%
]
78.99%
2,7134.5%
[
79.0%
-
79.5%
]
79.26%
4,5389.0%
[
83.0%
-
83.5%
]
83.14%
4,1399.3%
[
84.5%
-
85.0%
]
84.86%
73317.9%
[
85.5%
-
86.0%
]
85.85%
61519.3%
[
86.5%
-
87.0%
]
86.98%
3,26521.9%
[
90.5%
-
91.0%
]
90.94%
80614.6%
[
99.5%
-
100.0%
]
100.00%
48639.1%