Welsh Male Disability
COMPARE
Welsh
Select to Compare
Male Disability
Welsh Male Disability
12.7%
DISABILITY | MALES
0.0/ 100
METRIC RATING
285th/ 347
METRIC RANK
Welsh Male Disability Correlation Chart
The statistical analysis conducted on geographies consisting of 528,469,982 people shows a poor positive correlation between the proportion of Welsh and percentage of males with a disability in the United States with a correlation coefficient (R) of 0.154 and weighted average of 12.7%. On average, for every 1% (one percent) increase in Welsh within a typical geography, there is an increase of 0.14% in percentage of males with a disability.
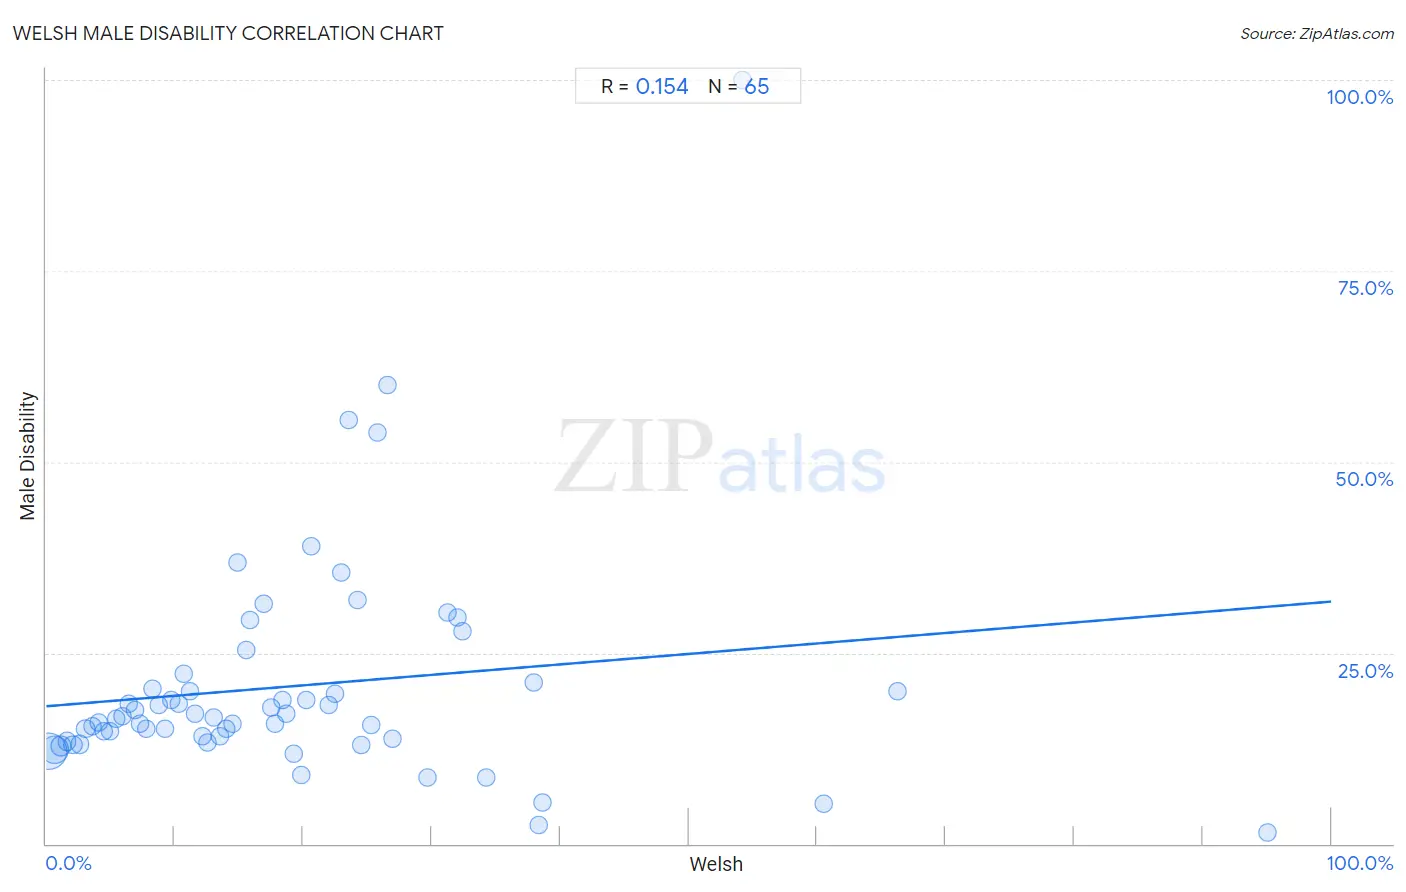
It is essential to understand that the correlation between the percentage of Welsh and percentage of males with a disability does not imply a direct cause-and-effect relationship. It remains uncertain whether the presence of Welsh influences an upward or downward trend in the level of percentage of males with a disability within an area, or if Welsh simply ended up residing in those areas with higher or lower levels of percentage of males with a disability due to other factors.
Demographics Similar to Welsh by Male Disability
In terms of male disability, the demographic groups most similar to Welsh are Spanish (12.7%, a difference of 0.0%), Scottish (12.8%, a difference of 0.050%), Cape Verdean (12.8%, a difference of 0.12%), German (12.7%, a difference of 0.27%), and Irish (12.7%, a difference of 0.28%).
| Demographics | Rating | Rank | Male Disability |
| Central American Indians | 0.0 /100 | #278 | Tragic 12.7% |
| Slovaks | 0.0 /100 | #279 | Tragic 12.7% |
| Dutch | 0.0 /100 | #280 | Tragic 12.7% |
| Sioux | 0.0 /100 | #281 | Tragic 12.7% |
| Irish | 0.0 /100 | #282 | Tragic 12.7% |
| Germans | 0.0 /100 | #283 | Tragic 12.7% |
| Spanish | 0.0 /100 | #284 | Tragic 12.7% |
| Welsh | 0.0 /100 | #285 | Tragic 12.7% |
| Scottish | 0.0 /100 | #286 | Tragic 12.8% |
| Cape Verdeans | 0.0 /100 | #287 | Tragic 12.8% |
| Yup'ik | 0.0 /100 | #288 | Tragic 12.8% |
| Immigrants from Cabo Verde | 0.0 /100 | #289 | Tragic 12.8% |
| Pima | 0.0 /100 | #290 | Tragic 12.8% |
| Whites/Caucasians | 0.0 /100 | #291 | Tragic 12.8% |
| English | 0.0 /100 | #292 | Tragic 12.8% |
Welsh Male Disability Correlation Summary
| Measurement | Welsh Data | Male Disability Data |
| Minimum | 0.24% | 1.4% |
| Maximum | 95.0% | 100.0% |
| Range | 94.8% | 98.6% |
| Mean | 19.0% | 20.6% |
| Median | 15.5% | 16.6% |
| Interquartile 25% (IQ1) | 7.6% | 13.5% |
| Interquartile 75% (IQ3) | 24.9% | 20.7% |
| Interquartile Range (IQR) | 17.4% | 7.1% |
| Standard Deviation (Sample) | 16.8% | 15.0% |
| Standard Deviation (Population) | 16.7% | 14.8% |
Correlation Details
| Welsh Percentile | Sample Size | Male Disability |
[ 0.0% - 0.5% ] 0.24% | 288,589,324 | 12.2% |
[ 0.5% - 1.0% ] 0.67% | 161,939,274 | 12.4% |
[ 1.0% - 1.5% ] 1.13% | 48,052,521 | 12.8% |
[ 1.5% - 2.0% ] 1.62% | 15,844,899 | 13.4% |
[ 2.0% - 2.5% ] 2.09% | 6,555,450 | 13.0% |
[ 2.5% - 3.0% ] 2.59% | 3,357,591 | 13.0% |
[ 3.0% - 3.5% ] 3.06% | 1,346,362 | 15.0% |
[ 3.5% - 4.0% ] 3.56% | 900,767 | 15.3% |
[ 4.0% - 4.5% ] 4.04% | 445,921 | 16.0% |
[ 4.0% - 4.5% ] 4.49% | 286,063 | 14.7% |
[ 4.5% - 5.0% ] 4.97% | 362,986 | 14.7% |
[ 5.0% - 5.5% ] 5.46% | 206,154 | 16.4% |
[ 5.5% - 6.0% ] 5.92% | 108,915 | 16.7% |
[ 6.0% - 6.5% ] 6.39% | 97,412 | 18.3% |
[ 6.5% - 7.0% ] 6.90% | 69,466 | 17.4% |
[ 7.0% - 7.5% ] 7.32% | 54,650 | 15.8% |
[ 7.5% - 8.0% ] 7.80% | 60,030 | 15.1% |
[ 8.0% - 8.5% ] 8.29% | 20,591 | 20.3% |
[ 8.5% - 9.0% ] 8.75% | 20,262 | 18.1% |
[ 9.0% - 9.5% ] 9.26% | 18,330 | 15.0% |
[ 9.5% - 10.0% ] 9.75% | 20,595 | 18.9% |
[ 10.0% - 10.5% ] 10.27% | 10,324 | 18.3% |
[ 10.5% - 11.0% ] 10.71% | 10,170 | 22.2% |
[ 11.0% - 11.5% ] 11.17% | 5,532 | 20.0% |
[ 11.5% - 12.0% ] 11.62% | 14,339 | 17.0% |
[ 12.0% - 12.5% ] 12.20% | 13,960 | 14.1% |
[ 12.5% - 13.0% ] 12.53% | 3,168 | 13.3% |
[ 12.5% - 13.0% ] 12.99% | 2,201 | 16.6% |
[ 13.0% - 13.5% ] 13.48% | 7,166 | 14.1% |
[ 13.5% - 14.0% ] 14.00% | 5,359 | 15.1% |
[ 14.5% - 15.0% ] 14.54% | 7,902 | 15.7% |
[ 14.5% - 15.0% ] 14.88% | 2,030 | 36.9% |
[ 15.5% - 16.0% ] 15.54% | 3,488 | 25.4% |
[ 15.5% - 16.0% ] 15.85% | 2,751 | 29.4% |
[ 16.5% - 17.0% ] 16.93% | 1,087 | 31.4% |
[ 17.5% - 18.0% ] 17.51% | 1,051 | 17.9% |
[ 17.5% - 18.0% ] 17.83% | 1,593 | 15.7% |
[ 18.0% - 18.5% ] 18.43% | 9,039 | 18.9% |
[ 18.5% - 19.0% ] 18.68% | 91 | 17.0% |
[ 19.0% - 19.5% ] 19.26% | 462 | 11.9% |
[ 19.5% - 20.0% ] 19.81% | 429 | 8.9% |
[ 20.0% - 20.5% ] 20.28% | 143 | 18.8% |
[ 20.5% - 21.0% ] 20.62% | 2,119 | 39.0% |
[ 21.5% - 22.0% ] 21.99% | 1,855 | 18.2% |
[ 22.5% - 23.0% ] 22.52% | 3,033 | 19.6% |
[ 22.5% - 23.0% ] 22.93% | 157 | 35.5% |
[ 23.5% - 24.0% ] 23.53% | 34 | 55.6% |
[ 24.0% - 24.5% ] 24.19% | 62 | 31.9% |
[ 24.5% - 25.0% ] 24.56% | 562 | 12.9% |
[ 25.0% - 25.5% ] 25.33% | 75 | 15.6% |
[ 25.5% - 26.0% ] 25.82% | 182 | 53.8% |
[ 26.5% - 27.0% ] 26.56% | 64 | 60.0% |
[ 26.5% - 27.0% ] 26.94% | 219 | 13.7% |
[ 29.5% - 30.0% ] 29.70% | 202 | 8.6% |
[ 31.0% - 31.5% ] 31.21% | 173 | 30.3% |
[ 32.0% - 32.5% ] 32.05% | 390 | 29.7% |
[ 32.0% - 32.5% ] 32.43% | 37 | 27.8% |
[ 34.0% - 34.5% ] 34.23% | 222 | 8.7% |
[ 37.5% - 38.0% ] 37.93% | 58 | 21.1% |
[ 38.0% - 38.5% ] 38.37% | 86 | 2.5% |
[ 38.5% - 39.0% ] 38.58% | 197 | 5.4% |
[ 54.0% - 54.5% ] 54.17% | 24 | 100.0% |
[ 60.0% - 60.5% ] 60.47% | 43 | 5.3% |
[ 66.0% - 66.5% ] 66.25% | 240 | 20.0% |
[ 95.0% - 95.5% ] 95.00% | 100 | 1.4% |