Menominee Male Disability
COMPARE
Menominee
Select to Compare
Male Disability
Menominee Male Disability
15.0%
DISABILITY | MALES
0.0/ 100
METRIC RATING
337th/ 347
METRIC RANK
Menominee Male Disability Correlation Chart
The statistical analysis conducted on geographies consisting of 45,777,737 people shows a moderate positive correlation between the proportion of Menominee and percentage of males with a disability in the United States with a correlation coefficient (R) of 0.477 and weighted average of 15.0%. On average, for every 1% (one percent) increase in Menominee within a typical geography, there is an increase of 0.17% in percentage of males with a disability.
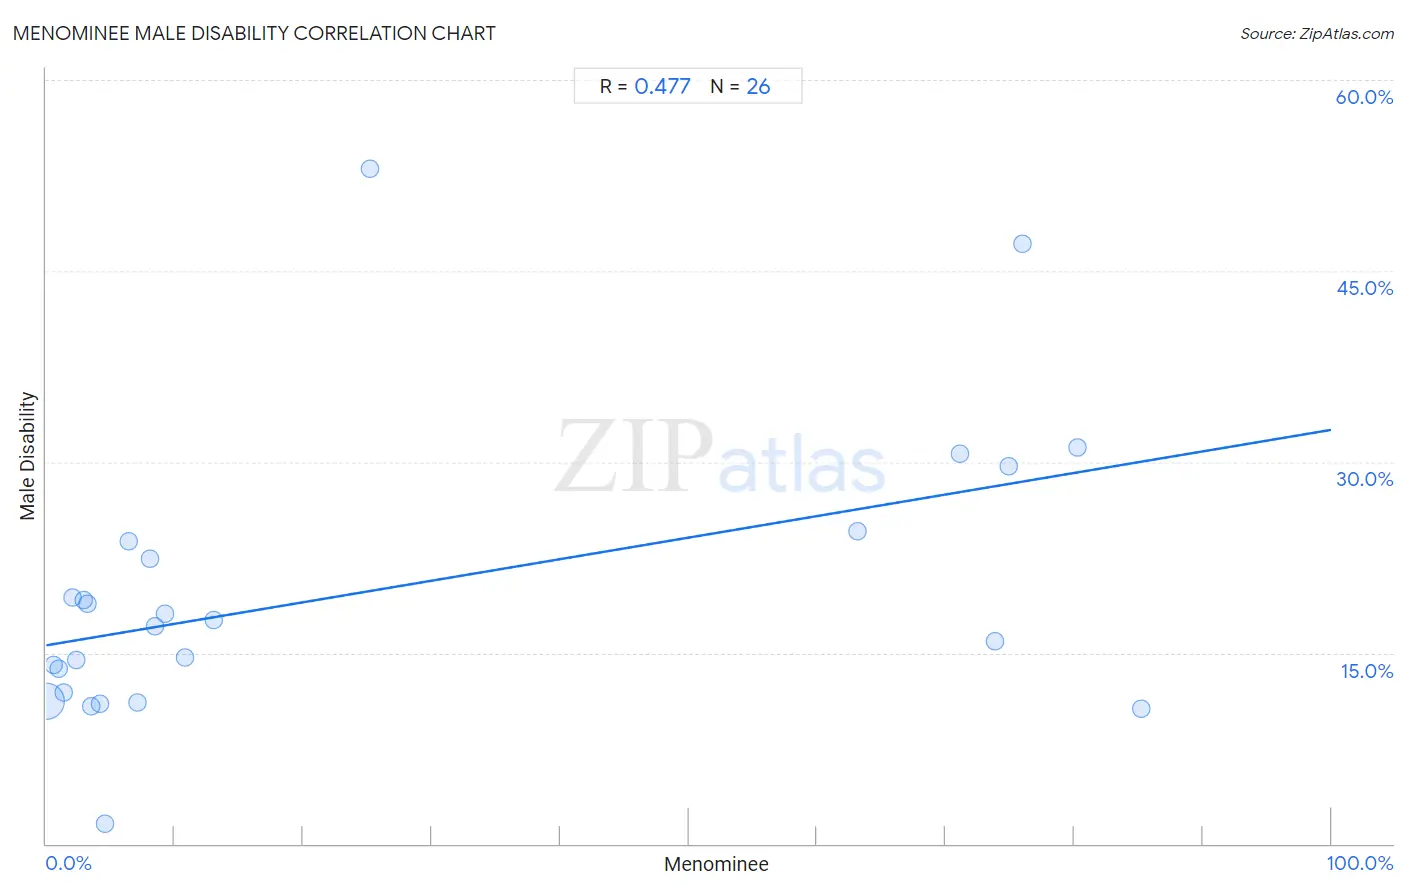
It is essential to understand that the correlation between the percentage of Menominee and percentage of males with a disability does not imply a direct cause-and-effect relationship. It remains uncertain whether the presence of Menominee influences an upward or downward trend in the level of percentage of males with a disability within an area, or if Menominee simply ended up residing in those areas with higher or lower levels of percentage of males with a disability due to other factors.
Demographics Similar to Menominee by Male Disability
In terms of male disability, the demographic groups most similar to Menominee are Pueblo (15.0%, a difference of 0.11%), Alaskan Athabascan (14.9%, a difference of 0.51%), Chickasaw (15.1%, a difference of 0.91%), Dutch West Indian (14.8%, a difference of 0.97%), and Cherokee (14.8%, a difference of 1.0%).
| Demographics | Rating | Rank | Male Disability |
| Navajo | 0.0 /100 | #330 | Tragic 14.4% |
| Tohono O'odham | 0.0 /100 | #331 | Tragic 14.6% |
| Seminole | 0.0 /100 | #332 | Tragic 14.7% |
| Yuman | 0.0 /100 | #333 | Tragic 14.7% |
| Cherokee | 0.0 /100 | #334 | Tragic 14.8% |
| Dutch West Indians | 0.0 /100 | #335 | Tragic 14.8% |
| Alaskan Athabascans | 0.0 /100 | #336 | Tragic 14.9% |
| Menominee | 0.0 /100 | #337 | Tragic 15.0% |
| Pueblo | 0.0 /100 | #338 | Tragic 15.0% |
| Chickasaw | 0.0 /100 | #339 | Tragic 15.1% |
| Lumbee | 0.0 /100 | #340 | Tragic 15.2% |
| Choctaw | 0.0 /100 | #341 | Tragic 15.4% |
| Kiowa | 0.0 /100 | #342 | Tragic 15.4% |
| Creek | 0.0 /100 | #343 | Tragic 15.5% |
| Puerto Ricans | 0.0 /100 | #344 | Tragic 15.6% |
Menominee Male Disability Correlation Summary
| Measurement | Menominee Data | Male Disability Data |
| Minimum | 0.023% | 1.6% |
| Maximum | 85.2% | 53.0% |
| Range | 85.2% | 51.5% |
| Mean | 24.6% | 19.7% |
| Median | 7.6% | 17.4% |
| Interquartile 25% (IQ1) | 2.9% | 11.9% |
| Interquartile 75% (IQ3) | 63.1% | 23.8% |
| Interquartile Range (IQR) | 60.3% | 11.9% |
| Standard Deviation (Sample) | 31.8% | 11.3% |
| Standard Deviation (Population) | 31.1% | 11.1% |
Correlation Details
| Menominee Percentile | Sample Size | Male Disability |
[ 0.0% - 0.5% ] 0.023% | 45,255,288 | 11.2% |
[ 0.5% - 1.0% ] 0.57% | 288,301 | 14.1% |
[ 0.5% - 1.0% ] 1.00% | 151,079 | 13.7% |
[ 1.0% - 1.5% ] 1.39% | 27,371 | 11.9% |
[ 2.0% - 2.5% ] 2.02% | 4,544 | 19.3% |
[ 2.0% - 2.5% ] 2.34% | 1,837 | 14.4% |
[ 2.5% - 3.0% ] 2.89% | 4,365 | 19.2% |
[ 3.0% - 3.5% ] 3.19% | 3,133 | 18.8% |
[ 3.0% - 3.5% ] 3.46% | 2,165 | 10.8% |
[ 4.0% - 4.5% ] 4.22% | 521 | 11.0% |
[ 4.5% - 5.0% ] 4.62% | 130 | 1.6% |
[ 6.0% - 6.5% ] 6.41% | 234 | 23.8% |
[ 7.0% - 7.5% ] 7.08% | 593 | 11.1% |
[ 8.0% - 8.5% ] 8.04% | 1,605 | 22.4% |
[ 8.0% - 8.5% ] 8.48% | 16,657 | 17.1% |
[ 9.0% - 9.5% ] 9.28% | 2,101 | 18.1% |
[ 10.5% - 11.0% ] 10.77% | 297 | 14.6% |
[ 13.0% - 13.5% ] 13.05% | 9,212 | 17.6% |
[ 25.0% - 25.5% ] 25.21% | 119 | 53.0% |
[ 63.0% - 63.5% ] 63.14% | 1,530 | 24.5% |
[ 71.0% - 71.5% ] 71.10% | 173 | 30.7% |
[ 73.5% - 74.0% ] 73.86% | 3,053 | 15.9% |
[ 74.5% - 75.0% ] 74.87% | 1,170 | 29.7% |
[ 76.0% - 76.5% ] 76.00% | 150 | 47.1% |
[ 80.0% - 80.5% ] 80.29% | 685 | 31.1% |
[ 85.0% - 85.5% ] 85.18% | 1,424 | 10.6% |