English Male Disability
COMPARE
English
Select to Compare
Male Disability
English Male Disability
12.8%
DISABILITY | MALES
0.0/ 100
METRIC RATING
292nd/ 347
METRIC RANK
English Male Disability Correlation Chart
The statistical analysis conducted on geographies consisting of 579,503,063 people shows a substantial positive correlation between the proportion of English and percentage of males with a disability in the United States with a correlation coefficient (R) of 0.576 and weighted average of 12.8%. On average, for every 1% (one percent) increase in English within a typical geography, there is an increase of 0.29% in percentage of males with a disability.
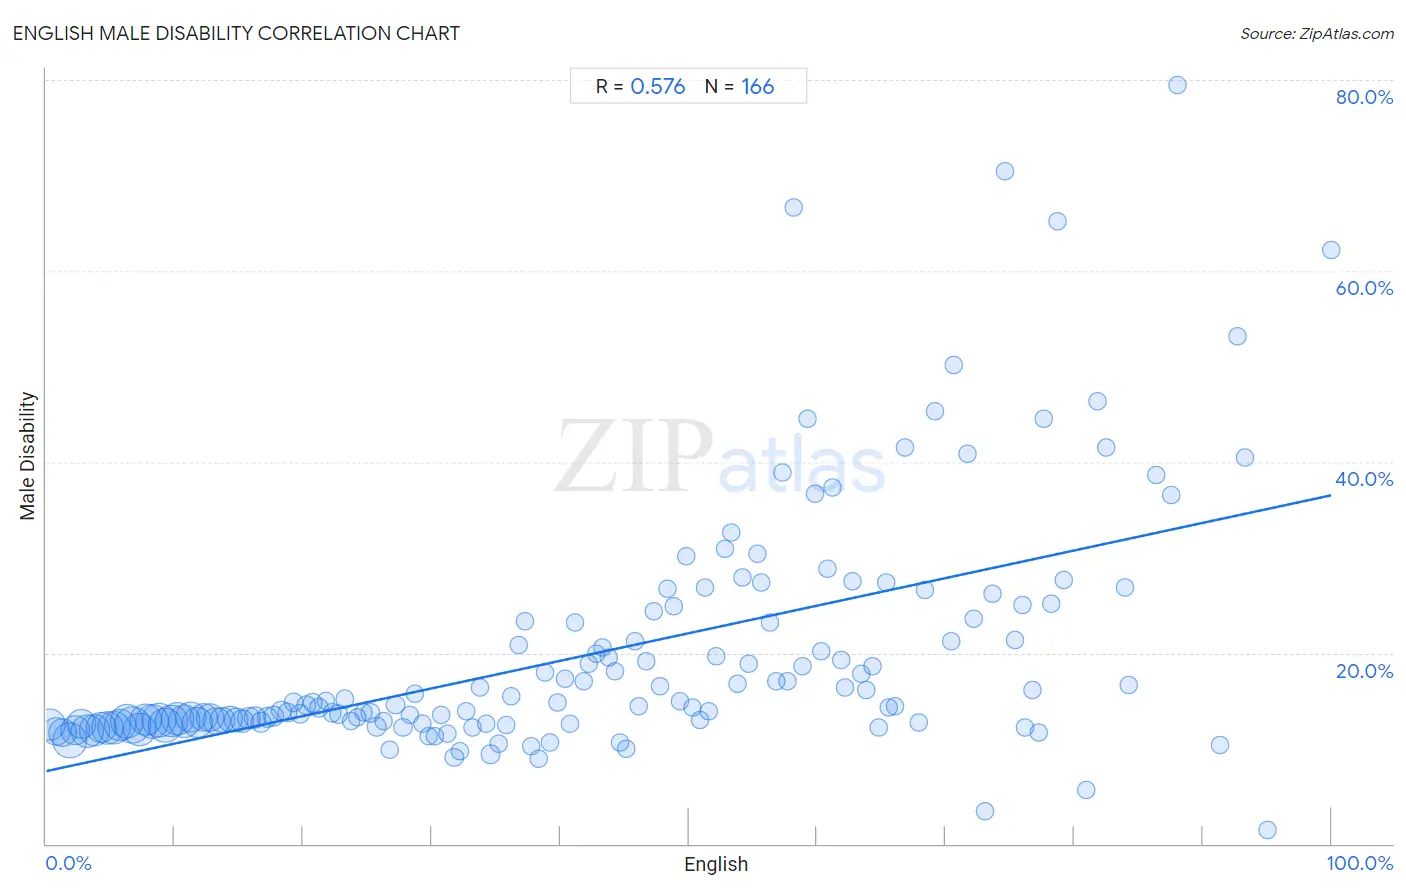
It is essential to understand that the correlation between the percentage of English and percentage of males with a disability does not imply a direct cause-and-effect relationship. It remains uncertain whether the presence of English influences an upward or downward trend in the level of percentage of males with a disability within an area, or if English simply ended up residing in those areas with higher or lower levels of percentage of males with a disability due to other factors.
Demographics Similar to English by Male Disability
In terms of male disability, the demographic groups most similar to English are White/Caucasian (12.8%, a difference of 0.060%), Pima (12.8%, a difference of 0.15%), Yaqui (12.9%, a difference of 0.29%), Immigrants from Cabo Verde (12.8%, a difference of 0.30%), and Yup'ik (12.8%, a difference of 0.49%).
| Demographics | Rating | Rank | Male Disability |
| Welsh | 0.0 /100 | #285 | Tragic 12.7% |
| Scottish | 0.0 /100 | #286 | Tragic 12.8% |
| Cape Verdeans | 0.0 /100 | #287 | Tragic 12.8% |
| Yup'ik | 0.0 /100 | #288 | Tragic 12.8% |
| Immigrants from Cabo Verde | 0.0 /100 | #289 | Tragic 12.8% |
| Pima | 0.0 /100 | #290 | Tragic 12.8% |
| Whites/Caucasians | 0.0 /100 | #291 | Tragic 12.8% |
| English | 0.0 /100 | #292 | Tragic 12.8% |
| Yaqui | 0.0 /100 | #293 | Tragic 12.9% |
| Marshallese | 0.0 /100 | #294 | Tragic 12.9% |
| Immigrants from Micronesia | 0.0 /100 | #295 | Tragic 12.9% |
| Nonimmigrants | 0.0 /100 | #296 | Tragic 12.9% |
| Inupiat | 0.0 /100 | #297 | Tragic 13.0% |
| Pennsylvania Germans | 0.0 /100 | #298 | Tragic 13.0% |
| Celtics | 0.0 /100 | #299 | Tragic 13.0% |
English Male Disability Correlation Summary
| Measurement | English Data | Male Disability Data |
| Minimum | 0.25% | 1.4% |
| Maximum | 100.0% | 79.4% |
| Range | 99.8% | 78.0% |
| Mean | 42.4% | 19.9% |
| Median | 41.5% | 14.4% |
| Interquartile 25% (IQ1) | 20.7% | 12.6% |
| Interquartile 75% (IQ3) | 62.1% | 23.2% |
| Interquartile Range (IQR) | 41.4% | 10.6% |
| Standard Deviation (Sample) | 25.6% | 12.8% |
| Standard Deviation (Population) | 25.5% | 12.8% |
Correlation Details
| English Percentile | Sample Size | Male Disability |
[ 0.0% - 0.5% ] 0.25% | 19,664,376 | 12.5% |
[ 0.5% - 1.0% ] 0.76% | 13,129,182 | 11.8% |
[ 1.0% - 1.5% ] 1.24% | 13,115,708 | 11.7% |
[ 1.5% - 2.0% ] 1.81% | 22,688,438 | 10.8% |
[ 2.0% - 2.5% ] 2.25% | 14,507,709 | 11.9% |
[ 2.5% - 3.0% ] 2.77% | 14,750,207 | 12.5% |
[ 3.0% - 3.5% ] 3.23% | 20,587,010 | 11.8% |
[ 3.5% - 4.0% ] 3.75% | 17,978,306 | 11.9% |
[ 4.0% - 4.5% ] 4.25% | 17,021,716 | 12.2% |
[ 4.5% - 5.0% ] 4.72% | 19,068,274 | 12.1% |
[ 5.0% - 5.5% ] 5.25% | 19,680,494 | 12.2% |
[ 5.5% - 6.0% ] 5.75% | 18,527,817 | 12.4% |
[ 6.0% - 6.5% ] 6.28% | 21,772,943 | 12.8% |
[ 6.5% - 7.0% ] 6.75% | 25,272,907 | 12.4% |
[ 7.0% - 7.5% ] 7.26% | 21,534,244 | 12.0% |
[ 7.5% - 8.0% ] 7.74% | 19,402,634 | 13.0% |
[ 8.0% - 8.5% ] 8.25% | 21,245,279 | 12.8% |
[ 8.5% - 9.0% ] 8.74% | 21,412,091 | 12.9% |
[ 9.0% - 9.5% ] 9.26% | 21,078,175 | 12.4% |
[ 9.5% - 10.0% ] 9.75% | 19,444,374 | 12.9% |
[ 10.0% - 10.5% ] 10.24% | 20,008,379 | 13.1% |
[ 10.5% - 11.0% ] 10.75% | 20,174,639 | 12.8% |
[ 11.0% - 11.5% ] 11.24% | 17,833,540 | 13.3% |
[ 11.5% - 12.0% ] 11.74% | 17,036,592 | 12.7% |
[ 12.0% - 12.5% ] 12.25% | 13,872,626 | 13.2% |
[ 12.5% - 13.0% ] 12.75% | 13,318,102 | 13.2% |
[ 13.0% - 13.5% ] 13.25% | 12,566,052 | 12.8% |
[ 13.5% - 14.0% ] 13.74% | 10,350,816 | 13.0% |
[ 14.0% - 14.5% ] 14.26% | 10,068,214 | 13.1% |
[ 14.5% - 15.0% ] 14.74% | 8,608,190 | 12.9% |
[ 15.0% - 15.5% ] 15.24% | 7,238,275 | 12.8% |
[ 15.5% - 16.0% ] 15.74% | 6,356,273 | 13.2% |
[ 16.0% - 16.5% ] 16.26% | 5,084,642 | 13.2% |
[ 16.5% - 17.0% ] 16.74% | 3,973,549 | 12.8% |
[ 17.0% - 17.5% ] 17.25% | 3,703,411 | 13.2% |
[ 17.5% - 18.0% ] 17.74% | 3,602,703 | 13.4% |
[ 18.0% - 18.5% ] 18.28% | 3,048,596 | 13.9% |
[ 18.5% - 19.0% ] 18.73% | 1,741,477 | 13.7% |
[ 19.0% - 19.5% ] 19.24% | 2,043,397 | 14.8% |
[ 19.5% - 20.0% ] 19.74% | 1,677,421 | 13.6% |
[ 20.0% - 20.5% ] 20.24% | 1,496,518 | 14.5% |
[ 20.5% - 21.0% ] 20.74% | 1,005,295 | 14.8% |
[ 21.0% - 21.5% ] 21.23% | 1,124,706 | 14.3% |
[ 21.5% - 22.0% ] 21.75% | 807,408 | 15.0% |
[ 22.0% - 22.5% ] 22.24% | 985,272 | 13.7% |
[ 22.5% - 23.0% ] 22.76% | 780,546 | 13.6% |
[ 23.0% - 23.5% ] 23.22% | 513,516 | 15.1% |
[ 23.5% - 24.0% ] 23.74% | 552,839 | 12.9% |
[ 24.0% - 24.5% ] 24.22% | 673,121 | 13.2% |
[ 24.5% - 25.0% ] 24.70% | 533,596 | 13.7% |
[ 25.0% - 25.5% ] 25.23% | 586,965 | 13.7% |
[ 25.5% - 26.0% ] 25.73% | 514,895 | 12.3% |
[ 26.0% - 26.5% ] 26.23% | 462,805 | 12.8% |
[ 26.5% - 27.0% ] 26.74% | 661,939 | 9.8% |
[ 27.0% - 27.5% ] 27.18% | 313,315 | 14.6% |
[ 27.5% - 28.0% ] 27.77% | 379,306 | 12.2% |
[ 28.0% - 28.5% ] 28.31% | 322,460 | 13.5% |
[ 28.5% - 29.0% ] 28.71% | 210,224 | 15.7% |
[ 29.0% - 29.5% ] 29.25% | 375,470 | 12.6% |
[ 29.5% - 30.0% ] 29.74% | 256,145 | 11.2% |
[ 30.0% - 30.5% ] 30.26% | 134,620 | 11.3% |
[ 30.5% - 31.0% ] 30.73% | 265,816 | 13.5% |
[ 31.0% - 31.5% ] 31.22% | 262,491 | 11.5% |
[ 31.5% - 32.0% ] 31.75% | 331,702 | 9.1% |
[ 32.0% - 32.5% ] 32.18% | 183,351 | 9.6% |
[ 32.5% - 33.0% ] 32.72% | 126,084 | 13.8% |
[ 33.0% - 33.5% ] 33.19% | 92,633 | 12.2% |
[ 33.5% - 34.0% ] 33.79% | 48,368 | 16.3% |
[ 34.0% - 34.5% ] 34.22% | 83,869 | 12.6% |
[ 34.5% - 35.0% ] 34.57% | 262,749 | 9.4% |
[ 35.0% - 35.5% ] 35.19% | 123,629 | 10.4% |
[ 35.5% - 36.0% ] 35.83% | 150,909 | 12.4% |
[ 36.0% - 36.5% ] 36.15% | 48,991 | 15.4% |
[ 36.5% - 37.0% ] 36.73% | 22,004 | 20.8% |
[ 37.0% - 37.5% ] 37.24% | 16,478 | 23.3% |
[ 37.5% - 38.0% ] 37.74% | 115,067 | 10.2% |
[ 38.0% - 38.5% ] 38.34% | 111,081 | 8.9% |
[ 38.5% - 39.0% ] 38.76% | 24,321 | 17.9% |
[ 39.0% - 39.5% ] 39.18% | 19,890 | 10.6% |
[ 39.5% - 40.0% ] 39.77% | 19,802 | 14.8% |
[ 40.0% - 40.5% ] 40.35% | 19,667 | 17.3% |
[ 40.5% - 41.0% ] 40.72% | 30,318 | 12.5% |
[ 41.0% - 41.5% ] 41.16% | 9,979 | 23.2% |
[ 41.5% - 42.0% ] 41.79% | 12,819 | 17.0% |
[ 42.0% - 42.5% ] 42.24% | 24,591 | 18.9% |
[ 42.5% - 43.0% ] 42.80% | 11,460 | 19.9% |
[ 43.0% - 43.5% ] 43.25% | 10,138 | 20.6% |
[ 43.5% - 44.0% ] 43.74% | 9,809 | 19.5% |
[ 44.0% - 44.5% ] 44.25% | 4,976 | 18.1% |
[ 44.5% - 45.0% ] 44.67% | 16,459 | 10.6% |
[ 45.0% - 45.5% ] 45.14% | 28,972 | 9.9% |
[ 45.5% - 46.0% ] 45.77% | 12,169 | 21.2% |
[ 46.0% - 46.5% ] 46.15% | 11,704 | 14.5% |
[ 46.5% - 47.0% ] 46.70% | 6,989 | 19.1% |
[ 47.0% - 47.5% ] 47.31% | 7,293 | 24.3% |
[ 47.5% - 48.0% ] 47.76% | 4,977 | 16.5% |
[ 48.0% - 48.5% ] 48.31% | 3,500 | 26.7% |
[ 48.5% - 49.0% ] 48.83% | 2,783 | 24.8% |
[ 49.0% - 49.5% ] 49.28% | 3,549 | 15.0% |
[ 49.5% - 50.0% ] 49.84% | 4,486 | 30.1% |
[ 50.0% - 50.5% ] 50.32% | 5,356 | 14.3% |
[ 50.5% - 51.0% ] 50.83% | 6,828 | 13.0% |
[ 51.0% - 51.5% ] 51.24% | 1,573 | 26.8% |
[ 51.5% - 52.0% ] 51.58% | 1,863 | 13.8% |
[ 52.0% - 52.5% ] 52.15% | 2,284 | 19.6% |
[ 52.5% - 53.0% ] 52.83% | 2,752 | 30.9% |
[ 53.0% - 53.5% ] 53.33% | 885 | 32.5% |
[ 53.5% - 54.0% ] 53.78% | 4,241 | 16.7% |
[ 54.0% - 54.5% ] 54.20% | 1,679 | 27.9% |
[ 54.5% - 55.0% ] 54.63% | 1,717 | 18.8% |
[ 55.0% - 55.5% ] 55.36% | 1,185 | 30.4% |
[ 55.5% - 56.0% ] 55.63% | 3,162 | 27.4% |
[ 56.0% - 56.5% ] 56.32% | 3,457 | 23.2% |
[ 56.5% - 57.0% ] 56.85% | 628 | 17.0% |
[ 57.0% - 57.5% ] 57.33% | 450 | 38.8% |
[ 57.5% - 58.0% ] 57.64% | 1,086 | 17.0% |
[ 58.0% - 58.5% ] 58.14% | 215 | 66.6% |
[ 58.5% - 59.0% ] 58.86% | 1,760 | 18.6% |
[ 59.0% - 59.5% ] 59.25% | 957 | 44.5% |
[ 59.5% - 60.0% ] 59.80% | 2,445 | 36.6% |
[ 60.0% - 60.5% ] 60.35% | 2,313 | 20.2% |
[ 60.5% - 61.0% ] 60.76% | 609 | 28.8% |
[ 61.0% - 61.5% ] 61.21% | 428 | 37.3% |
[ 61.5% - 62.0% ] 61.89% | 1,425 | 19.3% |
[ 62.0% - 62.5% ] 62.13% | 1,875 | 16.3% |
[ 62.5% - 63.0% ] 62.72% | 1,183 | 27.5% |
[ 63.0% - 63.5% ] 63.43% | 1,124 | 17.8% |
[ 63.5% - 64.0% ] 63.84% | 1,095 | 16.1% |
[ 64.0% - 64.5% ] 64.30% | 1,154 | 18.6% |
[ 64.5% - 65.0% ] 64.81% | 935 | 12.2% |
[ 65.0% - 65.5% ] 65.38% | 1,499 | 27.4% |
[ 65.5% - 66.0% ] 65.59% | 93 | 14.3% |
[ 66.0% - 66.5% ] 66.03% | 209 | 14.4% |
[ 66.5% - 67.0% ] 66.79% | 1,039 | 41.5% |
[ 67.5% - 68.0% ] 67.90% | 324 | 12.6% |
[ 68.0% - 68.5% ] 68.37% | 901 | 26.5% |
[ 69.0% - 69.5% ] 69.17% | 120 | 45.3% |
[ 70.0% - 70.5% ] 70.39% | 206 | 21.1% |
[ 70.5% - 71.0% ] 70.62% | 960 | 50.2% |
[ 71.5% - 72.0% ] 71.65% | 822 | 40.9% |
[ 72.0% - 72.5% ] 72.19% | 2,661 | 23.5% |
[ 73.0% - 73.5% ] 73.06% | 438 | 3.5% |
[ 73.5% - 74.0% ] 73.62% | 1,088 | 26.1% |
[ 74.5% - 75.0% ] 74.64% | 761 | 70.4% |
[ 75.0% - 75.5% ] 75.40% | 2,049 | 21.4% |
[ 75.5% - 76.0% ] 75.93% | 54 | 25.0% |
[ 76.0% - 76.5% ] 76.19% | 378 | 12.1% |
[ 76.5% - 77.0% ] 76.73% | 666 | 16.1% |
[ 77.0% - 77.5% ] 77.28% | 735 | 11.6% |
[ 77.5% - 78.0% ] 77.66% | 385 | 44.5% |
[ 78.0% - 78.5% ] 78.25% | 492 | 25.2% |
[ 78.5% - 79.0% ] 78.67% | 211 | 65.2% |
[ 79.0% - 79.5% ] 79.20% | 274 | 27.6% |
[ 80.5% - 81.0% ] 80.95% | 126 | 5.6% |
[ 81.5% - 82.0% ] 81.82% | 154 | 46.3% |
[ 82.0% - 82.5% ] 82.46% | 342 | 41.6% |
[ 83.5% - 84.0% ] 83.90% | 410 | 26.9% |
[ 84.0% - 84.5% ] 84.29% | 140 | 16.7% |
[ 86.0% - 86.5% ] 86.38% | 602 | 38.7% |
[ 87.0% - 87.5% ] 87.50% | 128 | 36.6% |
[ 88.0% - 88.5% ] 88.00% | 50 | 79.4% |
[ 91.0% - 91.5% ] 91.33% | 173 | 10.3% |
[ 92.5% - 93.0% ] 92.73% | 385 | 53.2% |
[ 93.0% - 93.5% ] 93.24% | 148 | 40.4% |
[ 95.0% - 95.5% ] 95.00% | 100 | 1.4% |
[ 99.5% - 100.0% ] 100.00% | 1,664 | 62.1% |