Pima vs Aleut Male Disability
COMPARE
Pima
Aleut
Male Disability
Male Disability Comparison
Pima
Aleuts
12.8%
MALE DISABILITY
0.0/ 100
METRIC RATING
290th/ 347
METRIC RANK
13.5%
MALE DISABILITY
0.0/ 100
METRIC RATING
314th/ 347
METRIC RANK
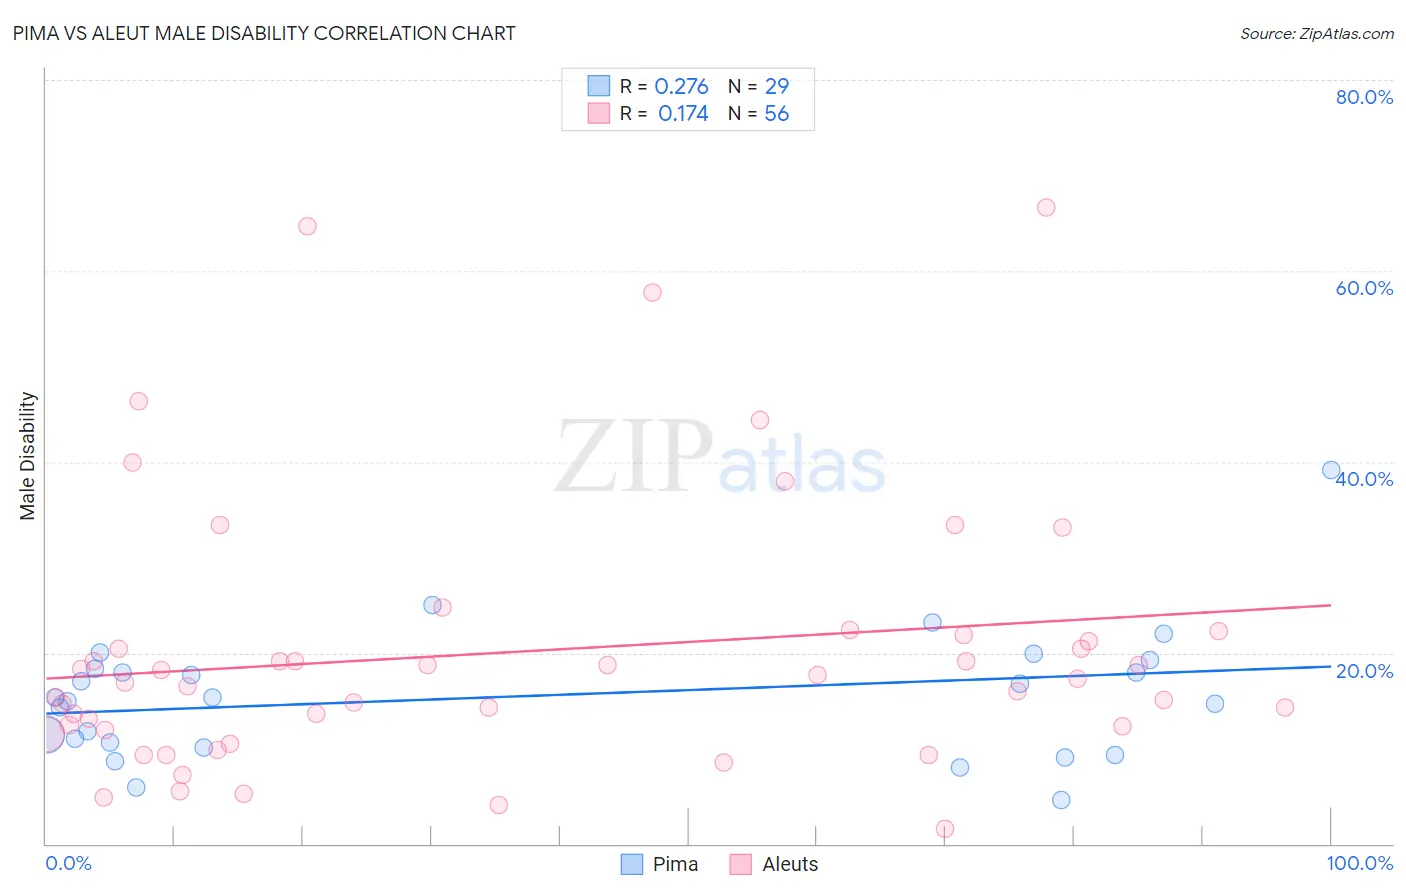
Pima vs Aleut Male Disability Correlation Chart
The statistical analysis conducted on geographies consisting of 61,540,793 people shows a weak positive correlation between the proportion of Pima and percentage of males with a disability in the United States with a correlation coefficient (R) of 0.276 and weighted average of 12.8%. Similarly, the statistical analysis conducted on geographies consisting of 61,781,490 people shows a poor positive correlation between the proportion of Aleuts and percentage of males with a disability in the United States with a correlation coefficient (R) of 0.174 and weighted average of 13.5%, a difference of 5.6%.
Male Disability Correlation Summary
| Measurement | Pima | Aleut |
| Minimum | 4.5% | 1.6% |
| Maximum | 39.1% | 66.7% |
| Range | 34.6% | 65.1% |
| Mean | 15.5% | 20.1% |
| Median | 15.3% | 17.1% |
| Interquartile 25% (IQ1) | 10.3% | 12.2% |
| Interquartile 75% (IQ3) | 18.8% | 21.5% |
| Interquartile Range (IQR) | 8.5% | 9.4% |
| Standard Deviation (Sample) | 6.9% | 14.1% |
| Standard Deviation (Population) | 6.8% | 13.9% |
Similar Demographics by Male Disability
Demographics Similar to Pima by Male Disability
In terms of male disability, the demographic groups most similar to Pima are White/Caucasian (12.8%, a difference of 0.090%), Immigrants from Cabo Verde (12.8%, a difference of 0.15%), English (12.8%, a difference of 0.15%), Yup'ik (12.8%, a difference of 0.34%), and Yaqui (12.9%, a difference of 0.44%).
| Demographics | Rating | Rank | Male Disability |
| Germans | 0.0 /100 | #283 | Tragic 12.7% |
| Spanish | 0.0 /100 | #284 | Tragic 12.7% |
| Welsh | 0.0 /100 | #285 | Tragic 12.7% |
| Scottish | 0.0 /100 | #286 | Tragic 12.8% |
| Cape Verdeans | 0.0 /100 | #287 | Tragic 12.8% |
| Yup'ik | 0.0 /100 | #288 | Tragic 12.8% |
| Immigrants | Cabo Verde | 0.0 /100 | #289 | Tragic 12.8% |
| Pima | 0.0 /100 | #290 | Tragic 12.8% |
| Whites/Caucasians | 0.0 /100 | #291 | Tragic 12.8% |
| English | 0.0 /100 | #292 | Tragic 12.8% |
| Yaqui | 0.0 /100 | #293 | Tragic 12.9% |
| Marshallese | 0.0 /100 | #294 | Tragic 12.9% |
| Immigrants | Micronesia | 0.0 /100 | #295 | Tragic 12.9% |
| Immigrants | Nonimmigrants | 0.0 /100 | #296 | Tragic 12.9% |
| Inupiat | 0.0 /100 | #297 | Tragic 13.0% |
Demographics Similar to Aleuts by Male Disability
In terms of male disability, the demographic groups most similar to Aleuts are Puget Sound Salish (13.5%, a difference of 0.060%), Yakama (13.5%, a difference of 0.080%), Iroquois (13.6%, a difference of 0.16%), Alaska Native (13.6%, a difference of 0.21%), and Delaware (13.5%, a difference of 0.63%).
| Demographics | Rating | Rank | Male Disability |
| Arapaho | 0.0 /100 | #307 | Tragic 13.3% |
| French American Indians | 0.0 /100 | #308 | Tragic 13.4% |
| Blackfeet | 0.0 /100 | #309 | Tragic 13.4% |
| Immigrants | Azores | 0.0 /100 | #310 | Tragic 13.4% |
| Delaware | 0.0 /100 | #311 | Tragic 13.5% |
| Yakama | 0.0 /100 | #312 | Tragic 13.5% |
| Puget Sound Salish | 0.0 /100 | #313 | Tragic 13.5% |
| Aleuts | 0.0 /100 | #314 | Tragic 13.5% |
| Iroquois | 0.0 /100 | #315 | Tragic 13.6% |
| Alaska Natives | 0.0 /100 | #316 | Tragic 13.6% |
| Paiute | 0.0 /100 | #317 | Tragic 13.7% |
| Cree | 0.0 /100 | #318 | Tragic 13.7% |
| Americans | 0.0 /100 | #319 | Tragic 13.8% |
| Tlingit-Haida | 0.0 /100 | #320 | Tragic 13.8% |
| Shoshone | 0.0 /100 | #321 | Tragic 13.8% |