Pima vs Immigrants from Czechoslovakia Male Disability
COMPARE
Pima
Immigrants from Czechoslovakia
Male Disability
Male Disability Comparison
Pima
Immigrants from Czechoslovakia
12.8%
MALE DISABILITY
0.0/ 100
METRIC RATING
290th/ 347
METRIC RANK
10.9%
MALE DISABILITY
88.4/ 100
METRIC RATING
123rd/ 347
METRIC RANK
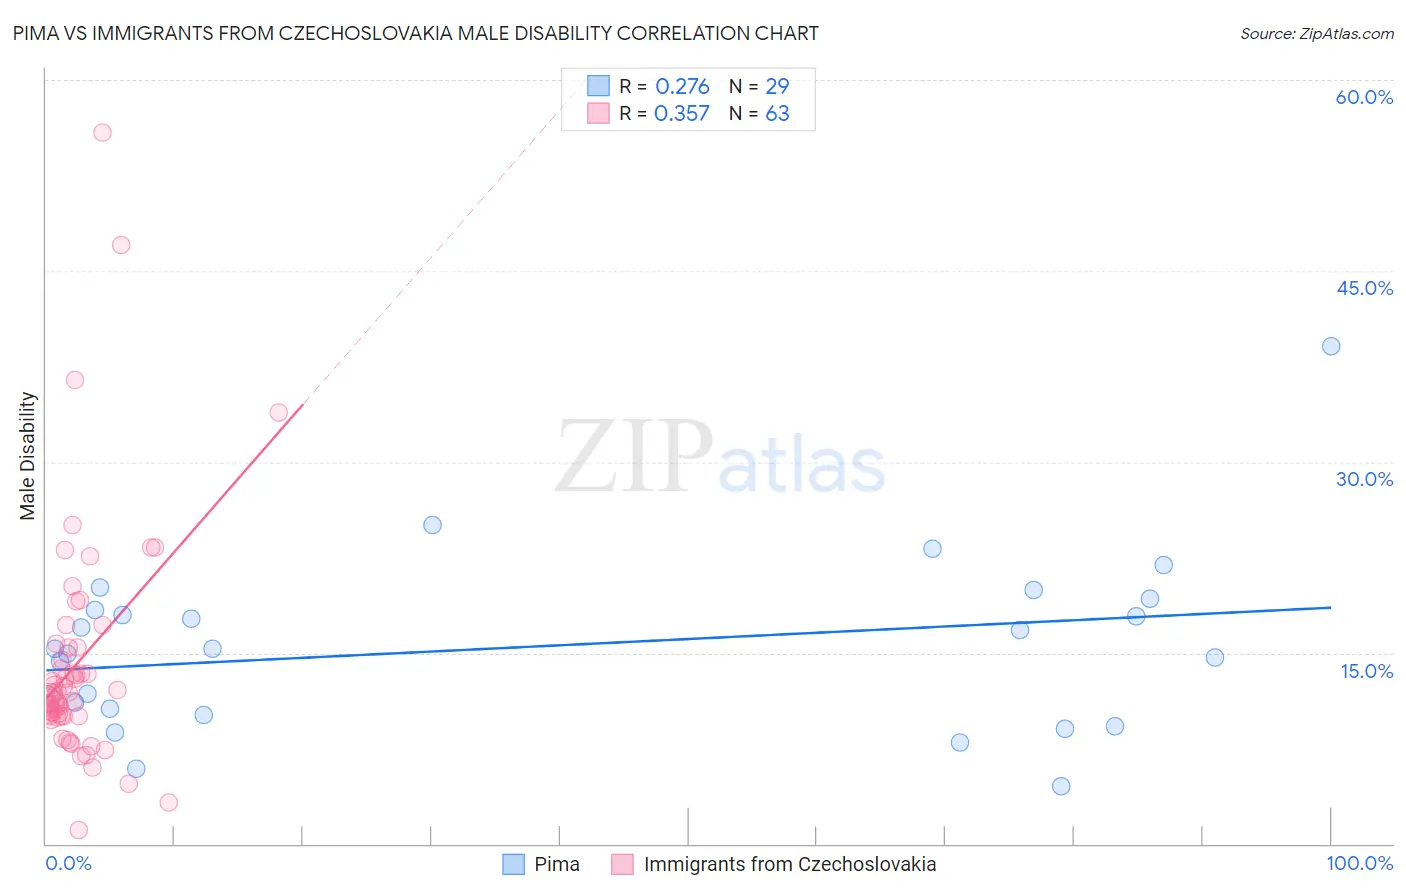
Pima vs Immigrants from Czechoslovakia Male Disability Correlation Chart
The statistical analysis conducted on geographies consisting of 61,540,793 people shows a weak positive correlation between the proportion of Pima and percentage of males with a disability in the United States with a correlation coefficient (R) of 0.276 and weighted average of 12.8%. Similarly, the statistical analysis conducted on geographies consisting of 195,455,879 people shows a mild positive correlation between the proportion of Immigrants from Czechoslovakia and percentage of males with a disability in the United States with a correlation coefficient (R) of 0.357 and weighted average of 10.9%, a difference of 17.7%.
Male Disability Correlation Summary
| Measurement | Pima | Immigrants from Czechoslovakia |
| Minimum | 4.5% | 1.1% |
| Maximum | 39.1% | 55.9% |
| Range | 34.6% | 54.9% |
| Mean | 15.5% | 14.3% |
| Median | 15.3% | 11.9% |
| Interquartile 25% (IQ1) | 10.3% | 10.0% |
| Interquartile 75% (IQ3) | 18.8% | 15.5% |
| Interquartile Range (IQR) | 8.5% | 5.4% |
| Standard Deviation (Sample) | 6.9% | 9.3% |
| Standard Deviation (Population) | 6.8% | 9.2% |
Similar Demographics by Male Disability
Demographics Similar to Pima by Male Disability
In terms of male disability, the demographic groups most similar to Pima are White/Caucasian (12.8%, a difference of 0.090%), Immigrants from Cabo Verde (12.8%, a difference of 0.15%), English (12.8%, a difference of 0.15%), Yup'ik (12.8%, a difference of 0.34%), and Yaqui (12.9%, a difference of 0.44%).
| Demographics | Rating | Rank | Male Disability |
| Germans | 0.0 /100 | #283 | Tragic 12.7% |
| Spanish | 0.0 /100 | #284 | Tragic 12.7% |
| Welsh | 0.0 /100 | #285 | Tragic 12.7% |
| Scottish | 0.0 /100 | #286 | Tragic 12.8% |
| Cape Verdeans | 0.0 /100 | #287 | Tragic 12.8% |
| Yup'ik | 0.0 /100 | #288 | Tragic 12.8% |
| Immigrants | Cabo Verde | 0.0 /100 | #289 | Tragic 12.8% |
| Pima | 0.0 /100 | #290 | Tragic 12.8% |
| Whites/Caucasians | 0.0 /100 | #291 | Tragic 12.8% |
| English | 0.0 /100 | #292 | Tragic 12.8% |
| Yaqui | 0.0 /100 | #293 | Tragic 12.9% |
| Marshallese | 0.0 /100 | #294 | Tragic 12.9% |
| Immigrants | Micronesia | 0.0 /100 | #295 | Tragic 12.9% |
| Immigrants | Nonimmigrants | 0.0 /100 | #296 | Tragic 12.9% |
| Inupiat | 0.0 /100 | #297 | Tragic 13.0% |
Demographics Similar to Immigrants from Czechoslovakia by Male Disability
In terms of male disability, the demographic groups most similar to Immigrants from Czechoslovakia are South American Indian (10.9%, a difference of 0.040%), Immigrants from North Macedonia (10.9%, a difference of 0.040%), Immigrants from Ghana (10.9%, a difference of 0.090%), Immigrants from South Eastern Asia (10.9%, a difference of 0.11%), and Immigrants from Africa (10.9%, a difference of 0.15%).
| Demographics | Rating | Rank | Male Disability |
| Immigrants | South Africa | 91.8 /100 | #116 | Exceptional 10.8% |
| Eastern Europeans | 90.6 /100 | #117 | Exceptional 10.9% |
| Immigrants | Cuba | 90.2 /100 | #118 | Exceptional 10.9% |
| Armenians | 90.1 /100 | #119 | Exceptional 10.9% |
| Immigrants | Africa | 89.4 /100 | #120 | Excellent 10.9% |
| Immigrants | South Eastern Asia | 89.2 /100 | #121 | Excellent 10.9% |
| Immigrants | Ghana | 89.0 /100 | #122 | Excellent 10.9% |
| Immigrants | Czechoslovakia | 88.4 /100 | #123 | Excellent 10.9% |
| South American Indians | 88.1 /100 | #124 | Excellent 10.9% |
| Immigrants | North Macedonia | 88.1 /100 | #125 | Excellent 10.9% |
| Immigrants | Trinidad and Tobago | 86.9 /100 | #126 | Excellent 10.9% |
| Immigrants | Ukraine | 86.8 /100 | #127 | Excellent 10.9% |
| Immigrants | Latvia | 85.5 /100 | #128 | Excellent 10.9% |
| Immigrants | Philippines | 85.4 /100 | #129 | Excellent 10.9% |
| Brazilians | 85.4 /100 | #130 | Excellent 10.9% |