Marshallese Male Disability
COMPARE
Marshallese
Select to Compare
Male Disability
Marshallese Male Disability
12.9%
DISABILITY | MALES
0.0/ 100
METRIC RATING
294th/ 347
METRIC RANK
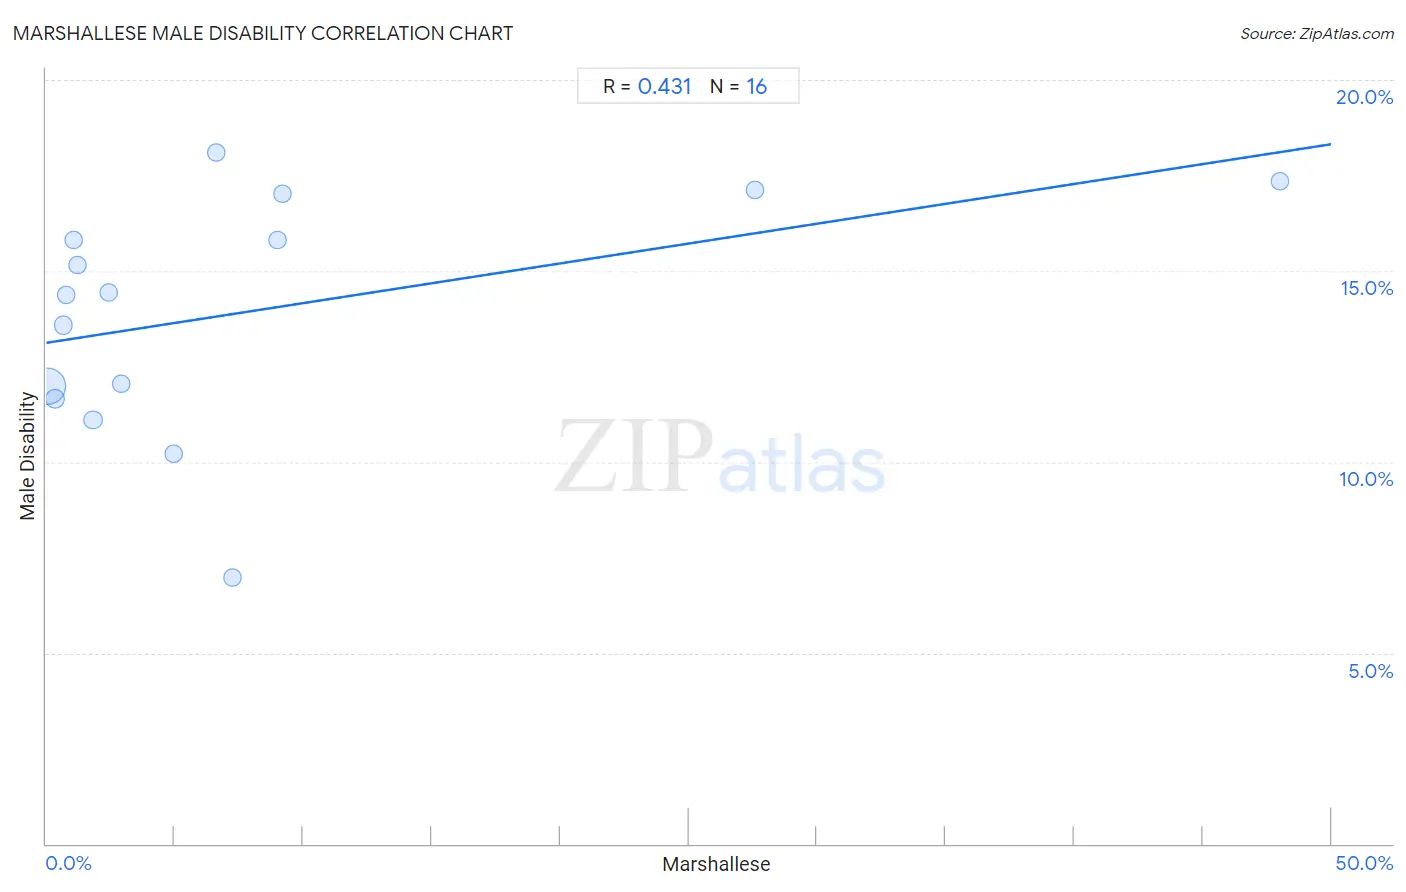
Marshallese Male Disability Correlation Chart
The statistical analysis conducted on geographies consisting of 14,761,315 people shows a moderate positive correlation between the proportion of Marshallese and percentage of males with a disability in the United States with a correlation coefficient (R) of 0.431 and weighted average of 12.9%. On average, for every 1% (one percent) increase in Marshallese within a typical geography, there is an increase of 0.10% in percentage of males with a disability.
It is essential to understand that the correlation between the percentage of Marshallese and percentage of males with a disability does not imply a direct cause-and-effect relationship. It remains uncertain whether the presence of Marshallese influences an upward or downward trend in the level of percentage of males with a disability within an area, or if Marshallese simply ended up residing in those areas with higher or lower levels of percentage of males with a disability due to other factors.
Demographics Similar to Marshallese by Male Disability
In terms of male disability, the demographic groups most similar to Marshallese are Immigrants from Micronesia (12.9%, a difference of 0.10%), Nonimmigrants (12.9%, a difference of 0.16%), Yaqui (12.9%, a difference of 0.24%), Inupiat (13.0%, a difference of 0.27%), and Pennsylvania German (13.0%, a difference of 0.47%).
| Demographics | Rating | Rank | Male Disability |
| Cape Verdeans | 0.0 /100 | #287 | Tragic 12.8% |
| Yup'ik | 0.0 /100 | #288 | Tragic 12.8% |
| Immigrants from Cabo Verde | 0.0 /100 | #289 | Tragic 12.8% |
| Pima | 0.0 /100 | #290 | Tragic 12.8% |
| Whites/Caucasians | 0.0 /100 | #291 | Tragic 12.8% |
| English | 0.0 /100 | #292 | Tragic 12.8% |
| Yaqui | 0.0 /100 | #293 | Tragic 12.9% |
| Marshallese | 0.0 /100 | #294 | Tragic 12.9% |
| Immigrants from Micronesia | 0.0 /100 | #295 | Tragic 12.9% |
| Nonimmigrants | 0.0 /100 | #296 | Tragic 12.9% |
| Inupiat | 0.0 /100 | #297 | Tragic 13.0% |
| Pennsylvania Germans | 0.0 /100 | #298 | Tragic 13.0% |
| Celtics | 0.0 /100 | #299 | Tragic 13.0% |
| Cheyenne | 0.0 /100 | #300 | Tragic 13.0% |
| French | 0.0 /100 | #301 | Tragic 13.0% |
Marshallese Male Disability Correlation Summary
| Measurement | Marshallese Data | Male Disability Data |
| Minimum | 0.037% | 7.0% |
| Maximum | 48.0% | 18.1% |
| Range | 48.0% | 11.1% |
| Mean | 7.7% | 13.9% |
| Median | 2.7% | 14.4% |
| Interquartile 25% (IQ1) | 0.94% | 11.8% |
| Interquartile 75% (IQ3) | 8.1% | 16.4% |
| Interquartile Range (IQR) | 7.2% | 4.6% |
| Standard Deviation (Sample) | 12.7% | 3.1% |
| Standard Deviation (Population) | 12.3% | 3.0% |
Correlation Details
| Marshallese Percentile | Sample Size | Male Disability |
[ 0.0% - 0.5% ] 0.037% | 12,928,307 | 12.0% |
[ 0.0% - 0.5% ] 0.34% | 859,705 | 11.6% |
[ 0.5% - 1.0% ] 0.66% | 591,328 | 13.6% |
[ 0.5% - 1.0% ] 0.79% | 133,430 | 14.4% |
[ 1.0% - 1.5% ] 1.08% | 112,589 | 15.8% |
[ 1.0% - 1.5% ] 1.23% | 2,853 | 15.2% |
[ 1.5% - 2.0% ] 1.82% | 104,259 | 11.1% |
[ 2.0% - 2.5% ] 2.45% | 13,749 | 14.4% |
[ 2.5% - 3.0% ] 2.89% | 2,971 | 12.1% |
[ 4.5% - 5.0% ] 4.94% | 324 | 10.2% |
[ 6.5% - 7.0% ] 6.61% | 4,827 | 18.1% |
[ 7.0% - 7.5% ] 7.25% | 1,932 | 7.0% |
[ 8.5% - 9.0% ] 8.98% | 3,754 | 15.8% |
[ 9.0% - 9.5% ] 9.18% | 196 | 17.0% |
[ 27.5% - 28.0% ] 27.56% | 693 | 17.1% |
[ 47.5% - 48.0% ] 47.99% | 398 | 17.3% |