Tongan Male Disability

COMPARE

Tongan
Race
Ancestry
AfghanAfricanAlaska NativeAlaskan AthabascanAlbanianAleutAlsatianAmericanApacheArabArapahoArgentineanArmenianAssyrian/Chaldean/SyriacAustralianAustrianBahamianBangladeshiBarbadianBasqueBelgianBelizeanBermudanBhutaneseBlackfeetBolivianBrazilianBritishBritish West IndianBulgarianBurmeseCajunCambodianCanadianCape VerdeanCarpatho RusynCelticCentral AmericanCentral American IndianCherokeeCheyenneChickasawChileanChineseChippewaChoctawColombianColvilleComancheCosta RicanCreeCreekCroatianCrowCubanCypriotCzechCzechoslovakianDanishDelawareDominicanDutchDutch West IndianEastern EuropeanEcuadorianEgyptianEnglishEstonianEthiopianEuropeanFijianFilipinoFinnishFrenchFrench American IndianFrench CanadianGermanGerman RussianGhanaianGreekGuamanian/ChamorroGuatemalanGuyaneseHaitianHmongHonduranHopiHoumaHungarianIcelanderIndian (Asian)IndonesianInupiatIranianIraqiIrishIroquoisIsraeliItalianJamaicanJapaneseJordanianKenyanKiowaKoreanLaotianLatvianLebaneseLiberianLithuanianLumbeeLuxembourgerMacedonianMalaysianMalteseMarshalleseMenomineeMexicanMexican American IndianMongolianMoroccanNative HawaiianNavajoNepaleseNew ZealanderNicaraguanNigerianNorthern EuropeanNorwegianOkinawanOsageOttawaPaiutePakistaniPalestinianPanamanianParaguayanPennsylvania GermanPeruvianPimaPolishPortuguesePotawatomiPuebloPuerto RicanPuget Sound SalishRomanianRussianSalvadoranSamoanScandinavianScotch-IrishScottishSeminoleSenegaleseSerbianShoshoneSierra LeoneanSiouxSlavicSlovakSloveneSomaliSouth AfricanSouth AmericanSouth American IndianSoviet UnionSpaniardSpanishSpanish AmericanSpanish American IndianSri LankanSubsaharan AfricanSudaneseSwedishSwissSyrianTaiwaneseThaiTlingit-HaidaTohono O'OdhamTonganTrinidadian and TobagonianTsimshianTurkishU.S. Virgin IslanderUgandanUkrainianUruguayanUteVenezuelanVietnameseWelshWest IndianYakamaYaquiYugoslavianYumanYup'ikZimbabwean
Immigration
NonimmigrantsImmigrantsAfghanistanAfricaAlbaniaArgentinaArmeniaAsiaAustraliaAustriaBahamasBangladeshBarbadosBelarusBelgiumBelizeBoliviaBosnia and HerzegovinaBrazilBulgariaBurma/MyanmarCabo VerdeCambodiaCameroonCanadaCaribbeanCentral AmericaChileChinaColombiaCongoCosta RicaCroatiaCubaCzechoslovakiaDenmarkDominicaDominican RepublicEastern AfricaEastern AsiaEastern EuropeEcuadorEgyptEl SalvadorEnglandEritreaEthiopiaEuropeFijiFranceGermanyGhanaGreeceGrenadaGuatemalaGuyanaHaitiHondurasHong KongHungaryIndiaIndonesiaIranIraqIrelandIsraelItalyJamaicaJapanJordanKazakhstanKenyaKoreaKuwaitLaosLatin AmericaLatviaLebanonLiberiaLithuaniaMalaysiaMexicoMicronesiaMiddle AfricaMoldovaMoroccoNepalNetherlandsNicaraguaNigeriaNorth AmericaNorth MacedoniaNorthern AfricaNorthern EuropeNorwayOceaniaPakistanPanamaPeruPhilippinesPolandPortugalRomaniaRussiaSaudi ArabiaScotlandSenegalSerbiaSierra LeoneSingaporeSomaliaSouth AfricaSouth AmericaSouth Central AsiaSouth Eastern AsiaSouthern EuropeSpainSri LankaSt. Vincent and the GrenadinesSudanSwedenSwitzerlandSyriaTaiwanThailandTrinidad and TobagoTurkeyUgandaUkraineUruguayUzbekistanVenezuelaVietnamWest IndiesWestern AfricaWestern AsiaWestern EuropeYemenZaireZimbabweAzores
Select to Compare
Race
Ancestry
AfghanAfricanAlaska NativeAlaskan AthabascanAlbanianAleutAlsatianAmericanApacheArabArapahoArgentineanArmenianAssyrian/Chaldean/SyriacAustralianAustrianBahamianBangladeshiBarbadianBasqueBelgianBelizeanBermudanBhutaneseBlackfeetBolivianBrazilianBritishBritish West IndianBulgarianBurmeseCajunCambodianCanadianCape VerdeanCarpatho RusynCelticCentral AmericanCentral American IndianCherokeeCheyenneChickasawChileanChineseChippewaChoctawColombianColvilleComancheCosta RicanCreeCreekCroatianCrowCubanCypriotCzechCzechoslovakianDanishDelawareDominicanDutchDutch West IndianEastern EuropeanEcuadorianEgyptianEnglishEstonianEthiopianEuropeanFijianFilipinoFinnishFrenchFrench American IndianFrench CanadianGermanGerman RussianGhanaianGreekGuamanian/ChamorroGuatemalanGuyaneseHaitianHmongHonduranHopiHoumaHungarianIcelanderIndian (Asian)IndonesianInupiatIranianIraqiIrishIroquoisIsraeliItalianJamaicanJapaneseJordanianKenyanKiowaKoreanLaotianLatvianLebaneseLiberianLithuanianLumbeeLuxembourgerMacedonianMalaysianMalteseMarshalleseMenomineeMexicanMexican American IndianMongolianMoroccanNative HawaiianNavajoNepaleseNew ZealanderNicaraguanNigerianNorthern EuropeanNorwegianOkinawanOsageOttawaPaiutePakistaniPalestinianPanamanianParaguayanPennsylvania GermanPeruvianPimaPolishPortuguesePotawatomiPuebloPuerto RicanPuget Sound SalishRomanianRussianSalvadoranSamoanScandinavianScotch-IrishScottishSeminoleSenegaleseSerbianShoshoneSierra LeoneanSiouxSlavicSlovakSloveneSomaliSouth AfricanSouth AmericanSouth American IndianSoviet UnionSpaniardSpanishSpanish AmericanSpanish American IndianSri LankanSubsaharan AfricanSudaneseSwedishSwissSyrianTaiwaneseThaiTlingit-HaidaTohono O'OdhamTrinidadian and TobagonianTsimshianTurkishU.S. Virgin IslanderUgandanUkrainianUruguayanUteVenezuelanVietnameseWelshWest IndianYakamaYaquiYugoslavianYumanYup'ikZimbabwean
Immigration
NonimmigrantsImmigrantsAfghanistanAfricaAlbaniaArgentinaArmeniaAsiaAustraliaAustriaBahamasBangladeshBarbadosBelarusBelgiumBelizeBoliviaBosnia and HerzegovinaBrazilBulgariaBurma/MyanmarCabo VerdeCambodiaCameroonCanadaCaribbeanCentral AmericaChileChinaColombiaCongoCosta RicaCroatiaCubaCzechoslovakiaDenmarkDominicaDominican RepublicEastern AfricaEastern AsiaEastern EuropeEcuadorEgyptEl SalvadorEnglandEritreaEthiopiaEuropeFijiFranceGermanyGhanaGreeceGrenadaGuatemalaGuyanaHaitiHondurasHong KongHungaryIndiaIndonesiaIranIraqIrelandIsraelItalyJamaicaJapanJordanKazakhstanKenyaKoreaKuwaitLaosLatin AmericaLatviaLebanonLiberiaLithuaniaMalaysiaMexicoMicronesiaMiddle AfricaMoldovaMoroccoNepalNetherlandsNicaraguaNigeriaNorth AmericaNorth MacedoniaNorthern AfricaNorthern EuropeNorwayOceaniaPakistanPanamaPeruPhilippinesPolandPortugalRomaniaRussiaSaudi ArabiaScotlandSenegalSerbiaSierra LeoneSingaporeSomaliaSouth AfricaSouth AmericaSouth Central AsiaSouth Eastern AsiaSouthern EuropeSpainSri LankaSt. Vincent and the GrenadinesSudanSwedenSwitzerlandSyriaTaiwanThailandTrinidad and TobagoTurkeyUgandaUkraineUruguayUzbekistanVenezuelaVietnamWest IndiesWestern AfricaWestern AsiaWestern EuropeYemenZaireZimbabweAzores
Male Disability
Income
Poverty
Unemployment
Labor Participation
Family Structure
Vehicle Availability
Education Level
Disability

Tongan Male Disability
Exceptional

10.4%
DISABILITY | MALES
99.6/ 100
METRIC RATING
56th/ 347
METRIC RANK

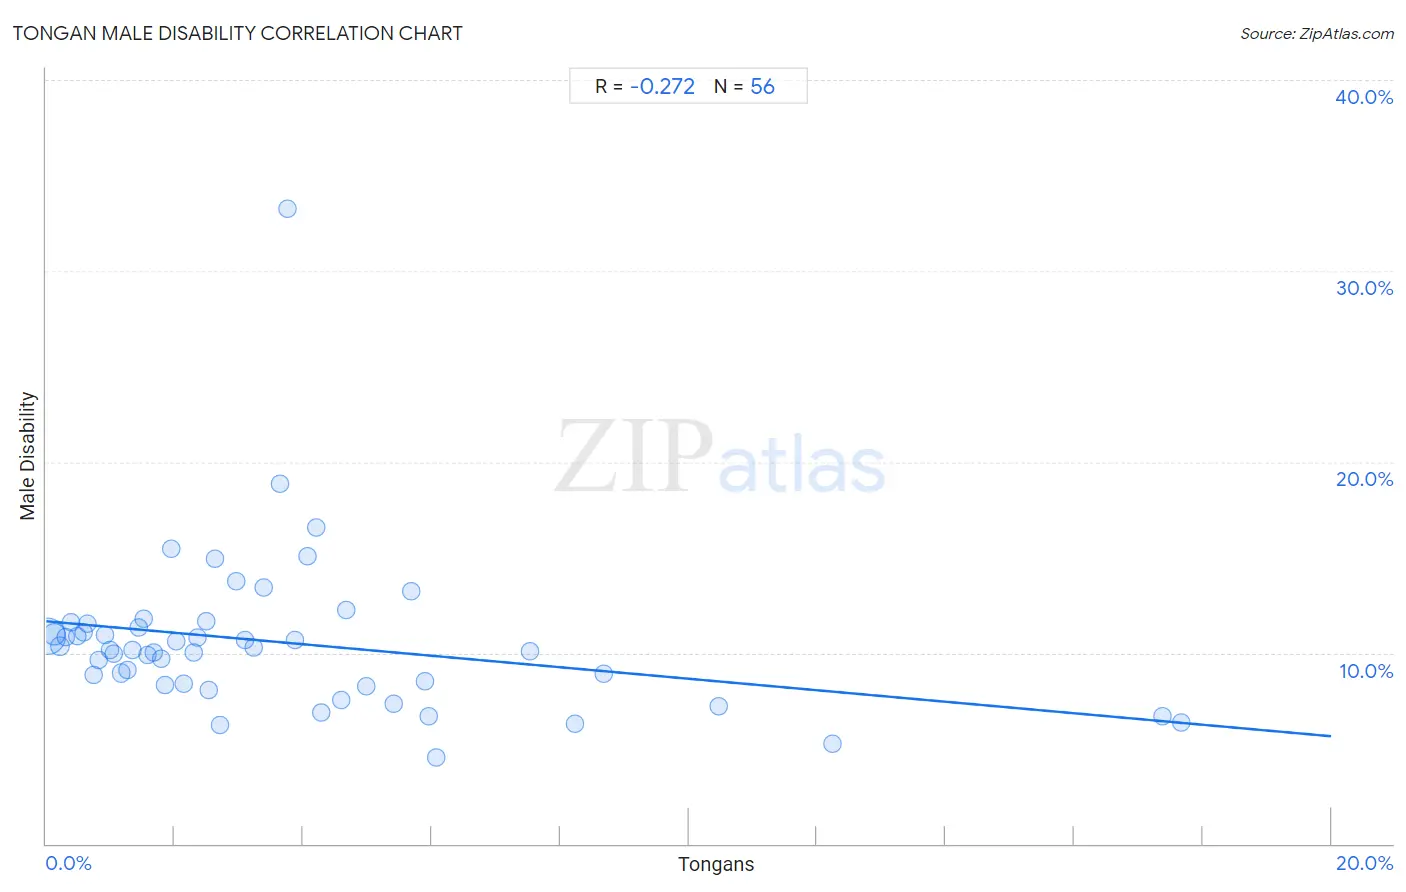
Tongan Male Disability Correlation Chart

The statistical analysis conducted on geographies consisting of 102,894,634 people shows a weak negative correlation between the proportion of Tongans and percentage of males with a disability in the United States with a correlation coefficient (R) of -0.272 and weighted average of 10.4%. On average, for every 1% (one percent) increase in Tongans within a typical geography, there is a decrease of 0.30% in percentage of males with a disability.
Tongan Male Disability
It is essential to understand that the correlation between the percentage of Tongans and percentage of males with a disability does not imply a direct cause-and-effect relationship. It remains uncertain whether the presence of Tongans influences an upward or downward trend in the level of percentage of males with a disability within an area, or if Tongans simply ended up residing in those areas with higher or lower levels of percentage of males with a disability due to other factors.

Demographics Similar to Tongans by Male Disability

In terms of male disability, the demographic groups most similar to Tongans are Immigrants from South America (10.4%, a difference of 0.020%), Immigrants from Eritrea (10.4%, a difference of 0.040%), Peruvian (10.4%, a difference of 0.060%), Immigrants from Uzbekistan (10.4%, a difference of 0.10%), and Immigrants from Japan (10.4%, a difference of 0.10%).
DemographicsRating | RankMale Disability
Immigrants from Spain
99.7
/100
|
#49
Exceptional
10.3%
South Americans
99.6
/100
|
#50
Exceptional
10.3%
Salvadorans
99.6
/100
|
#51
Exceptional
10.4%
Immigrants from Saudi Arabia
99.6
/100
|
#52
Exceptional
10.4%
Immigrants from Uzbekistan
99.6
/100
|
#53
Exceptional
10.4%
Peruvians
99.6
/100
|
#54
Exceptional
10.4%
Immigrants from Eritrea
99.6
/100
|
#55
Exceptional
10.4%
Tongans
99.6
/100
|
#56
Exceptional
10.4%
Immigrants from South America
99.6
/100
|
#57
Exceptional
10.4%
Immigrants from Japan
99.5
/100
|
#58
Exceptional
10.4%
Immigrants from Australia
99.5
/100
|
#59
Exceptional
10.4%
Immigrants from Colombia
99.5
/100
|
#60
Exceptional
10.4%
Immigrants from Northern Africa
99.4
/100
|
#61
Exceptional
10.4%
Immigrants from Ecuador
99.3
/100
|
#62
Exceptional
10.4%
Immigrants from Belarus
99.3
/100
|
#63
Exceptional
10.4%

Tongan Male Disability Correlation Summary

MeasurementTongan DataMale Disability Data
Minimum0.023%4.5%
Maximum17.7%33.3%
Range17.6%28.7%
Mean3.6%10.6%
Median2.5%10.2%
Interquartile 25% (IQ1)1.2%8.3%
Interquartile 75% (IQ3)4.6%11.4%
Interquartile Range (IQR)3.4%3.1%
Standard Deviation (Sample)3.8%4.2%
Standard Deviation (Population)3.7%4.1%

Correlation Details

Tongan PercentileSample SizeMale Disability
[
0.0%
-
0.5%
]
0.023%
74,462,04510.8%
[
0.0%
-
0.5%
]
0.13%
10,599,85511.0%
[
0.0%
-
0.5%
]
0.22%
5,202,73310.3%
[
0.0%
-
0.5%
]
0.31%
3,571,82810.8%
[
0.0%
-
0.5%
]
0.39%
1,855,23411.6%
[
0.0%
-
0.5%
]
0.48%
1,299,94710.9%
[
0.5%
-
1.0%
]
0.58%
1,279,27811.1%
[
0.5%
-
1.0%
]
0.64%
669,68711.5%
[
0.5%
-
1.0%
]
0.74%
615,6048.8%
[
0.5%
-
1.0%
]
0.82%
305,9019.6%
[
0.5%
-
1.0%
]
0.91%
241,28110.9%
[
1.0%
-
1.5%
]
1.00%
230,15410.2%
[
1.0%
-
1.5%
]
1.05%
430,15610.0%
[
1.0%
-
1.5%
]
1.16%
586,5378.9%
[
1.0%
-
1.5%
]
1.27%
88,8059.1%
[
1.0%
-
1.5%
]
1.34%
76,40810.2%
[
1.0%
-
1.5%
]
1.43%
235,69011.3%
[
1.5%
-
2.0%
]
1.53%
70,74911.8%
[
1.5%
-
2.0%
]
1.58%
99,7299.9%
[
1.5%
-
2.0%
]
1.68%
62,01910.0%
[
1.5%
-
2.0%
]
1.79%
100,7309.7%
[
1.5%
-
2.0%
]
1.84%
11,9438.3%
[
1.5%
-
2.0%
]
1.94%
18,78915.4%
[
2.0%
-
2.5%
]
2.02%
74,25010.6%
[
2.0%
-
2.5%
]
2.13%
100,9928.4%
[
2.0%
-
2.5%
]
2.29%
179,96210.0%
[
2.0%
-
2.5%
]
2.36%
48,69210.8%
[
2.0%
-
2.5%
]
2.49%
23,70811.7%
[
2.5%
-
3.0%
]
2.52%
35,3928.1%
[
2.5%
-
3.0%
]
2.62%
3,39714.9%
[
2.5%
-
3.0%
]
2.70%
56,7096.2%
[
2.5%
-
3.0%
]
2.97%
13,28113.7%
[
3.0%
-
3.5%
]
3.09%
26,95410.7%
[
3.0%
-
3.5%
]
3.24%
92,16010.3%
[
3.0%
-
3.5%
]
3.39%
29513.4%
[
3.5%
-
4.0%
]
3.63%
3,74618.8%
[
3.5%
-
4.0%
]
3.75%
85333.3%
[
3.5%
-
4.0%
]
3.86%
1,52710.7%
[
4.0%
-
4.5%
]
4.07%
6,72415.1%
[
4.0%
-
4.5%
]
4.21%
4,70816.5%
[
4.0%
-
4.5%
]
4.29%
30,9836.9%
[
4.5%
-
5.0%
]
4.59%
12,9067.5%
[
4.5%
-
5.0%
]
4.68%
4,55512.3%
[
4.5%
-
5.0%
]
4.97%
23,2148.3%
[
5.0%
-
5.5%
]
5.40%
7227.3%
[
5.5%
-
6.0%
]
5.68%
3,59313.2%
[
5.5%
-
6.0%
]
5.89%
1,6488.5%
[
5.5%
-
6.0%
]
5.95%
3,9866.7%
[
6.0%
-
6.5%
]
6.06%
6934.5%
[
7.5%
-
8.0%
]
7.54%
6,77910.1%
[
8.0%
-
8.5%
]
8.24%
5106.3%
[
8.5%
-
9.0%
]
8.68%
2,7428.9%
[
10.0%
-
10.5%
]
10.47%
2,2747.2%
[
12.0%
-
12.5%
]
12.24%
3925.2%
[
17.0%
-
17.5%
]
17.37%
5,4116.7%
[
17.5%
-
18.0%
]
17.67%
5,7746.3%