Pima vs Immigrants from the Azores Male Disability
COMPARE
Pima
Immigrants from the Azores
Male Disability
Male Disability Comparison
Pima
Immigrants from the Azores
12.8%
MALE DISABILITY
0.0/ 100
METRIC RATING
290th/ 347
METRIC RANK
13.4%
MALE DISABILITY
0.0/ 100
METRIC RATING
310th/ 347
METRIC RANK
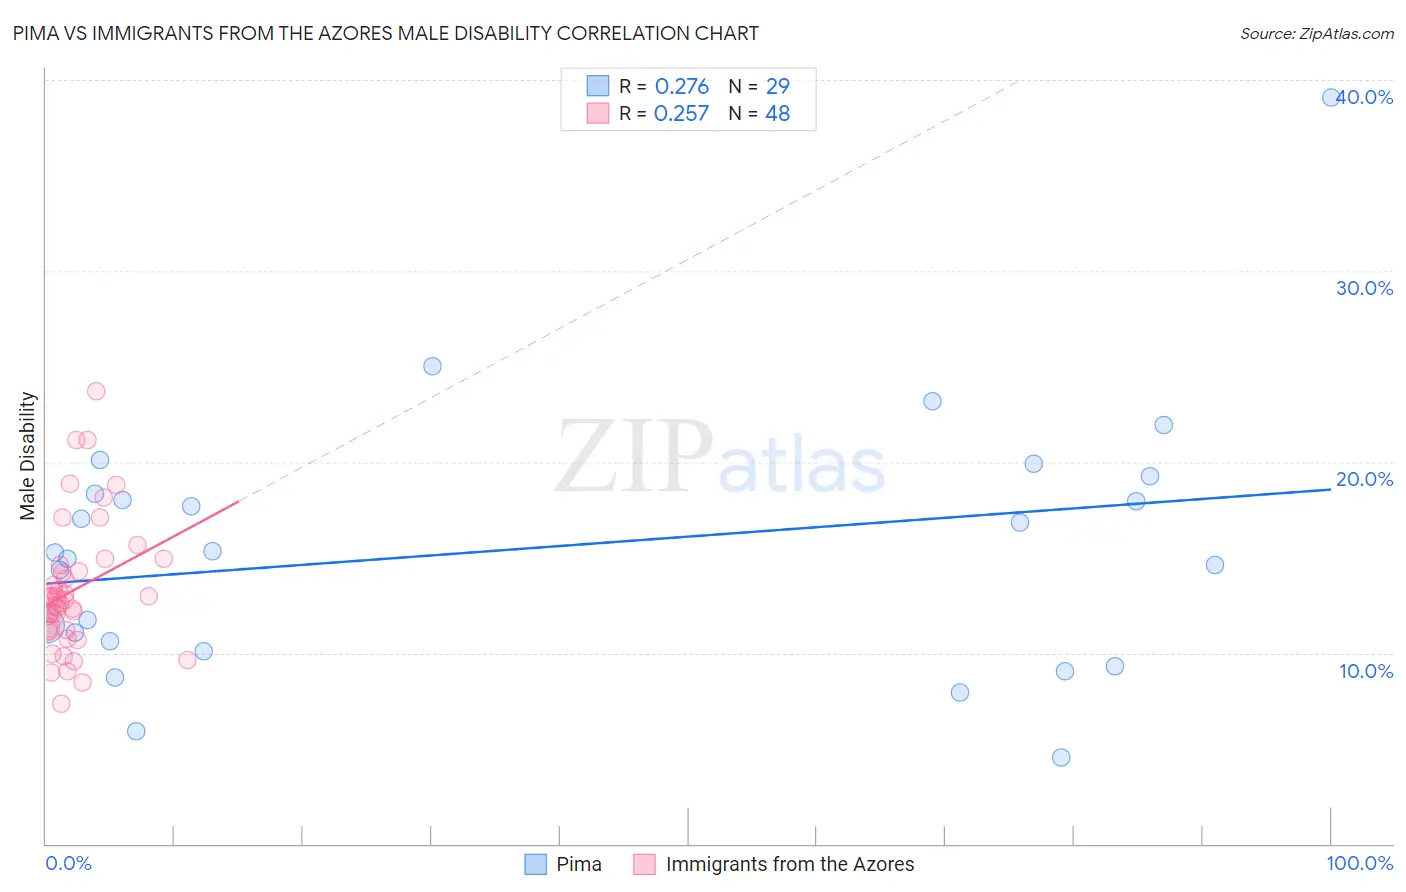
Pima vs Immigrants from the Azores Male Disability Correlation Chart
The statistical analysis conducted on geographies consisting of 61,540,793 people shows a weak positive correlation between the proportion of Pima and percentage of males with a disability in the United States with a correlation coefficient (R) of 0.276 and weighted average of 12.8%. Similarly, the statistical analysis conducted on geographies consisting of 46,257,178 people shows a weak positive correlation between the proportion of Immigrants from the Azores and percentage of males with a disability in the United States with a correlation coefficient (R) of 0.257 and weighted average of 13.4%, a difference of 4.7%.
Male Disability Correlation Summary
| Measurement | Pima | Immigrants from the Azores |
| Minimum | 4.5% | 7.4% |
| Maximum | 39.1% | 23.7% |
| Range | 34.6% | 16.3% |
| Mean | 15.5% | 13.3% |
| Median | 15.3% | 12.8% |
| Interquartile 25% (IQ1) | 10.3% | 11.2% |
| Interquartile 75% (IQ3) | 18.8% | 14.4% |
| Interquartile Range (IQR) | 8.5% | 3.2% |
| Standard Deviation (Sample) | 6.9% | 3.4% |
| Standard Deviation (Population) | 6.8% | 3.4% |
Demographics Similar to Pima and Immigrants from the Azores by Male Disability
In terms of male disability, the demographic groups most similar to Pima are White/Caucasian (12.8%, a difference of 0.090%), English (12.8%, a difference of 0.15%), Yaqui (12.9%, a difference of 0.44%), Marshallese (12.9%, a difference of 0.68%), and Immigrants from Micronesia (12.9%, a difference of 0.77%). Similarly, the demographic groups most similar to Immigrants from the Azores are Blackfeet (13.4%, a difference of 0.14%), French American Indian (13.4%, a difference of 0.56%), Arapaho (13.3%, a difference of 0.72%), Spanish American (13.3%, a difference of 0.94%), and French Canadian (13.3%, a difference of 1.1%).
| Demographics | Rating | Rank | Male Disability |
| Pima | 0.0 /100 | #290 | Tragic 12.8% |
| Whites/Caucasians | 0.0 /100 | #291 | Tragic 12.8% |
| English | 0.0 /100 | #292 | Tragic 12.8% |
| Yaqui | 0.0 /100 | #293 | Tragic 12.9% |
| Marshallese | 0.0 /100 | #294 | Tragic 12.9% |
| Immigrants | Micronesia | 0.0 /100 | #295 | Tragic 12.9% |
| Immigrants | Nonimmigrants | 0.0 /100 | #296 | Tragic 12.9% |
| Inupiat | 0.0 /100 | #297 | Tragic 13.0% |
| Pennsylvania Germans | 0.0 /100 | #298 | Tragic 13.0% |
| Celtics | 0.0 /100 | #299 | Tragic 13.0% |
| Cheyenne | 0.0 /100 | #300 | Tragic 13.0% |
| French | 0.0 /100 | #301 | Tragic 13.0% |
| Crow | 0.0 /100 | #302 | Tragic 13.1% |
| Scotch-Irish | 0.0 /100 | #303 | Tragic 13.2% |
| Blacks/African Americans | 0.0 /100 | #304 | Tragic 13.2% |
| French Canadians | 0.0 /100 | #305 | Tragic 13.3% |
| Spanish Americans | 0.0 /100 | #306 | Tragic 13.3% |
| Arapaho | 0.0 /100 | #307 | Tragic 13.3% |
| French American Indians | 0.0 /100 | #308 | Tragic 13.4% |
| Blackfeet | 0.0 /100 | #309 | Tragic 13.4% |
| Immigrants | Azores | 0.0 /100 | #310 | Tragic 13.4% |