American Male Disability
COMPARE
American
Select to Compare
Male Disability
American Male Disability
13.8%
DISABILITY | MALES
0.0/ 100
METRIC RATING
319th/ 347
METRIC RANK
American Male Disability Correlation Chart
The statistical analysis conducted on geographies consisting of 581,581,297 people shows a significant positive correlation between the proportion of Americans and percentage of males with a disability in the United States with a correlation coefficient (R) of 0.624 and weighted average of 13.8%. On average, for every 1% (one percent) increase in Americans within a typical geography, there is an increase of 0.20% in percentage of males with a disability.
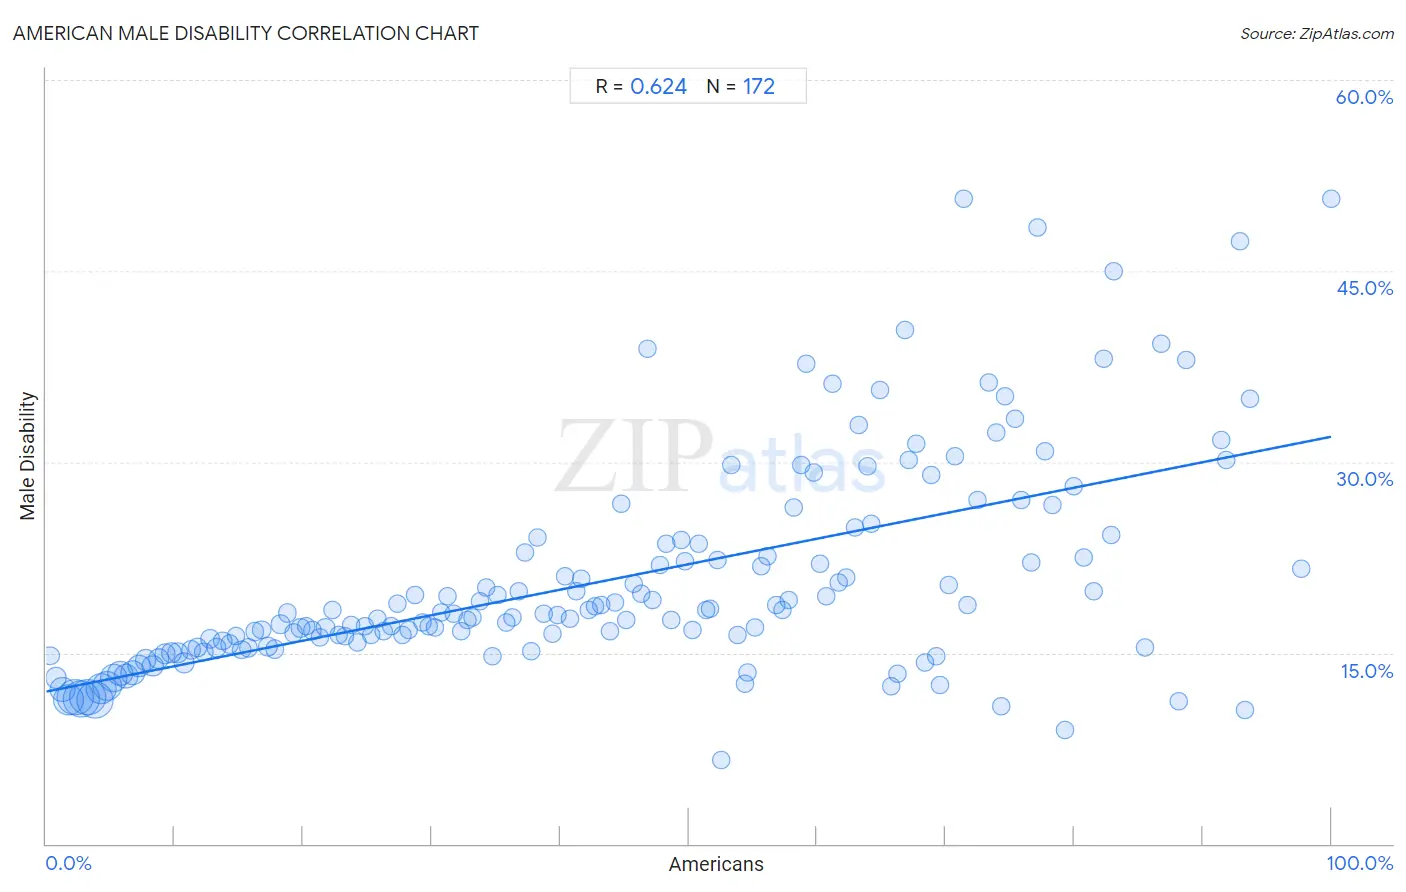
It is essential to understand that the correlation between the percentage of Americans and percentage of males with a disability does not imply a direct cause-and-effect relationship. It remains uncertain whether the presence of Americans influences an upward or downward trend in the level of percentage of males with a disability within an area, or if Americans simply ended up residing in those areas with higher or lower levels of percentage of males with a disability due to other factors.
Demographics Similar to Americans by Male Disability
In terms of male disability, the demographic groups most similar to Americans are Cree (13.7%, a difference of 0.41%), Tlingit-Haida (13.8%, a difference of 0.49%), Shoshone (13.8%, a difference of 0.54%), Paiute (13.7%, a difference of 0.62%), and Alaska Native (13.6%, a difference of 1.4%).
| Demographics | Rating | Rank | Male Disability |
| Yakama | 0.0 /100 | #312 | Tragic 13.5% |
| Puget Sound Salish | 0.0 /100 | #313 | Tragic 13.5% |
| Aleuts | 0.0 /100 | #314 | Tragic 13.5% |
| Iroquois | 0.0 /100 | #315 | Tragic 13.6% |
| Alaska Natives | 0.0 /100 | #316 | Tragic 13.6% |
| Paiute | 0.0 /100 | #317 | Tragic 13.7% |
| Cree | 0.0 /100 | #318 | Tragic 13.7% |
| Americans | 0.0 /100 | #319 | Tragic 13.8% |
| Tlingit-Haida | 0.0 /100 | #320 | Tragic 13.8% |
| Shoshone | 0.0 /100 | #321 | Tragic 13.8% |
| Apache | 0.0 /100 | #322 | Tragic 14.0% |
| Osage | 0.0 /100 | #323 | Tragic 14.0% |
| Comanche | 0.0 /100 | #324 | Tragic 14.1% |
| Ottawa | 0.0 /100 | #325 | Tragic 14.1% |
| Natives/Alaskans | 0.0 /100 | #326 | Tragic 14.2% |
American Male Disability Correlation Summary
| Measurement | American Data | Male Disability Data |
| Minimum | 0.33% | 6.6% |
| Maximum | 100.0% | 50.7% |
| Range | 99.7% | 44.1% |
| Mean | 43.8% | 20.7% |
| Median | 43.0% | 18.0% |
| Interquartile 25% (IQ1) | 21.5% | 15.4% |
| Interquartile 75% (IQ3) | 64.5% | 23.2% |
| Interquartile Range (IQR) | 43.0% | 7.8% |
| Standard Deviation (Sample) | 26.2% | 8.4% |
| Standard Deviation (Population) | 26.1% | 8.4% |
Correlation Details
| American Percentile | Sample Size | Male Disability |
[ 0.0% - 0.5% ] 0.33% | 2,864,778 | 14.8% |
[ 0.5% - 1.0% ] 0.79% | 9,286,173 | 13.0% |
[ 1.0% - 1.5% ] 1.28% | 22,659,122 | 12.1% |
[ 1.5% - 2.0% ] 1.76% | 39,872,221 | 11.3% |
[ 2.0% - 2.5% ] 2.26% | 56,422,785 | 11.5% |
[ 2.5% - 3.0% ] 2.75% | 57,574,040 | 11.4% |
[ 3.0% - 3.5% ] 3.24% | 56,624,453 | 11.5% |
[ 3.5% - 4.0% ] 3.75% | 58,063,105 | 11.3% |
[ 4.0% - 4.5% ] 4.25% | 39,217,113 | 12.2% |
[ 4.5% - 5.0% ] 4.74% | 36,930,344 | 12.4% |
[ 5.0% - 5.5% ] 5.25% | 27,441,368 | 13.0% |
[ 5.5% - 6.0% ] 5.76% | 21,811,504 | 13.4% |
[ 6.0% - 6.5% ] 6.24% | 20,194,658 | 13.1% |
[ 6.5% - 7.0% ] 6.75% | 17,751,287 | 13.4% |
[ 7.0% - 7.5% ] 7.24% | 13,272,820 | 14.0% |
[ 7.5% - 8.0% ] 7.74% | 11,306,434 | 14.4% |
[ 8.0% - 8.5% ] 8.26% | 10,161,291 | 14.0% |
[ 8.5% - 9.0% ] 8.74% | 7,904,503 | 14.5% |
[ 9.0% - 9.5% ] 9.25% | 7,277,773 | 14.9% |
[ 9.5% - 10.0% ] 9.74% | 6,232,867 | 15.0% |
[ 10.0% - 10.5% ] 10.24% | 5,954,121 | 15.0% |
[ 10.5% - 11.0% ] 10.73% | 5,671,235 | 14.2% |
[ 11.0% - 11.5% ] 11.24% | 4,772,848 | 15.3% |
[ 11.5% - 12.0% ] 11.72% | 4,197,805 | 15.4% |
[ 12.0% - 12.5% ] 12.25% | 3,408,069 | 15.1% |
[ 12.5% - 13.0% ] 12.73% | 3,272,324 | 16.1% |
[ 13.0% - 13.5% ] 13.24% | 2,471,460 | 15.4% |
[ 13.5% - 14.0% ] 13.75% | 2,203,483 | 16.0% |
[ 14.0% - 14.5% ] 14.27% | 2,021,193 | 15.7% |
[ 14.5% - 15.0% ] 14.76% | 1,767,720 | 16.3% |
[ 15.0% - 15.5% ] 15.21% | 1,525,017 | 15.2% |
[ 15.5% - 16.0% ] 15.76% | 1,831,598 | 15.4% |
[ 16.0% - 16.5% ] 16.24% | 1,582,842 | 16.7% |
[ 16.5% - 17.0% ] 16.77% | 1,180,550 | 16.8% |
[ 17.0% - 17.5% ] 17.23% | 1,486,918 | 15.5% |
[ 17.5% - 18.0% ] 17.76% | 1,399,963 | 15.3% |
[ 18.0% - 18.5% ] 18.22% | 959,843 | 17.2% |
[ 18.5% - 19.0% ] 18.75% | 773,086 | 18.1% |
[ 19.0% - 19.5% ] 19.23% | 836,875 | 16.6% |
[ 19.5% - 20.0% ] 19.77% | 939,226 | 17.0% |
[ 20.0% - 20.5% ] 20.25% | 614,595 | 17.1% |
[ 20.5% - 21.0% ] 20.73% | 512,454 | 16.7% |
[ 21.0% - 21.5% ] 21.29% | 684,551 | 16.2% |
[ 21.5% - 22.0% ] 21.73% | 558,350 | 17.0% |
[ 22.0% - 22.5% ] 22.24% | 364,372 | 18.4% |
[ 22.5% - 23.0% ] 22.75% | 620,587 | 16.4% |
[ 23.0% - 23.5% ] 23.28% | 392,786 | 16.3% |
[ 23.5% - 24.0% ] 23.75% | 420,648 | 17.2% |
[ 24.0% - 24.5% ] 24.26% | 457,237 | 15.8% |
[ 24.5% - 25.0% ] 24.76% | 300,729 | 17.0% |
[ 25.0% - 25.5% ] 25.26% | 297,693 | 16.4% |
[ 25.5% - 26.0% ] 25.74% | 296,643 | 17.7% |
[ 26.0% - 26.5% ] 26.24% | 278,042 | 16.7% |
[ 26.5% - 27.0% ] 26.85% | 522,733 | 17.1% |
[ 27.0% - 27.5% ] 27.30% | 262,226 | 18.8% |
[ 27.5% - 28.0% ] 27.75% | 273,128 | 16.4% |
[ 28.0% - 28.5% ] 28.23% | 258,586 | 16.8% |
[ 28.5% - 29.0% ] 28.71% | 147,664 | 19.5% |
[ 29.0% - 29.5% ] 29.25% | 240,077 | 17.4% |
[ 29.5% - 30.0% ] 29.72% | 187,259 | 17.1% |
[ 30.0% - 30.5% ] 30.28% | 117,907 | 17.0% |
[ 30.5% - 31.0% ] 30.75% | 257,959 | 18.1% |
[ 31.0% - 31.5% ] 31.24% | 134,059 | 19.5% |
[ 31.5% - 32.0% ] 31.72% | 81,534 | 18.1% |
[ 32.0% - 32.5% ] 32.25% | 249,127 | 16.7% |
[ 32.5% - 33.0% ] 32.76% | 109,714 | 17.6% |
[ 33.0% - 33.5% ] 33.21% | 102,571 | 17.7% |
[ 33.5% - 34.0% ] 33.73% | 90,677 | 19.0% |
[ 34.0% - 34.5% ] 34.22% | 52,799 | 20.2% |
[ 34.5% - 35.0% ] 34.75% | 98,542 | 14.7% |
[ 35.0% - 35.5% ] 35.16% | 54,135 | 19.5% |
[ 35.5% - 36.0% ] 35.77% | 118,194 | 17.4% |
[ 36.0% - 36.5% ] 36.27% | 130,958 | 17.7% |
[ 36.5% - 37.0% ] 36.80% | 55,648 | 19.8% |
[ 37.0% - 37.5% ] 37.21% | 64,095 | 22.9% |
[ 37.5% - 38.0% ] 37.71% | 91,036 | 15.1% |
[ 38.0% - 38.5% ] 38.24% | 44,874 | 24.1% |
[ 38.5% - 39.0% ] 38.72% | 49,520 | 18.1% |
[ 39.0% - 39.5% ] 39.35% | 73,239 | 16.5% |
[ 39.5% - 40.0% ] 39.79% | 55,504 | 18.0% |
[ 40.0% - 40.5% ] 40.33% | 26,466 | 21.0% |
[ 40.5% - 41.0% ] 40.79% | 34,488 | 17.7% |
[ 41.0% - 41.5% ] 41.28% | 42,070 | 19.9% |
[ 41.5% - 42.0% ] 41.66% | 31,333 | 20.8% |
[ 42.0% - 42.5% ] 42.25% | 26,878 | 18.4% |
[ 42.5% - 43.0% ] 42.71% | 20,555 | 18.7% |
[ 43.0% - 43.5% ] 43.22% | 54,270 | 18.8% |
[ 43.5% - 44.0% ] 43.86% | 40,041 | 16.7% |
[ 44.0% - 44.5% ] 44.26% | 16,833 | 19.0% |
[ 44.5% - 45.0% ] 44.76% | 37,757 | 26.7% |
[ 45.0% - 45.5% ] 45.18% | 13,472 | 17.6% |
[ 45.5% - 46.0% ] 45.74% | 24,974 | 20.4% |
[ 46.0% - 46.5% ] 46.33% | 12,821 | 19.6% |
[ 46.5% - 47.0% ] 46.78% | 4,848 | 38.9% |
[ 47.0% - 47.5% ] 47.15% | 30,932 | 19.2% |
[ 47.5% - 48.0% ] 47.75% | 10,657 | 21.9% |
[ 48.0% - 48.5% ] 48.28% | 25,867 | 23.6% |
[ 48.5% - 49.0% ] 48.68% | 8,847 | 17.5% |
[ 49.0% - 49.5% ] 49.37% | 17,082 | 23.9% |
[ 49.5% - 50.0% ] 49.74% | 18,773 | 22.2% |
[ 50.0% - 50.5% ] 50.31% | 21,003 | 16.8% |
[ 50.5% - 51.0% ] 50.82% | 5,598 | 23.6% |
[ 51.0% - 51.5% ] 51.32% | 6,538 | 18.4% |
[ 51.5% - 52.0% ] 51.65% | 15,873 | 18.5% |
[ 52.0% - 52.5% ] 52.21% | 12,958 | 22.3% |
[ 52.5% - 53.0% ] 52.56% | 19,559 | 6.6% |
[ 53.0% - 53.5% ] 53.30% | 15,800 | 29.8% |
[ 53.5% - 54.0% ] 53.79% | 2,058 | 16.4% |
[ 54.0% - 54.5% ] 54.37% | 1,133 | 12.6% |
[ 54.5% - 55.0% ] 54.62% | 10,753 | 13.4% |
[ 55.0% - 55.5% ] 55.18% | 2,035 | 17.0% |
[ 55.5% - 56.0% ] 55.67% | 4,961 | 21.8% |
[ 56.0% - 56.5% ] 56.12% | 9,618 | 22.6% |
[ 56.5% - 57.0% ] 56.80% | 16,515 | 18.8% |
[ 57.0% - 57.5% ] 57.26% | 2,148 | 18.3% |
[ 57.5% - 58.0% ] 57.78% | 1,196 | 19.2% |
[ 58.0% - 58.5% ] 58.17% | 2,080 | 26.4% |
[ 58.5% - 59.0% ] 58.76% | 11,364 | 29.7% |
[ 59.0% - 59.5% ] 59.13% | 1,128 | 37.7% |
[ 59.5% - 60.0% ] 59.73% | 3,146 | 29.2% |
[ 60.0% - 60.5% ] 60.25% | 4,838 | 22.0% |
[ 60.5% - 61.0% ] 60.75% | 2,843 | 19.5% |
[ 61.0% - 61.5% ] 61.16% | 1,035 | 36.1% |
[ 61.5% - 62.0% ] 61.70% | 6,849 | 20.6% |
[ 62.0% - 62.5% ] 62.25% | 3,004 | 21.0% |
[ 62.5% - 63.0% ] 62.94% | 3,071 | 24.9% |
[ 63.0% - 63.5% ] 63.26% | 6,170 | 32.9% |
[ 63.5% - 64.0% ] 63.87% | 2,336 | 29.6% |
[ 64.0% - 64.5% ] 64.17% | 307 | 25.1% |
[ 64.5% - 65.0% ] 64.87% | 2,189 | 35.6% |
[ 65.5% - 66.0% ] 65.80% | 807 | 12.4% |
[ 66.0% - 66.5% ] 66.27% | 83 | 13.3% |
[ 66.5% - 67.0% ] 66.80% | 1,961 | 40.3% |
[ 67.0% - 67.5% ] 67.17% | 4,593 | 30.1% |
[ 67.5% - 68.0% ] 67.66% | 2,455 | 31.4% |
[ 68.0% - 68.5% ] 68.41% | 1,412 | 14.2% |
[ 68.5% - 69.0% ] 68.82% | 170 | 29.0% |
[ 69.0% - 69.5% ] 69.23% | 195 | 14.7% |
[ 69.5% - 70.0% ] 69.57% | 2,984 | 12.5% |
[ 70.0% - 70.5% ] 70.24% | 719 | 20.3% |
[ 70.5% - 71.0% ] 70.73% | 1,124 | 30.4% |
[ 71.0% - 71.5% ] 71.36% | 597 | 50.6% |
[ 71.5% - 72.0% ] 71.71% | 608 | 18.8% |
[ 72.0% - 72.5% ] 72.44% | 2,431 | 27.0% |
[ 73.0% - 73.5% ] 73.34% | 664 | 36.2% |
[ 73.5% - 74.0% ] 73.91% | 1,510 | 32.4% |
[ 74.0% - 74.5% ] 74.29% | 700 | 10.8% |
[ 74.5% - 75.0% ] 74.63% | 1,506 | 35.1% |
[ 75.0% - 75.5% ] 75.34% | 438 | 33.3% |
[ 75.5% - 76.0% ] 75.85% | 1,764 | 27.0% |
[ 76.5% - 77.0% ] 76.68% | 922 | 22.1% |
[ 77.0% - 77.5% ] 77.19% | 583 | 48.4% |
[ 77.5% - 78.0% ] 77.68% | 717 | 30.8% |
[ 78.0% - 78.5% ] 78.28% | 640 | 26.6% |
[ 79.0% - 79.5% ] 79.31% | 1,020 | 8.9% |
[ 80.0% - 80.5% ] 80.00% | 175 | 28.1% |
[ 80.5% - 81.0% ] 80.71% | 482 | 22.5% |
[ 81.5% - 82.0% ] 81.55% | 168 | 19.8% |
[ 82.0% - 82.5% ] 82.27% | 141 | 38.1% |
[ 82.5% - 83.0% ] 82.84% | 169 | 24.3% |
[ 83.0% - 83.5% ] 83.12% | 154 | 45.0% |
[ 85.5% - 86.0% ] 85.51% | 690 | 15.4% |
[ 86.5% - 87.0% ] 86.79% | 106 | 39.2% |
[ 88.0% - 88.5% ] 88.10% | 462 | 11.2% |
[ 88.5% - 89.0% ] 88.73% | 71 | 38.0% |
[ 91.0% - 91.5% ] 91.48% | 493 | 31.7% |
[ 91.5% - 92.0% ] 91.88% | 517 | 30.2% |
[ 92.5% - 93.0% ] 92.86% | 42 | 47.4% |
[ 93.0% - 93.5% ] 93.31% | 314 | 10.5% |
[ 93.5% - 94.0% ] 93.64% | 110 | 35.0% |
[ 97.5% - 98.0% ] 97.64% | 339 | 21.6% |
[ 99.5% - 100.0% ] 100.00% | 1,924 | 50.7% |