Palestinian vs Danish Disability Age Under 5
COMPARE
Palestinian
Danish
Disability Age Under 5
Disability Age Under 5 Comparison
Palestinians
Danes
1.2%
DISABILITY AGE UNDER 5
43.0/ 100
METRIC RATING
184th/ 347
METRIC RANK
1.5%
DISABILITY AGE UNDER 5
0.0/ 100
METRIC RATING
279th/ 347
METRIC RANK
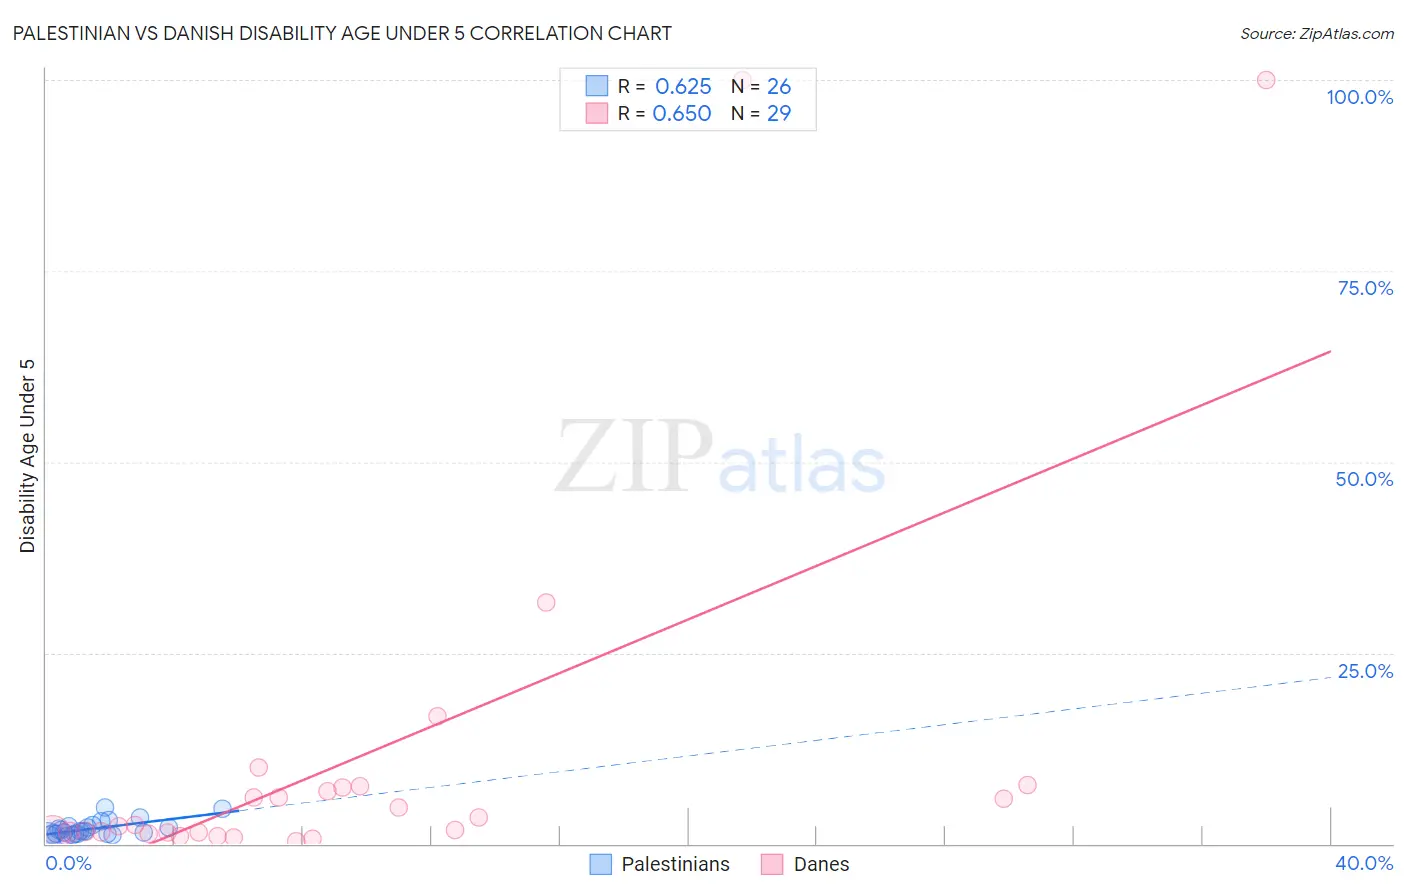
Palestinian vs Danish Disability Age Under 5 Correlation Chart
The statistical analysis conducted on geographies consisting of 140,188,705 people shows a significant positive correlation between the proportion of Palestinians and percentage of population with a disability under the age of 5 in the United States with a correlation coefficient (R) of 0.625 and weighted average of 1.2%. Similarly, the statistical analysis conducted on geographies consisting of 235,175,011 people shows a significant positive correlation between the proportion of Danes and percentage of population with a disability under the age of 5 in the United States with a correlation coefficient (R) of 0.650 and weighted average of 1.5%, a difference of 18.3%.
Disability Age Under 5 Correlation Summary
| Measurement | Palestinian | Danish |
| Minimum | 0.93% | 0.30% |
| Maximum | 4.7% | 100.0% |
| Range | 3.8% | 99.7% |
| Mean | 2.0% | 11.5% |
| Median | 1.6% | 2.5% |
| Interquartile 25% (IQ1) | 1.3% | 1.4% |
| Interquartile 75% (IQ3) | 2.4% | 7.4% |
| Interquartile Range (IQR) | 1.1% | 6.0% |
| Standard Deviation (Sample) | 1.0% | 25.3% |
| Standard Deviation (Population) | 1.0% | 24.8% |
Similar Demographics by Disability Age Under 5
Demographics Similar to Palestinians by Disability Age Under 5
In terms of disability age under 5, the demographic groups most similar to Palestinians are Immigrants from Saudi Arabia (1.2%, a difference of 0.020%), Immigrants from Western Africa (1.2%, a difference of 0.050%), Cuban (1.2%, a difference of 0.050%), Macedonian (1.2%, a difference of 0.060%), and Immigrants from Peru (1.2%, a difference of 0.060%).
| Demographics | Rating | Rank | Disability Age Under 5 |
| Comanche | 47.5 /100 | #177 | Average 1.2% |
| Venezuelans | 47.1 /100 | #178 | Average 1.2% |
| Immigrants | Bahamas | 45.2 /100 | #179 | Average 1.2% |
| Immigrants | Mexico | 44.4 /100 | #180 | Average 1.2% |
| Macedonians | 43.7 /100 | #181 | Average 1.2% |
| Immigrants | Peru | 43.7 /100 | #181 | Average 1.2% |
| Immigrants | Saudi Arabia | 43.3 /100 | #183 | Average 1.2% |
| Palestinians | 43.0 /100 | #184 | Average 1.2% |
| Immigrants | Western Africa | 42.5 /100 | #185 | Average 1.2% |
| Cubans | 42.5 /100 | #186 | Average 1.2% |
| Immigrants | Haiti | 40.2 /100 | #187 | Average 1.3% |
| Haitians | 39.9 /100 | #188 | Fair 1.3% |
| Peruvians | 37.6 /100 | #189 | Fair 1.3% |
| Immigrants | Laos | 36.6 /100 | #190 | Fair 1.3% |
| Mexican American Indians | 36.6 /100 | #191 | Fair 1.3% |
Demographics Similar to Danes by Disability Age Under 5
In terms of disability age under 5, the demographic groups most similar to Danes are Kiowa (1.5%, a difference of 0.010%), Canadian (1.5%, a difference of 0.090%), British (1.5%, a difference of 0.76%), Greek (1.5%, a difference of 0.79%), and Brazilian (1.5%, a difference of 1.4%).
| Demographics | Rating | Rank | Disability Age Under 5 |
| Blacks/African Americans | 0.1 /100 | #272 | Tragic 1.4% |
| Alaskan Athabascans | 0.1 /100 | #273 | Tragic 1.5% |
| Iroquois | 0.0 /100 | #274 | Tragic 1.5% |
| Brazilians | 0.0 /100 | #275 | Tragic 1.5% |
| Greeks | 0.0 /100 | #276 | Tragic 1.5% |
| Canadians | 0.0 /100 | #277 | Tragic 1.5% |
| Kiowa | 0.0 /100 | #278 | Tragic 1.5% |
| Danes | 0.0 /100 | #279 | Tragic 1.5% |
| British | 0.0 /100 | #280 | Tragic 1.5% |
| Czechoslovakians | 0.0 /100 | #281 | Tragic 1.5% |
| Cheyenne | 0.0 /100 | #282 | Tragic 1.5% |
| Delaware | 0.0 /100 | #283 | Tragic 1.5% |
| Europeans | 0.0 /100 | #284 | Tragic 1.5% |
| Croatians | 0.0 /100 | #285 | Tragic 1.5% |
| Tlingit-Haida | 0.0 /100 | #286 | Tragic 1.5% |