Palestinian vs Yaqui Disability Age Under 5
COMPARE
Palestinian
Yaqui
Disability Age Under 5
Disability Age Under 5 Comparison
Palestinians
Yaqui
1.2%
DISABILITY AGE UNDER 5
43.0/ 100
METRIC RATING
184th/ 347
METRIC RANK
1.2%
DISABILITY AGE UNDER 5
74.8/ 100
METRIC RATING
151st/ 347
METRIC RANK
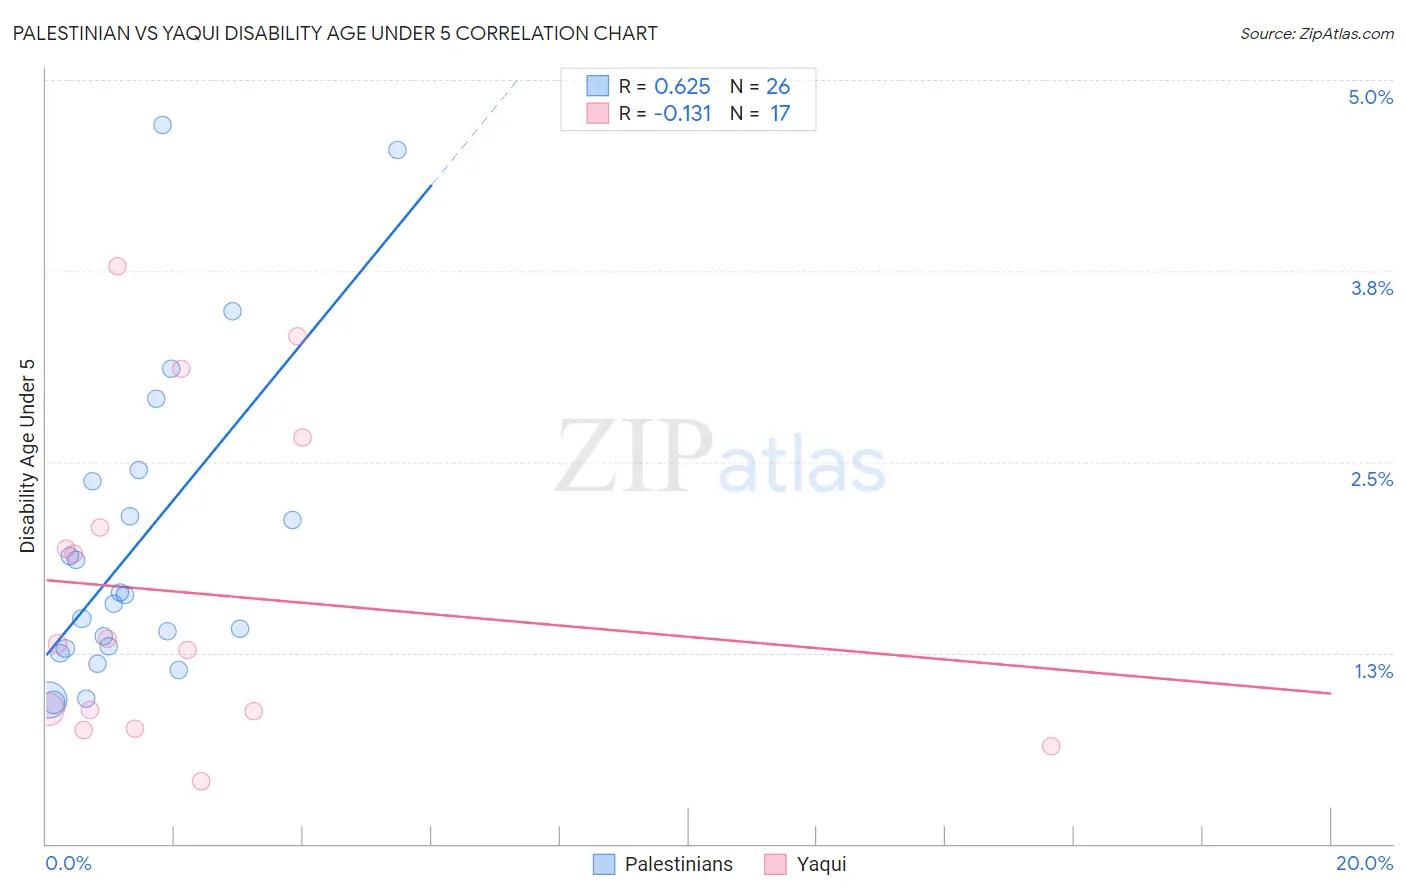
Palestinian vs Yaqui Disability Age Under 5 Correlation Chart
The statistical analysis conducted on geographies consisting of 140,188,705 people shows a significant positive correlation between the proportion of Palestinians and percentage of population with a disability under the age of 5 in the United States with a correlation coefficient (R) of 0.625 and weighted average of 1.2%. Similarly, the statistical analysis conducted on geographies consisting of 82,785,563 people shows a poor negative correlation between the proportion of Yaqui and percentage of population with a disability under the age of 5 in the United States with a correlation coefficient (R) of -0.131 and weighted average of 1.2%, a difference of 3.2%.
Disability Age Under 5 Correlation Summary
| Measurement | Palestinian | Yaqui |
| Minimum | 0.93% | 0.41% |
| Maximum | 4.7% | 3.8% |
| Range | 3.8% | 3.4% |
| Mean | 2.0% | 1.6% |
| Median | 1.6% | 1.3% |
| Interquartile 25% (IQ1) | 1.3% | 0.81% |
| Interquartile 75% (IQ3) | 2.4% | 2.4% |
| Interquartile Range (IQR) | 1.1% | 1.6% |
| Standard Deviation (Sample) | 1.0% | 1.0% |
| Standard Deviation (Population) | 1.0% | 1.0% |
Similar Demographics by Disability Age Under 5
Demographics Similar to Palestinians by Disability Age Under 5
In terms of disability age under 5, the demographic groups most similar to Palestinians are Immigrants from Saudi Arabia (1.2%, a difference of 0.020%), Immigrants from Western Africa (1.2%, a difference of 0.050%), Cuban (1.2%, a difference of 0.050%), Macedonian (1.2%, a difference of 0.060%), and Immigrants from Peru (1.2%, a difference of 0.060%).
| Demographics | Rating | Rank | Disability Age Under 5 |
| Comanche | 47.5 /100 | #177 | Average 1.2% |
| Venezuelans | 47.1 /100 | #178 | Average 1.2% |
| Immigrants | Bahamas | 45.2 /100 | #179 | Average 1.2% |
| Immigrants | Mexico | 44.4 /100 | #180 | Average 1.2% |
| Macedonians | 43.7 /100 | #181 | Average 1.2% |
| Immigrants | Peru | 43.7 /100 | #181 | Average 1.2% |
| Immigrants | Saudi Arabia | 43.3 /100 | #183 | Average 1.2% |
| Palestinians | 43.0 /100 | #184 | Average 1.2% |
| Immigrants | Western Africa | 42.5 /100 | #185 | Average 1.2% |
| Cubans | 42.5 /100 | #186 | Average 1.2% |
| Immigrants | Haiti | 40.2 /100 | #187 | Average 1.3% |
| Haitians | 39.9 /100 | #188 | Fair 1.3% |
| Peruvians | 37.6 /100 | #189 | Fair 1.3% |
| Immigrants | Laos | 36.6 /100 | #190 | Fair 1.3% |
| Mexican American Indians | 36.6 /100 | #191 | Fair 1.3% |
Demographics Similar to Yaqui by Disability Age Under 5
In terms of disability age under 5, the demographic groups most similar to Yaqui are South American (1.2%, a difference of 0.10%), Kenyan (1.2%, a difference of 0.14%), Ghanaian (1.2%, a difference of 0.19%), Icelander (1.2%, a difference of 0.20%), and Honduran (1.2%, a difference of 0.28%).
| Demographics | Rating | Rank | Disability Age Under 5 |
| Immigrants | Middle Africa | 79.3 /100 | #144 | Good 1.2% |
| Immigrants | Zimbabwe | 77.9 /100 | #145 | Good 1.2% |
| Samoans | 77.7 /100 | #146 | Good 1.2% |
| Icelanders | 76.3 /100 | #147 | Good 1.2% |
| Ghanaians | 76.3 /100 | #148 | Good 1.2% |
| Kenyans | 75.9 /100 | #149 | Good 1.2% |
| South Americans | 75.6 /100 | #150 | Good 1.2% |
| Yaqui | 74.8 /100 | #151 | Good 1.2% |
| Hondurans | 72.5 /100 | #152 | Good 1.2% |
| Immigrants | Thailand | 69.4 /100 | #153 | Good 1.2% |
| Uruguayans | 68.8 /100 | #154 | Good 1.2% |
| Immigrants | Ghana | 68.7 /100 | #155 | Good 1.2% |
| Hawaiians | 68.5 /100 | #156 | Good 1.2% |
| Immigrants | South America | 67.0 /100 | #157 | Good 1.2% |
| Arabs | 66.4 /100 | #158 | Good 1.2% |