Palestinian vs Immigrants from Sweden Disability Age Under 5
COMPARE
Palestinian
Immigrants from Sweden
Disability Age Under 5
Disability Age Under 5 Comparison
Palestinians
Immigrants from Sweden
1.2%
DISABILITY AGE UNDER 5
43.0/ 100
METRIC RATING
184th/ 347
METRIC RANK
1.1%
DISABILITY AGE UNDER 5
99.8/ 100
METRIC RATING
47th/ 347
METRIC RANK
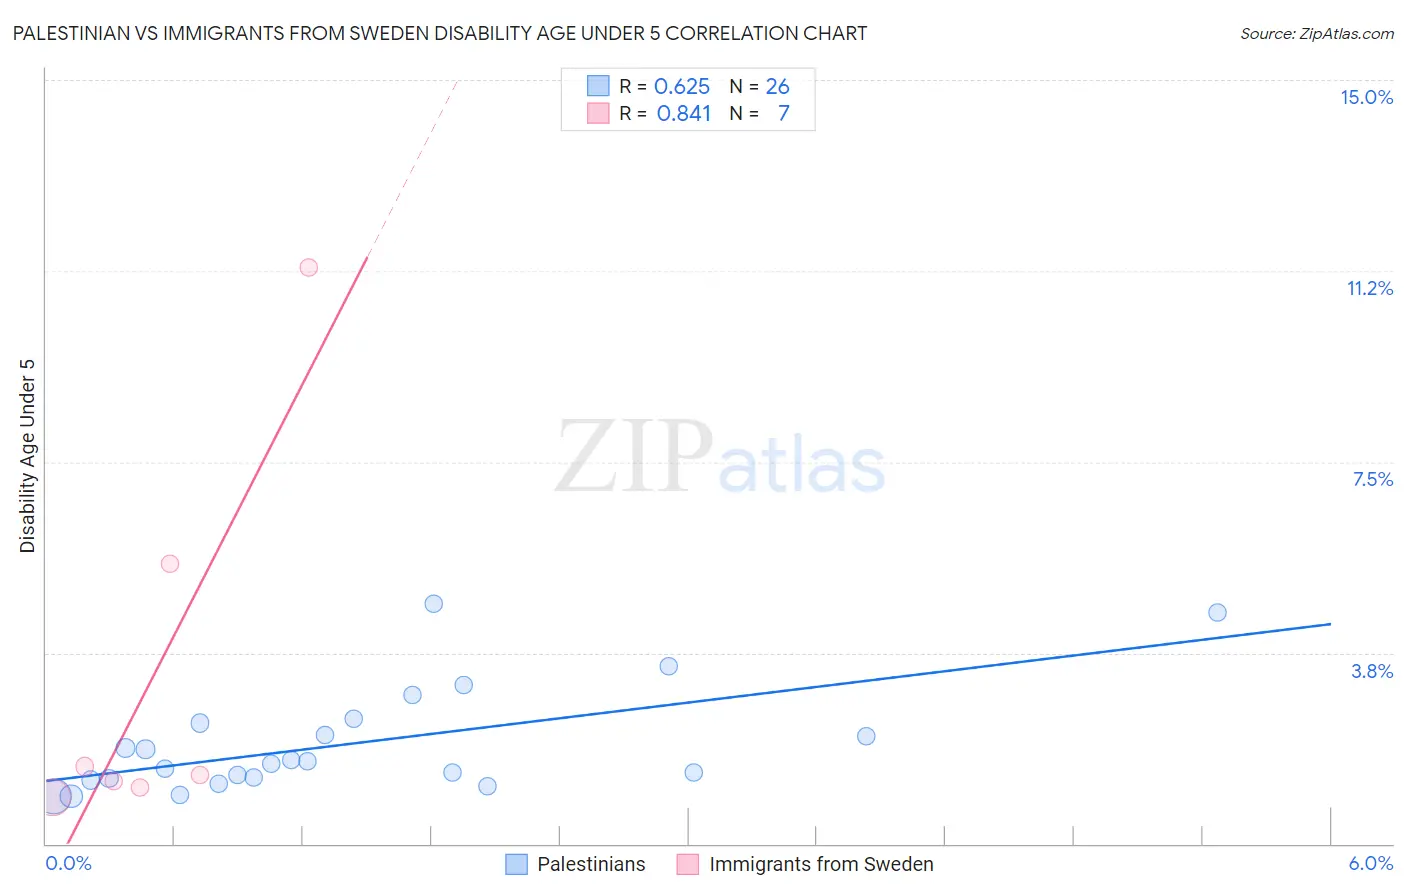
Palestinian vs Immigrants from Sweden Disability Age Under 5 Correlation Chart
The statistical analysis conducted on geographies consisting of 140,188,705 people shows a significant positive correlation between the proportion of Palestinians and percentage of population with a disability under the age of 5 in the United States with a correlation coefficient (R) of 0.625 and weighted average of 1.2%. Similarly, the statistical analysis conducted on geographies consisting of 109,268,889 people shows a very strong positive correlation between the proportion of Immigrants from Sweden and percentage of population with a disability under the age of 5 in the United States with a correlation coefficient (R) of 0.841 and weighted average of 1.1%, a difference of 16.6%.
Disability Age Under 5 Correlation Summary
| Measurement | Palestinian | Immigrants from Sweden |
| Minimum | 0.93% | 0.92% |
| Maximum | 4.7% | 11.3% |
| Range | 3.8% | 10.4% |
| Mean | 2.0% | 3.3% |
| Median | 1.6% | 1.4% |
| Interquartile 25% (IQ1) | 1.3% | 1.1% |
| Interquartile 75% (IQ3) | 2.4% | 5.5% |
| Interquartile Range (IQR) | 1.1% | 4.4% |
| Standard Deviation (Sample) | 1.0% | 3.9% |
| Standard Deviation (Population) | 1.0% | 3.6% |
Similar Demographics by Disability Age Under 5
Demographics Similar to Palestinians by Disability Age Under 5
In terms of disability age under 5, the demographic groups most similar to Palestinians are Immigrants from Saudi Arabia (1.2%, a difference of 0.020%), Immigrants from Western Africa (1.2%, a difference of 0.050%), Cuban (1.2%, a difference of 0.050%), Macedonian (1.2%, a difference of 0.060%), and Immigrants from Peru (1.2%, a difference of 0.060%).
| Demographics | Rating | Rank | Disability Age Under 5 |
| Comanche | 47.5 /100 | #177 | Average 1.2% |
| Venezuelans | 47.1 /100 | #178 | Average 1.2% |
| Immigrants | Bahamas | 45.2 /100 | #179 | Average 1.2% |
| Immigrants | Mexico | 44.4 /100 | #180 | Average 1.2% |
| Macedonians | 43.7 /100 | #181 | Average 1.2% |
| Immigrants | Peru | 43.7 /100 | #181 | Average 1.2% |
| Immigrants | Saudi Arabia | 43.3 /100 | #183 | Average 1.2% |
| Palestinians | 43.0 /100 | #184 | Average 1.2% |
| Immigrants | Western Africa | 42.5 /100 | #185 | Average 1.2% |
| Cubans | 42.5 /100 | #186 | Average 1.2% |
| Immigrants | Haiti | 40.2 /100 | #187 | Average 1.3% |
| Haitians | 39.9 /100 | #188 | Fair 1.3% |
| Peruvians | 37.6 /100 | #189 | Fair 1.3% |
| Immigrants | Laos | 36.6 /100 | #190 | Fair 1.3% |
| Mexican American Indians | 36.6 /100 | #191 | Fair 1.3% |
Demographics Similar to Immigrants from Sweden by Disability Age Under 5
In terms of disability age under 5, the demographic groups most similar to Immigrants from Sweden are Immigrants from Congo (1.1%, a difference of 0.14%), Immigrants from Singapore (1.1%, a difference of 0.22%), Immigrants from Russia (1.1%, a difference of 0.43%), Immigrants from Japan (1.1%, a difference of 0.44%), and Immigrants from Turkey (1.1%, a difference of 0.54%).
| Demographics | Rating | Rank | Disability Age Under 5 |
| Immigrants | Albania | 99.9 /100 | #40 | Exceptional 1.1% |
| Thais | 99.8 /100 | #41 | Exceptional 1.1% |
| Immigrants | Bulgaria | 99.8 /100 | #42 | Exceptional 1.1% |
| Pima | 99.8 /100 | #43 | Exceptional 1.1% |
| Immigrants | Asia | 99.8 /100 | #44 | Exceptional 1.1% |
| Immigrants | Turkey | 99.8 /100 | #45 | Exceptional 1.1% |
| Immigrants | Congo | 99.8 /100 | #46 | Exceptional 1.1% |
| Immigrants | Sweden | 99.8 /100 | #47 | Exceptional 1.1% |
| Immigrants | Singapore | 99.7 /100 | #48 | Exceptional 1.1% |
| Immigrants | Russia | 99.7 /100 | #49 | Exceptional 1.1% |
| Immigrants | Japan | 99.7 /100 | #50 | Exceptional 1.1% |
| Immigrants | Kazakhstan | 99.7 /100 | #51 | Exceptional 1.1% |
| Immigrants | Bolivia | 99.6 /100 | #52 | Exceptional 1.1% |
| Asians | 99.6 /100 | #53 | Exceptional 1.1% |
| Immigrants | El Salvador | 99.6 /100 | #54 | Exceptional 1.1% |