Italian vs Navajo Disability
COMPARE
Italian
Navajo
Disability
Disability Comparison
Italians
Navajo
12.2%
DISABILITY
2.5/ 100
METRIC RATING
232nd/ 347
METRIC RANK
14.3%
DISABILITY
0.0/ 100
METRIC RATING
330th/ 347
METRIC RANK
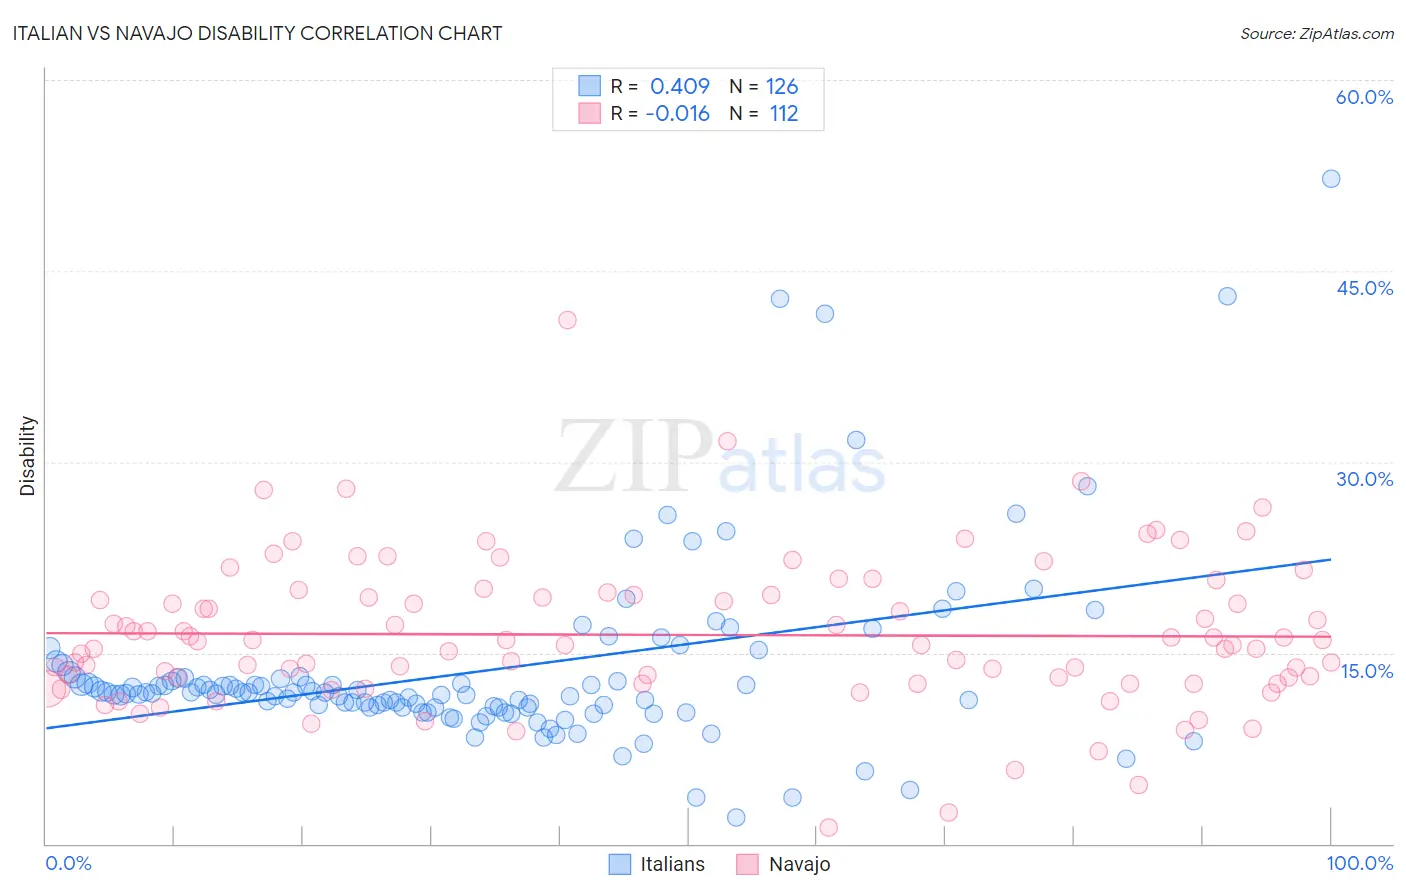
Italian vs Navajo Disability Correlation Chart
The statistical analysis conducted on geographies consisting of 574,930,842 people shows a moderate positive correlation between the proportion of Italians and percentage of population with a disability in the United States with a correlation coefficient (R) of 0.409 and weighted average of 12.2%. Similarly, the statistical analysis conducted on geographies consisting of 224,790,018 people shows no correlation between the proportion of Navajo and percentage of population with a disability in the United States with a correlation coefficient (R) of -0.016 and weighted average of 14.3%, a difference of 17.2%.
Disability Correlation Summary
| Measurement | Italian | Navajo |
| Minimum | 2.1% | 1.3% |
| Maximum | 52.3% | 41.2% |
| Range | 50.2% | 39.9% |
| Mean | 13.5% | 16.4% |
| Median | 11.8% | 15.8% |
| Interquartile 25% (IQ1) | 10.7% | 12.8% |
| Interquartile 75% (IQ3) | 13.0% | 19.5% |
| Interquartile Range (IQR) | 2.3% | 6.7% |
| Standard Deviation (Sample) | 7.3% | 5.9% |
| Standard Deviation (Population) | 7.2% | 5.8% |
Similar Demographics by Disability
Demographics Similar to Italians by Disability
In terms of disability, the demographic groups most similar to Italians are Malaysian (12.2%, a difference of 0.010%), Samoan (12.2%, a difference of 0.040%), Bahamian (12.2%, a difference of 0.090%), Inupiat (12.2%, a difference of 0.12%), and Japanese (12.2%, a difference of 0.12%).
| Demographics | Rating | Rank | Disability |
| Senegalese | 3.5 /100 | #225 | Tragic 12.1% |
| Jamaicans | 3.3 /100 | #226 | Tragic 12.1% |
| Alsatians | 3.3 /100 | #227 | Tragic 12.1% |
| West Indians | 2.9 /100 | #228 | Tragic 12.2% |
| Inupiat | 2.8 /100 | #229 | Tragic 12.2% |
| Samoans | 2.6 /100 | #230 | Tragic 12.2% |
| Malaysians | 2.5 /100 | #231 | Tragic 12.2% |
| Italians | 2.5 /100 | #232 | Tragic 12.2% |
| Bahamians | 2.3 /100 | #233 | Tragic 12.2% |
| Japanese | 2.3 /100 | #234 | Tragic 12.2% |
| Yup'ik | 2.2 /100 | #235 | Tragic 12.2% |
| Chinese | 2.0 /100 | #236 | Tragic 12.2% |
| Immigrants | Congo | 1.9 /100 | #237 | Tragic 12.2% |
| Norwegians | 1.9 /100 | #238 | Tragic 12.2% |
| Swedes | 1.8 /100 | #239 | Tragic 12.2% |
Demographics Similar to Navajo by Disability
In terms of disability, the demographic groups most similar to Navajo are Potawatomi (14.2%, a difference of 0.59%), Ottawa (14.2%, a difference of 0.71%), Immigrants from the Azores (14.2%, a difference of 0.71%), Osage (14.2%, a difference of 0.73%), and Native/Alaskan (14.2%, a difference of 0.76%).
| Demographics | Rating | Rank | Disability |
| Comanche | 0.0 /100 | #323 | Tragic 14.1% |
| Chippewa | 0.0 /100 | #324 | Tragic 14.1% |
| Natives/Alaskans | 0.0 /100 | #325 | Tragic 14.2% |
| Osage | 0.0 /100 | #326 | Tragic 14.2% |
| Ottawa | 0.0 /100 | #327 | Tragic 14.2% |
| Immigrants | Azores | 0.0 /100 | #328 | Tragic 14.2% |
| Potawatomi | 0.0 /100 | #329 | Tragic 14.2% |
| Navajo | 0.0 /100 | #330 | Tragic 14.3% |
| Alaskan Athabascans | 0.0 /100 | #331 | Tragic 14.4% |
| Pueblo | 0.0 /100 | #332 | Tragic 14.4% |
| Cajuns | 0.0 /100 | #333 | Tragic 14.6% |
| Yuman | 0.0 /100 | #334 | Tragic 14.6% |
| Tohono O'odham | 0.0 /100 | #335 | Tragic 14.8% |
| Cherokee | 0.0 /100 | #336 | Tragic 14.8% |
| Seminole | 0.0 /100 | #337 | Tragic 14.9% |