Italian vs Samoan Disability
COMPARE
Italian
Samoan
Disability
Disability Comparison
Italians
Samoans
12.2%
DISABILITY
2.5/ 100
METRIC RATING
232nd/ 347
METRIC RANK
12.2%
DISABILITY
2.6/ 100
METRIC RATING
230th/ 347
METRIC RANK
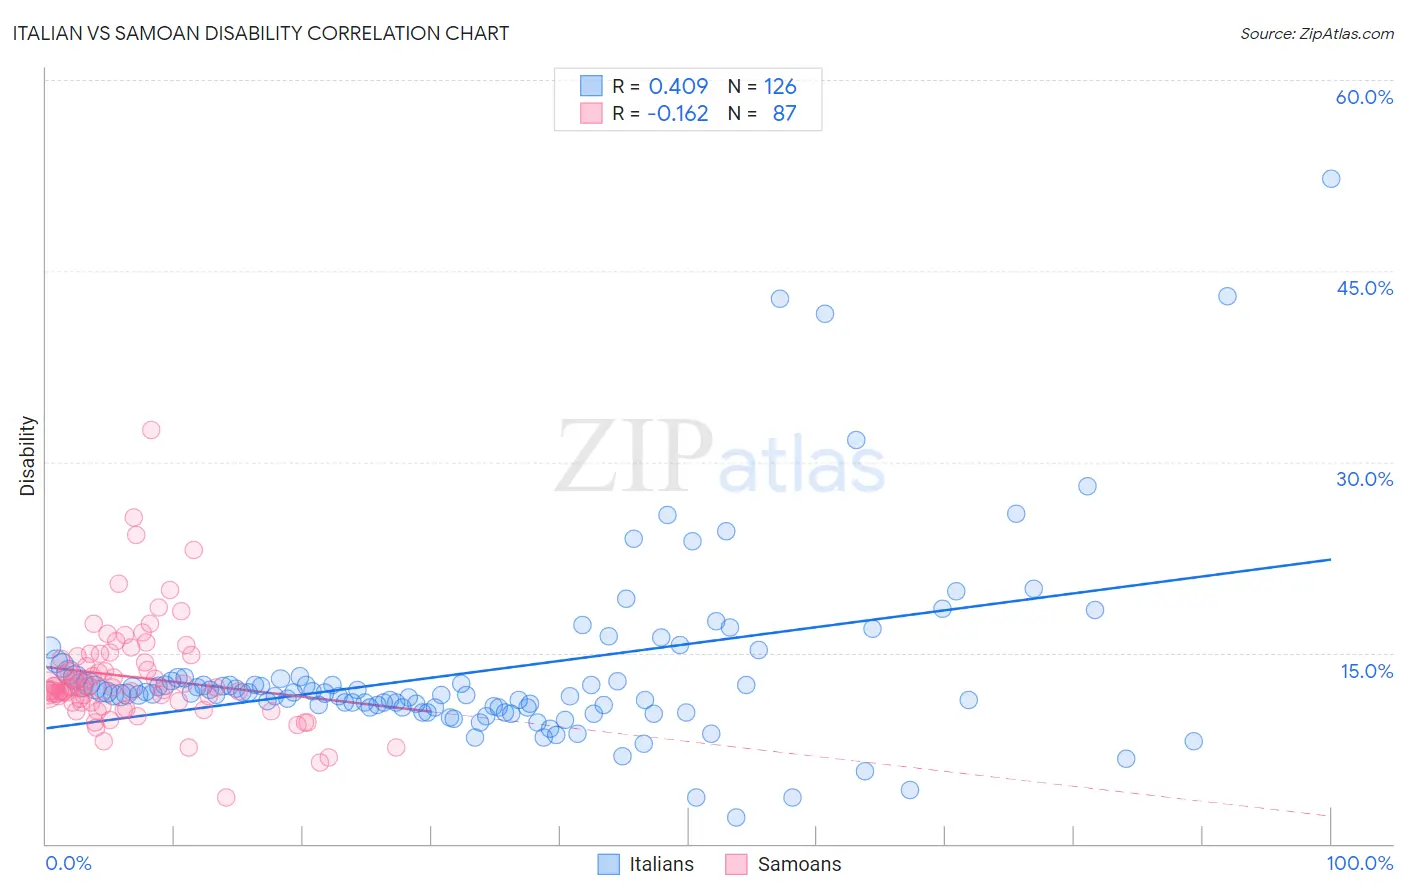
Italian vs Samoan Disability Correlation Chart
The statistical analysis conducted on geographies consisting of 574,930,842 people shows a moderate positive correlation between the proportion of Italians and percentage of population with a disability in the United States with a correlation coefficient (R) of 0.409 and weighted average of 12.2%. Similarly, the statistical analysis conducted on geographies consisting of 225,125,318 people shows a poor negative correlation between the proportion of Samoans and percentage of population with a disability in the United States with a correlation coefficient (R) of -0.162 and weighted average of 12.2%, a difference of 0.040%.
Disability Correlation Summary
| Measurement | Italian | Samoan |
| Minimum | 2.1% | 3.6% |
| Maximum | 52.3% | 32.5% |
| Range | 50.2% | 28.8% |
| Mean | 13.5% | 13.1% |
| Median | 11.8% | 12.3% |
| Interquartile 25% (IQ1) | 10.7% | 11.1% |
| Interquartile 75% (IQ3) | 13.0% | 14.7% |
| Interquartile Range (IQR) | 2.3% | 3.6% |
| Standard Deviation (Sample) | 7.3% | 4.1% |
| Standard Deviation (Population) | 7.2% | 4.1% |
Demographics Similar to Italians and Samoans by Disability
In terms of disability, the demographic groups most similar to Italians are Malaysian (12.2%, a difference of 0.010%), Bahamian (12.2%, a difference of 0.090%), Inupiat (12.2%, a difference of 0.12%), Japanese (12.2%, a difference of 0.12%), and West Indian (12.2%, a difference of 0.14%). Similarly, the demographic groups most similar to Samoans are Malaysian (12.2%, a difference of 0.030%), Inupiat (12.2%, a difference of 0.080%), West Indian (12.2%, a difference of 0.10%), Bahamian (12.2%, a difference of 0.13%), and Japanese (12.2%, a difference of 0.16%).
| Demographics | Rating | Rank | Disability |
| Northern Europeans | 4.2 /100 | #221 | Tragic 12.1% |
| Spanish American Indians | 4.1 /100 | #222 | Tragic 12.1% |
| Hispanics or Latinos | 3.9 /100 | #223 | Tragic 12.1% |
| Mexicans | 3.7 /100 | #224 | Tragic 12.1% |
| Senegalese | 3.5 /100 | #225 | Tragic 12.1% |
| Jamaicans | 3.3 /100 | #226 | Tragic 12.1% |
| Alsatians | 3.3 /100 | #227 | Tragic 12.1% |
| West Indians | 2.9 /100 | #228 | Tragic 12.2% |
| Inupiat | 2.8 /100 | #229 | Tragic 12.2% |
| Samoans | 2.6 /100 | #230 | Tragic 12.2% |
| Malaysians | 2.5 /100 | #231 | Tragic 12.2% |
| Italians | 2.5 /100 | #232 | Tragic 12.2% |
| Bahamians | 2.3 /100 | #233 | Tragic 12.2% |
| Japanese | 2.3 /100 | #234 | Tragic 12.2% |
| Yup'ik | 2.2 /100 | #235 | Tragic 12.2% |
| Chinese | 2.0 /100 | #236 | Tragic 12.2% |
| Immigrants | Congo | 1.9 /100 | #237 | Tragic 12.2% |
| Norwegians | 1.9 /100 | #238 | Tragic 12.2% |
| Swedes | 1.8 /100 | #239 | Tragic 12.2% |
| Hungarians | 1.7 /100 | #240 | Tragic 12.2% |
| Yugoslavians | 1.7 /100 | #241 | Tragic 12.2% |