Immigrants from Poland vs Malaysian Disability
COMPARE
Immigrants from Poland
Malaysian
Disability
Disability Comparison
Immigrants from Poland
Malaysians
11.1%
DISABILITY
99.1/ 100
METRIC RATING
81st/ 347
METRIC RANK
12.2%
DISABILITY
2.5/ 100
METRIC RATING
231st/ 347
METRIC RANK
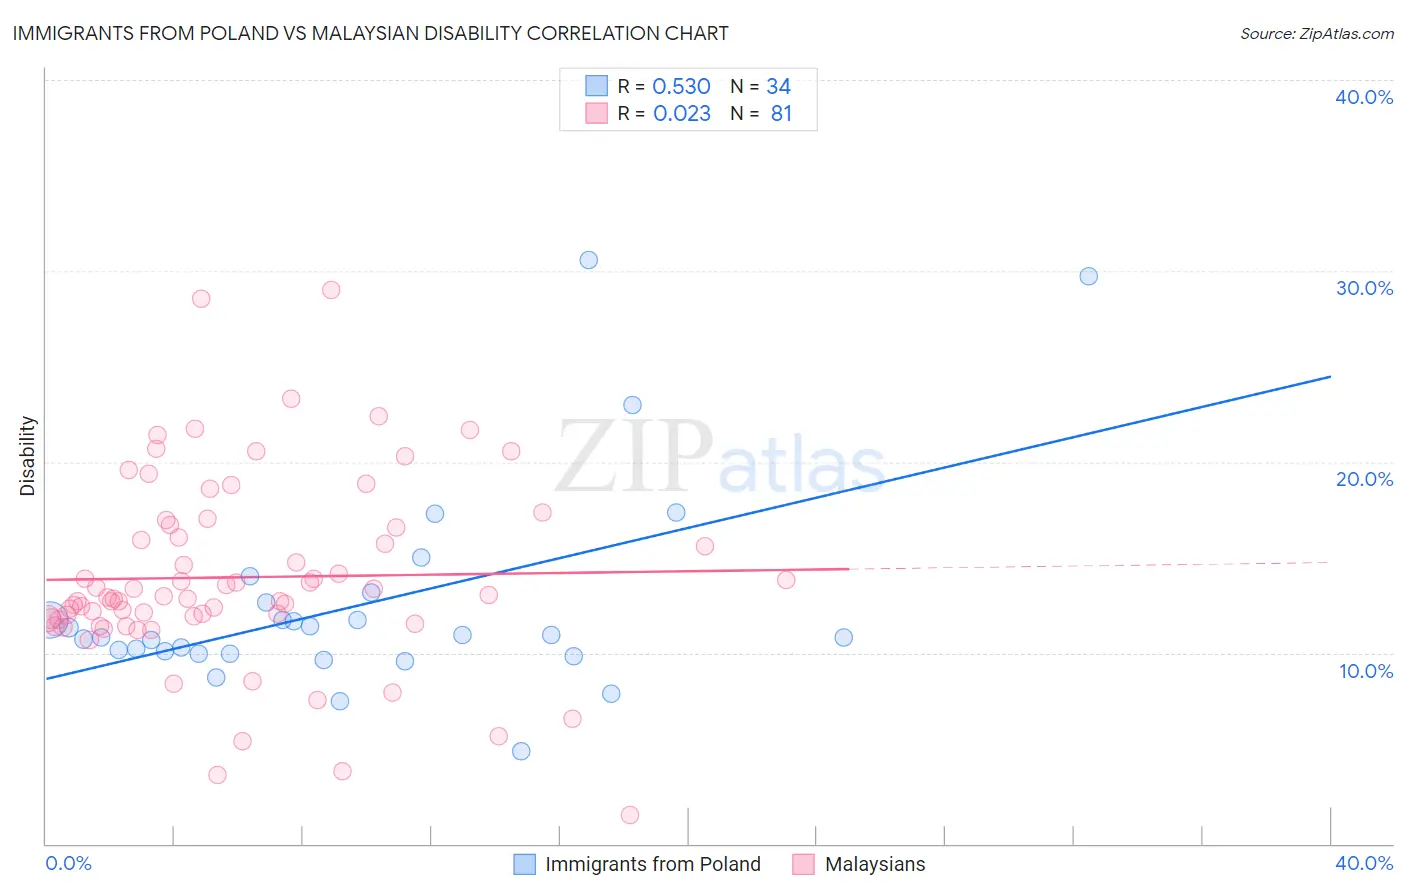
Immigrants from Poland vs Malaysian Disability Correlation Chart
The statistical analysis conducted on geographies consisting of 304,838,062 people shows a substantial positive correlation between the proportion of Immigrants from Poland and percentage of population with a disability in the United States with a correlation coefficient (R) of 0.530 and weighted average of 11.1%. Similarly, the statistical analysis conducted on geographies consisting of 226,067,054 people shows no correlation between the proportion of Malaysians and percentage of population with a disability in the United States with a correlation coefficient (R) of 0.023 and weighted average of 12.2%, a difference of 9.7%.
Disability Correlation Summary
| Measurement | Immigrants from Poland | Malaysian |
| Minimum | 4.8% | 1.5% |
| Maximum | 30.6% | 29.0% |
| Range | 25.7% | 27.5% |
| Mean | 12.5% | 14.0% |
| Median | 10.9% | 12.9% |
| Interquartile 25% (IQ1) | 10.0% | 11.8% |
| Interquartile 75% (IQ3) | 12.6% | 16.6% |
| Interquartile Range (IQR) | 2.7% | 4.9% |
| Standard Deviation (Sample) | 5.5% | 5.0% |
| Standard Deviation (Population) | 5.4% | 4.9% |
Similar Demographics by Disability
Demographics Similar to Immigrants from Poland by Disability
In terms of disability, the demographic groups most similar to Immigrants from Poland are Chilean (11.1%, a difference of 0.050%), Immigrants from Switzerland (11.1%, a difference of 0.080%), Immigrants from Sierra Leone (11.1%, a difference of 0.090%), Immigrants from Belarus (11.1%, a difference of 0.24%), and Immigrants from Russia (11.1%, a difference of 0.24%).
| Demographics | Rating | Rank | Disability |
| Immigrants | Serbia | 99.4 /100 | #74 | Exceptional 11.0% |
| Immigrants | Vietnam | 99.4 /100 | #75 | Exceptional 11.0% |
| Sierra Leoneans | 99.3 /100 | #76 | Exceptional 11.0% |
| Immigrants | Belgium | 99.3 /100 | #77 | Exceptional 11.0% |
| Immigrants | Cameroon | 99.3 /100 | #78 | Exceptional 11.1% |
| Immigrants | Jordan | 99.3 /100 | #79 | Exceptional 11.1% |
| Immigrants | Ireland | 99.3 /100 | #80 | Exceptional 11.1% |
| Immigrants | Poland | 99.1 /100 | #81 | Exceptional 11.1% |
| Chileans | 99.1 /100 | #82 | Exceptional 11.1% |
| Immigrants | Switzerland | 99.0 /100 | #83 | Exceptional 11.1% |
| Immigrants | Sierra Leone | 99.0 /100 | #84 | Exceptional 11.1% |
| Immigrants | Belarus | 98.9 /100 | #85 | Exceptional 11.1% |
| Immigrants | Russia | 98.9 /100 | #86 | Exceptional 11.1% |
| Palestinians | 98.9 /100 | #87 | Exceptional 11.1% |
| Immigrants | Romania | 98.5 /100 | #88 | Exceptional 11.2% |
Demographics Similar to Malaysians by Disability
In terms of disability, the demographic groups most similar to Malaysians are Italian (12.2%, a difference of 0.010%), Samoan (12.2%, a difference of 0.030%), Bahamian (12.2%, a difference of 0.10%), Inupiat (12.2%, a difference of 0.11%), and West Indian (12.2%, a difference of 0.13%).
| Demographics | Rating | Rank | Disability |
| Mexicans | 3.7 /100 | #224 | Tragic 12.1% |
| Senegalese | 3.5 /100 | #225 | Tragic 12.1% |
| Jamaicans | 3.3 /100 | #226 | Tragic 12.1% |
| Alsatians | 3.3 /100 | #227 | Tragic 12.1% |
| West Indians | 2.9 /100 | #228 | Tragic 12.2% |
| Inupiat | 2.8 /100 | #229 | Tragic 12.2% |
| Samoans | 2.6 /100 | #230 | Tragic 12.2% |
| Malaysians | 2.5 /100 | #231 | Tragic 12.2% |
| Italians | 2.5 /100 | #232 | Tragic 12.2% |
| Bahamians | 2.3 /100 | #233 | Tragic 12.2% |
| Japanese | 2.3 /100 | #234 | Tragic 12.2% |
| Yup'ik | 2.2 /100 | #235 | Tragic 12.2% |
| Chinese | 2.0 /100 | #236 | Tragic 12.2% |
| Immigrants | Congo | 1.9 /100 | #237 | Tragic 12.2% |
| Norwegians | 1.9 /100 | #238 | Tragic 12.2% |