Immigrants from Poland vs Creek Disability
COMPARE
Immigrants from Poland
Creek
Disability
Disability Comparison
Immigrants from Poland
Creek
11.1%
DISABILITY
99.1/ 100
METRIC RATING
81st/ 347
METRIC RANK
15.6%
DISABILITY
0.0/ 100
METRIC RATING
343rd/ 347
METRIC RANK
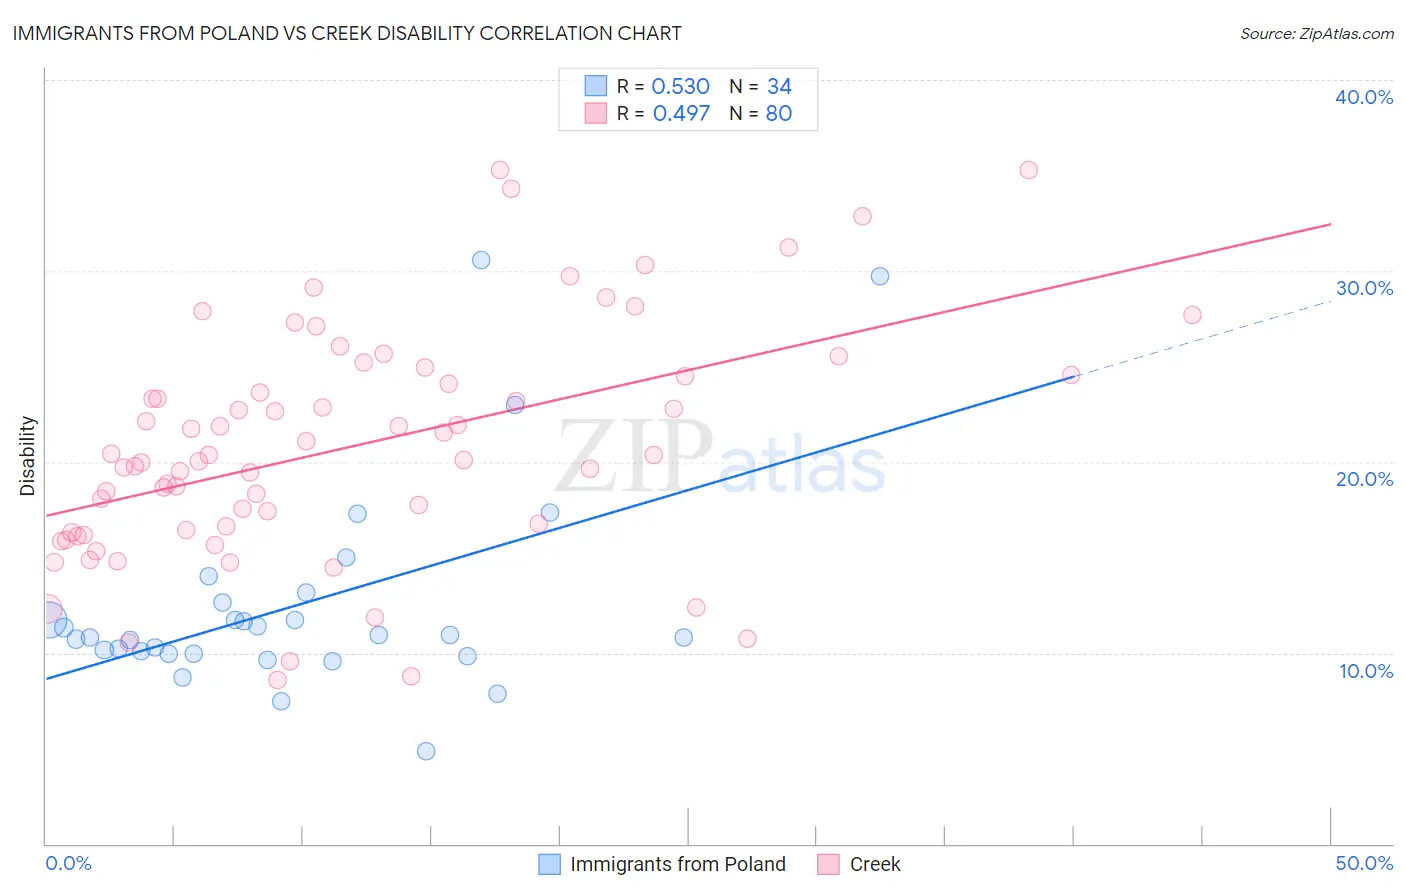
Immigrants from Poland vs Creek Disability Correlation Chart
The statistical analysis conducted on geographies consisting of 304,838,062 people shows a substantial positive correlation between the proportion of Immigrants from Poland and percentage of population with a disability in the United States with a correlation coefficient (R) of 0.530 and weighted average of 11.1%. Similarly, the statistical analysis conducted on geographies consisting of 178,460,797 people shows a moderate positive correlation between the proportion of Creek and percentage of population with a disability in the United States with a correlation coefficient (R) of 0.497 and weighted average of 15.6%, a difference of 40.6%.
Disability Correlation Summary
| Measurement | Immigrants from Poland | Creek |
| Minimum | 4.8% | 8.6% |
| Maximum | 30.6% | 35.3% |
| Range | 25.7% | 26.7% |
| Mean | 12.5% | 20.8% |
| Median | 10.9% | 20.2% |
| Interquartile 25% (IQ1) | 10.0% | 16.4% |
| Interquartile 75% (IQ3) | 12.6% | 24.5% |
| Interquartile Range (IQR) | 2.7% | 8.1% |
| Standard Deviation (Sample) | 5.5% | 6.1% |
| Standard Deviation (Population) | 5.4% | 6.0% |
Similar Demographics by Disability
Demographics Similar to Immigrants from Poland by Disability
In terms of disability, the demographic groups most similar to Immigrants from Poland are Chilean (11.1%, a difference of 0.050%), Immigrants from Switzerland (11.1%, a difference of 0.080%), Immigrants from Sierra Leone (11.1%, a difference of 0.090%), Immigrants from Belarus (11.1%, a difference of 0.24%), and Immigrants from Russia (11.1%, a difference of 0.24%).
| Demographics | Rating | Rank | Disability |
| Immigrants | Serbia | 99.4 /100 | #74 | Exceptional 11.0% |
| Immigrants | Vietnam | 99.4 /100 | #75 | Exceptional 11.0% |
| Sierra Leoneans | 99.3 /100 | #76 | Exceptional 11.0% |
| Immigrants | Belgium | 99.3 /100 | #77 | Exceptional 11.0% |
| Immigrants | Cameroon | 99.3 /100 | #78 | Exceptional 11.1% |
| Immigrants | Jordan | 99.3 /100 | #79 | Exceptional 11.1% |
| Immigrants | Ireland | 99.3 /100 | #80 | Exceptional 11.1% |
| Immigrants | Poland | 99.1 /100 | #81 | Exceptional 11.1% |
| Chileans | 99.1 /100 | #82 | Exceptional 11.1% |
| Immigrants | Switzerland | 99.0 /100 | #83 | Exceptional 11.1% |
| Immigrants | Sierra Leone | 99.0 /100 | #84 | Exceptional 11.1% |
| Immigrants | Belarus | 98.9 /100 | #85 | Exceptional 11.1% |
| Immigrants | Russia | 98.9 /100 | #86 | Exceptional 11.1% |
| Palestinians | 98.9 /100 | #87 | Exceptional 11.1% |
| Immigrants | Romania | 98.5 /100 | #88 | Exceptional 11.2% |
Demographics Similar to Creek by Disability
In terms of disability, the demographic groups most similar to Creek are Kiowa (15.6%, a difference of 0.010%), Lumbee (15.5%, a difference of 0.47%), Colville (15.8%, a difference of 1.2%), Choctaw (15.4%, a difference of 1.3%), and Chickasaw (15.2%, a difference of 2.8%).
| Demographics | Rating | Rank | Disability |
| Cajuns | 0.0 /100 | #333 | Tragic 14.6% |
| Yuman | 0.0 /100 | #334 | Tragic 14.6% |
| Tohono O'odham | 0.0 /100 | #335 | Tragic 14.8% |
| Cherokee | 0.0 /100 | #336 | Tragic 14.8% |
| Seminole | 0.0 /100 | #337 | Tragic 14.9% |
| Dutch West Indians | 0.0 /100 | #338 | Tragic 14.9% |
| Chickasaw | 0.0 /100 | #339 | Tragic 15.2% |
| Choctaw | 0.0 /100 | #340 | Tragic 15.4% |
| Lumbee | 0.0 /100 | #341 | Tragic 15.5% |
| Kiowa | 0.0 /100 | #342 | Tragic 15.6% |
| Creek | 0.0 /100 | #343 | Tragic 15.6% |
| Colville | 0.0 /100 | #344 | Tragic 15.8% |
| Puerto Ricans | 0.0 /100 | #345 | Tragic 16.1% |
| Tsimshian | 0.0 /100 | #346 | Tragic 16.1% |
| Houma | 0.0 /100 | #347 | Tragic 17.1% |