Immigrants from Yemen Female Disability
COMPARE
Immigrants from Yemen
Select to Compare
Female Disability
Immigrants from Yemen Female Disability
13.2%
DISABILITY | FEMALES
0.0/ 100
METRIC RATING
290th/ 347
METRIC RANK
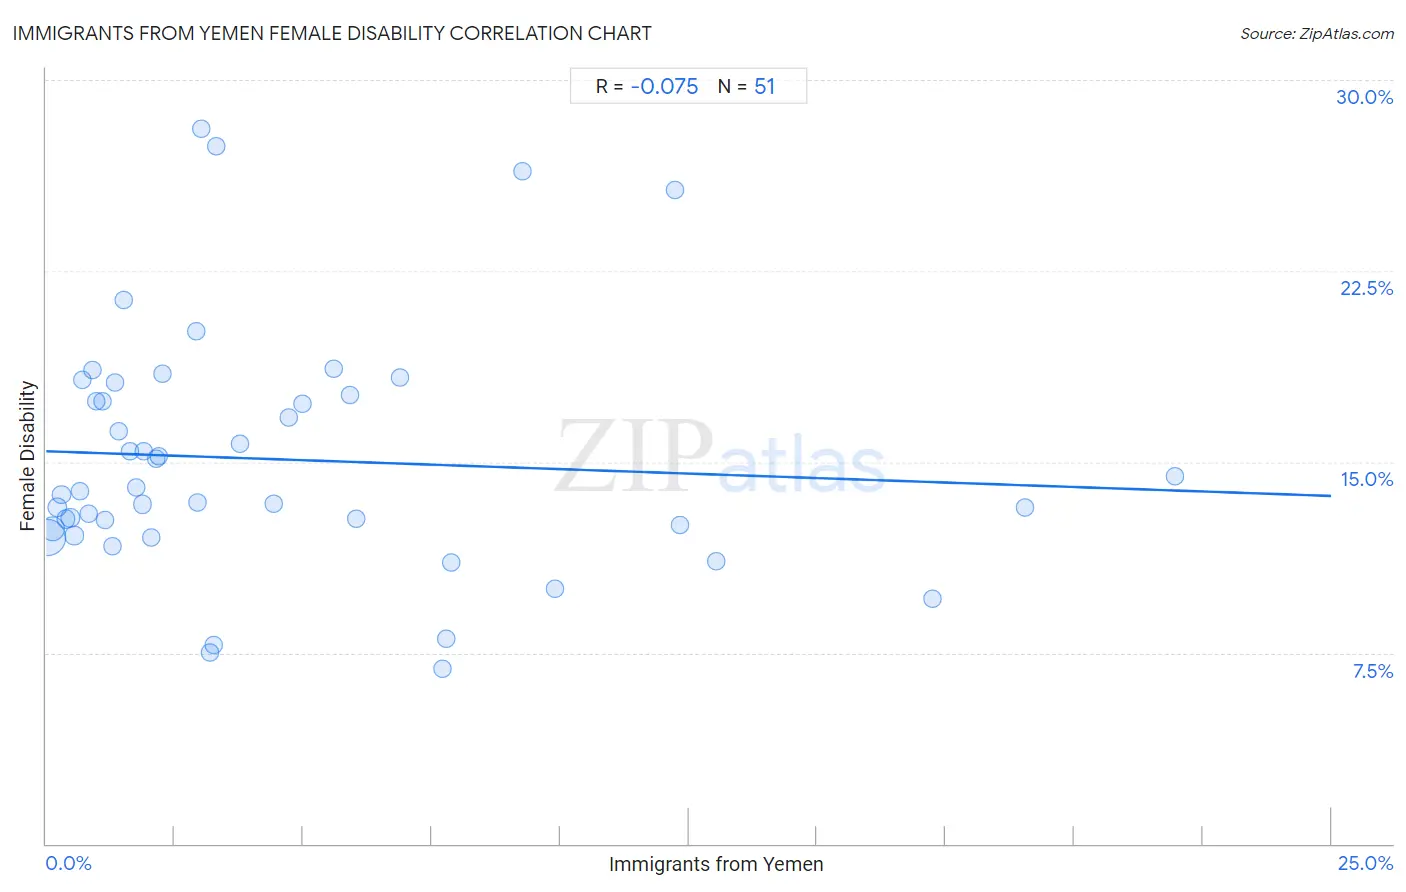
Immigrants from Yemen Female Disability Correlation Chart
The statistical analysis conducted on geographies consisting of 82,433,611 people shows a slight negative correlation between the proportion of Immigrants from Yemen and percentage of females with a disability in the United States with a correlation coefficient (R) of -0.075 and weighted average of 13.2%. On average, for every 1% (one percent) increase in Immigrants from Yemen within a typical geography, there is a decrease of 0.070% in percentage of females with a disability.
It is essential to understand that the correlation between the percentage of Immigrants from Yemen and percentage of females with a disability does not imply a direct cause-and-effect relationship. It remains uncertain whether the presence of Immigrants from Yemen influences an upward or downward trend in the level of percentage of females with a disability within an area, or if Immigrants from Yemen simply ended up residing in those areas with higher or lower levels of percentage of females with a disability due to other factors.
Demographics Similar to Immigrants from Yemen by Female Disability
In terms of female disability, the demographic groups most similar to Immigrants from Yemen are Tlingit-Haida (13.2%, a difference of 0.0%), Shoshone (13.2%, a difference of 0.060%), White/Caucasian (13.2%, a difference of 0.18%), Yakama (13.2%, a difference of 0.23%), and Yaqui (13.2%, a difference of 0.27%).
| Demographics | Rating | Rank | Female Disability |
| English | 0.0 /100 | #283 | Tragic 13.1% |
| Hmong | 0.0 /100 | #284 | Tragic 13.1% |
| Bangladeshis | 0.0 /100 | #285 | Tragic 13.1% |
| Fijians | 0.0 /100 | #286 | Tragic 13.1% |
| Yaqui | 0.0 /100 | #287 | Tragic 13.2% |
| Whites/Caucasians | 0.0 /100 | #288 | Tragic 13.2% |
| Tlingit-Haida | 0.0 /100 | #289 | Tragic 13.2% |
| Immigrants from Yemen | 0.0 /100 | #290 | Tragic 13.2% |
| Shoshone | 0.0 /100 | #291 | Tragic 13.2% |
| Yakama | 0.0 /100 | #292 | Tragic 13.2% |
| Marshallese | 0.0 /100 | #293 | Tragic 13.3% |
| Celtics | 0.0 /100 | #294 | Tragic 13.3% |
| French | 0.0 /100 | #295 | Tragic 13.3% |
| Nepalese | 0.0 /100 | #296 | Tragic 13.3% |
| Slovaks | 0.0 /100 | #297 | Tragic 13.3% |
Immigrants from Yemen Female Disability Correlation Summary
| Measurement | Immigrants from Yemen Data | Female Disability Data |
| Minimum | 0.021% | 6.9% |
| Maximum | 22.0% | 28.1% |
| Range | 21.9% | 21.2% |
| Mean | 4.5% | 15.1% |
| Median | 2.3% | 13.9% |
| Interquartile 25% (IQ1) | 1.1% | 12.4% |
| Interquartile 75% (IQ3) | 6.0% | 17.6% |
| Interquartile Range (IQR) | 4.9% | 5.2% |
| Standard Deviation (Sample) | 5.1% | 4.8% |
| Standard Deviation (Population) | 5.0% | 4.7% |
Correlation Details
| Immigrants from Yemen Percentile | Sample Size | Female Disability |
[ 0.0% - 0.5% ] 0.021% | 52,178,584 | 12.0% |
[ 0.0% - 0.5% ] 0.12% | 17,218,052 | 12.4% |
[ 0.0% - 0.5% ] 0.21% | 4,583,174 | 13.2% |
[ 0.0% - 0.5% ] 0.29% | 2,107,407 | 13.7% |
[ 0.0% - 0.5% ] 0.38% | 1,744,676 | 12.7% |
[ 0.0% - 0.5% ] 0.46% | 1,571,858 | 12.8% |
[ 0.5% - 1.0% ] 0.55% | 507,712 | 12.1% |
[ 0.5% - 1.0% ] 0.66% | 280,364 | 13.9% |
[ 0.5% - 1.0% ] 0.70% | 897,069 | 18.2% |
[ 0.5% - 1.0% ] 0.82% | 228,654 | 13.0% |
[ 0.5% - 1.0% ] 0.89% | 77,809 | 18.6% |
[ 0.5% - 1.0% ] 0.97% | 127,787 | 17.4% |
[ 1.0% - 1.5% ] 1.09% | 49,141 | 17.4% |
[ 1.0% - 1.5% ] 1.13% | 66,881 | 12.7% |
[ 1.0% - 1.5% ] 1.28% | 702 | 11.7% |
[ 1.0% - 1.5% ] 1.33% | 17,992 | 18.1% |
[ 1.0% - 1.5% ] 1.42% | 78,750 | 16.2% |
[ 1.0% - 1.5% ] 1.50% | 83,652 | 21.3% |
[ 1.5% - 2.0% ] 1.62% | 8,765 | 15.4% |
[ 1.5% - 2.0% ] 1.76% | 20,503 | 14.0% |
[ 1.5% - 2.0% ] 1.88% | 78,932 | 13.3% |
[ 1.5% - 2.0% ] 1.90% | 12,771 | 15.4% |
[ 2.0% - 2.5% ] 2.03% | 23,565 | 12.0% |
[ 2.0% - 2.5% ] 2.14% | 16,896 | 15.1% |
[ 2.0% - 2.5% ] 2.20% | 42,548 | 15.2% |
[ 2.0% - 2.5% ] 2.26% | 1,596 | 18.5% |
[ 2.5% - 3.0% ] 2.93% | 4,716 | 20.1% |
[ 2.5% - 3.0% ] 2.93% | 8,284 | 13.4% |
[ 3.0% - 3.5% ] 3.02% | 397 | 28.1% |
[ 3.0% - 3.5% ] 3.18% | 1,889 | 7.5% |
[ 3.0% - 3.5% ] 3.27% | 1,837 | 7.8% |
[ 3.0% - 3.5% ] 3.31% | 2,630 | 27.4% |
[ 3.5% - 4.0% ] 3.77% | 24,990 | 15.7% |
[ 4.0% - 4.5% ] 4.42% | 2,487 | 13.4% |
[ 4.5% - 5.0% ] 4.71% | 20,936 | 16.7% |
[ 4.5% - 5.0% ] 4.99% | 19,762 | 17.3% |
[ 5.5% - 6.0% ] 5.60% | 26,547 | 18.7% |
[ 5.5% - 6.0% ] 5.91% | 1,303 | 17.6% |
[ 6.0% - 6.5% ] 6.02% | 25,278 | 12.8% |
[ 6.5% - 7.0% ] 6.88% | 13,704 | 18.3% |
[ 7.5% - 8.0% ] 7.71% | 778 | 6.9% |
[ 7.5% - 8.0% ] 7.78% | 1,967 | 8.0% |
[ 7.5% - 8.0% ] 7.89% | 108,414 | 11.0% |
[ 9.0% - 9.5% ] 9.28% | 1,132 | 26.4% |
[ 9.5% - 10.0% ] 9.90% | 1,546 | 10.0% |
[ 12.0% - 12.5% ] 12.22% | 630 | 25.7% |
[ 12.0% - 12.5% ] 12.32% | 53,044 | 12.5% |
[ 13.0% - 13.5% ] 13.03% | 43,213 | 11.1% |
[ 17.0% - 17.5% ] 17.25% | 27,842 | 9.6% |
[ 19.0% - 19.5% ] 19.05% | 8,919 | 13.2% |
[ 21.5% - 22.0% ] 21.97% | 5,526 | 14.5% |