Zip Codes with the Highest Percentage of Population Employed in Health Diagnosing & Treating in Prescott, AZ
RELATED REPORTS & OPTIONS
Health Diagnosing & Treating
Prescott
Compare Zip Codes
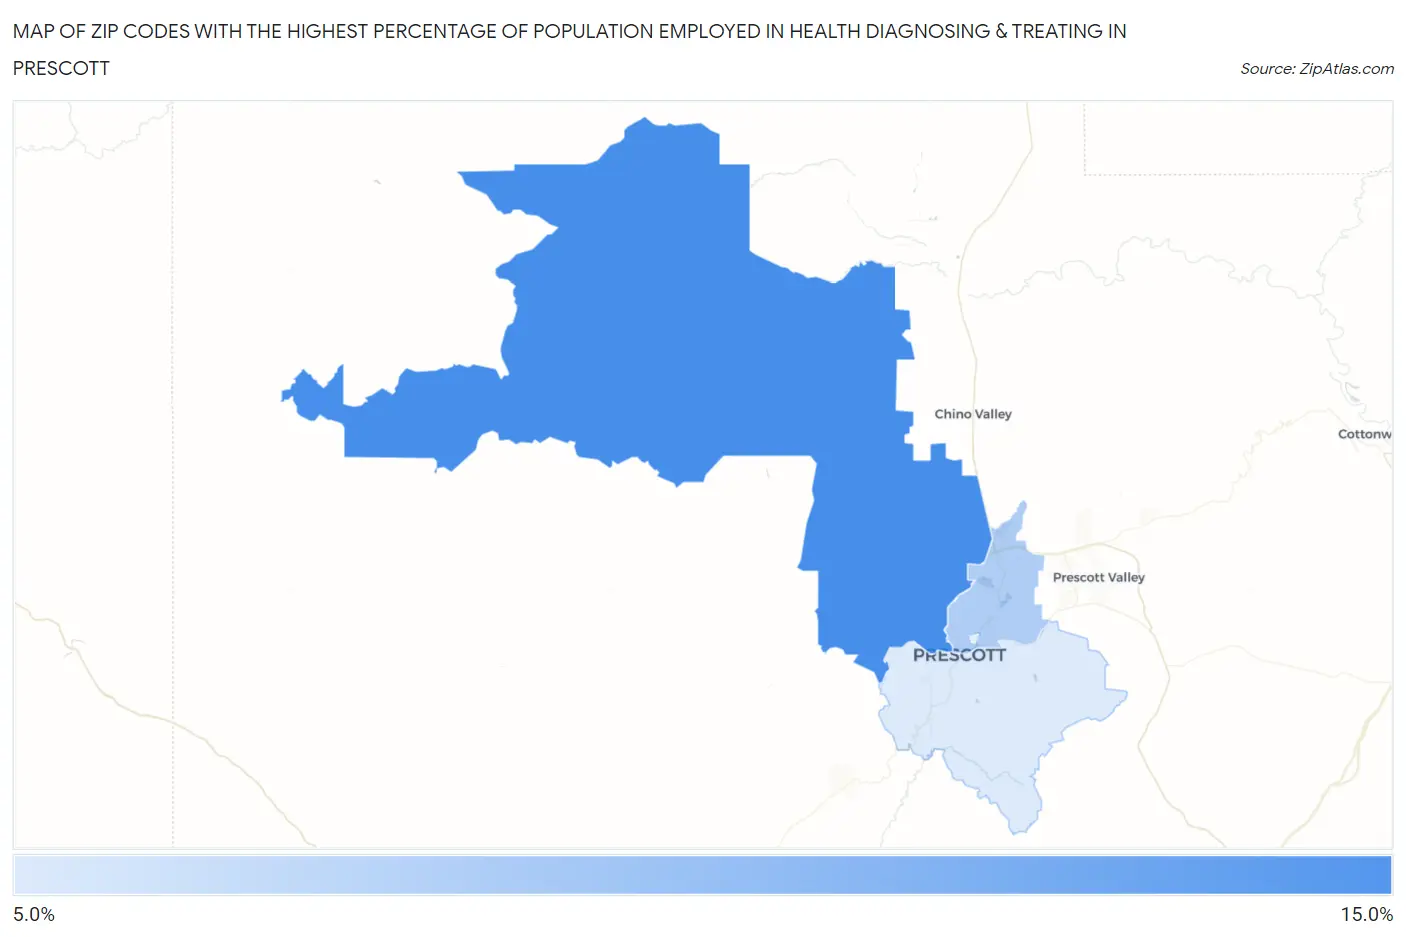
Map of Zip Codes with the Highest Percentage of Population Employed in Health Diagnosing & Treating in Prescott
6.1%
11.0%
Zip Codes with the Highest Percentage of Population Employed in Health Diagnosing & Treating in Prescott, AZ
| Zip Code | % Employed | vs State | vs National | |
| 1. | 86305 | 11.0% | 5.9%(+5.14)#28 | 6.2%(+4.78)#2,874 |
| 2. | 86301 | 7.6% | 5.9%(+1.72)#87 | 6.2%(+1.36)#8,505 |
| 3. | 86303 | 6.1% | 5.9%(+0.195)#155 | 6.2%(-0.168)#13,588 |
1
Common Questions
What are the Top 3 Zip Codes with the Highest Percentage of Population Employed in Health Diagnosing & Treating in Prescott, AZ?
Top 3 Zip Codes with the Highest Percentage of Population Employed in Health Diagnosing & Treating in Prescott, AZ are:
What zip code has the Highest Percentage of Population Employed in Health Diagnosing & Treating in Prescott, AZ?
86305 has the Highest Percentage of Population Employed in Health Diagnosing & Treating in Prescott, AZ with 11.0%.
What is the Percentage of Population Employed in Health Diagnosing & Treating in Prescott, AZ?
Percentage of Population Employed in Health Diagnosing & Treating in Prescott is 8.3%.
What is the Percentage of Population Employed in Health Diagnosing & Treating in Arizona?
Percentage of Population Employed in Health Diagnosing & Treating in Arizona is 5.9%.
What is the Percentage of Population Employed in Health Diagnosing & Treating in the United States?
Percentage of Population Employed in Health Diagnosing & Treating in the United States is 6.2%.