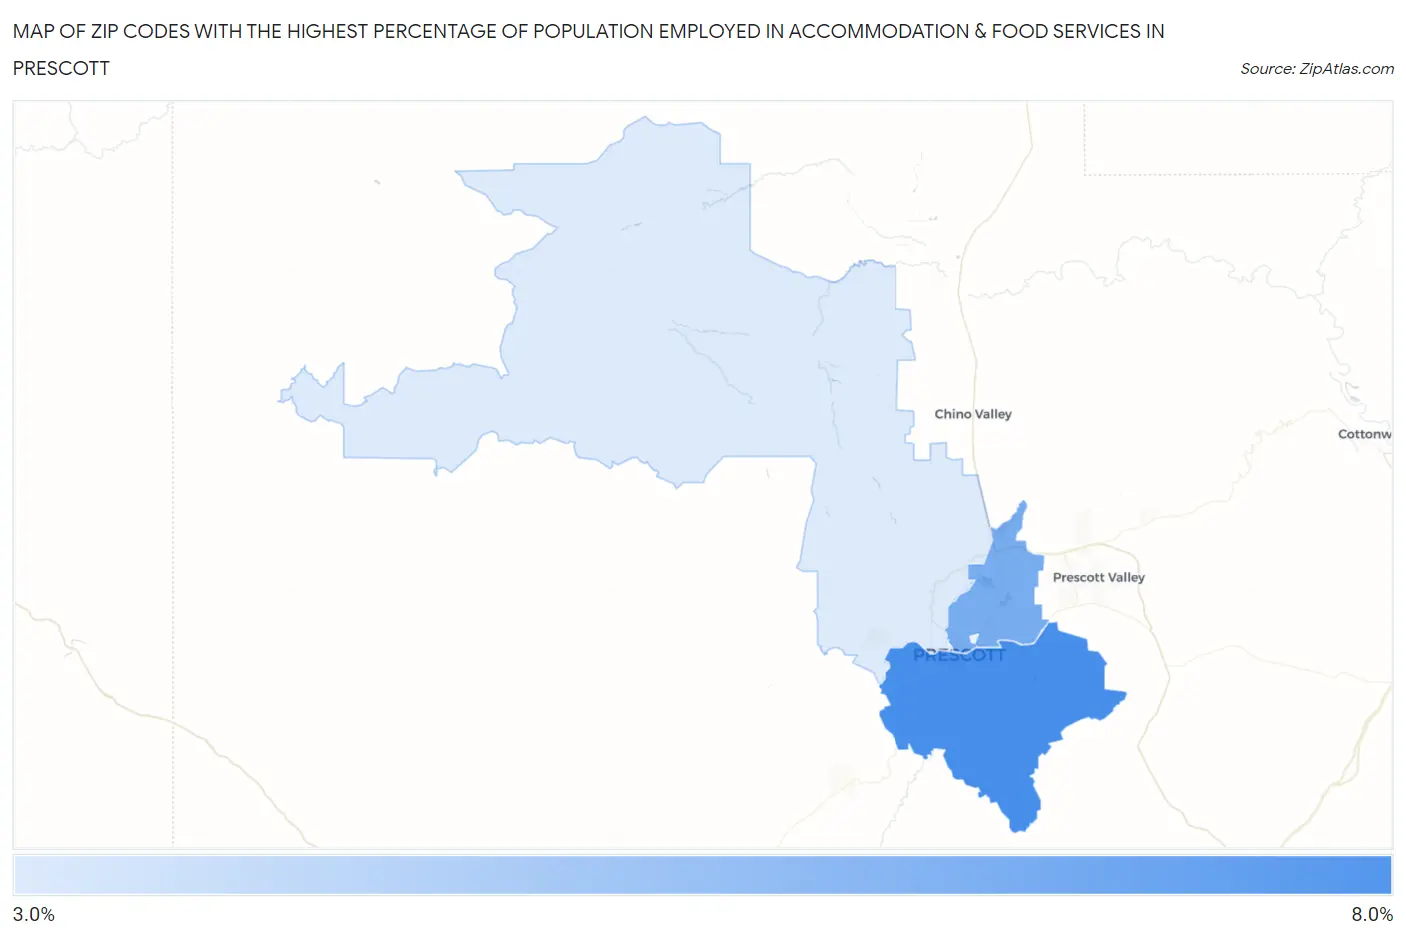
Zip Codes with the Highest Percentage of Population Employed in Accommodation & Food Services in Prescott, AZ
RELATED REPORTS & OPTIONS
Accommodation & Food Services
Prescott
Compare Zip Codes
Map of Zip Codes with the Highest Percentage of Population Employed in Accommodation & Food Services in Prescott
3.8%
7.4%
Zip Codes with the Highest Percentage of Population Employed in Accommodation & Food Services in Prescott, AZ
| Zip Code | % Employed | vs State | vs National | |
| 1. | 86303 | 7.4% | 7.6%(-0.110)#175 | 6.9%(+0.563)#9,122 |
| 2. | 86301 | 6.2% | 7.6%(-1.31)#225 | 6.9%(-0.639)#12,672 |
| 3. | 86305 | 3.8% | 7.6%(-3.79)#320 | 6.9%(-3.12)#20,906 |
1
Common Questions
What are the Top 3 Zip Codes with the Highest Percentage of Population Employed in Accommodation & Food Services in Prescott, AZ?
Top 3 Zip Codes with the Highest Percentage of Population Employed in Accommodation & Food Services in Prescott, AZ are:
What zip code has the Highest Percentage of Population Employed in Accommodation & Food Services in Prescott, AZ?
86303 has the Highest Percentage of Population Employed in Accommodation & Food Services in Prescott, AZ with 7.4%.
What is the Percentage of Population Employed in Accommodation & Food Services in Prescott, AZ?
Percentage of Population Employed in Accommodation & Food Services in Prescott is 6.2%.
What is the Percentage of Population Employed in Accommodation & Food Services in Arizona?
Percentage of Population Employed in Accommodation & Food Services in Arizona is 7.6%.
What is the Percentage of Population Employed in Accommodation & Food Services in the United States?
Percentage of Population Employed in Accommodation & Food Services in the United States is 6.9%.