Zip Codes with the Highest Percentage of Population Employed in Legal Services & Support in Prescott, AZ
RELATED REPORTS & OPTIONS
Legal Services & Support
Prescott
Compare Zip Codes
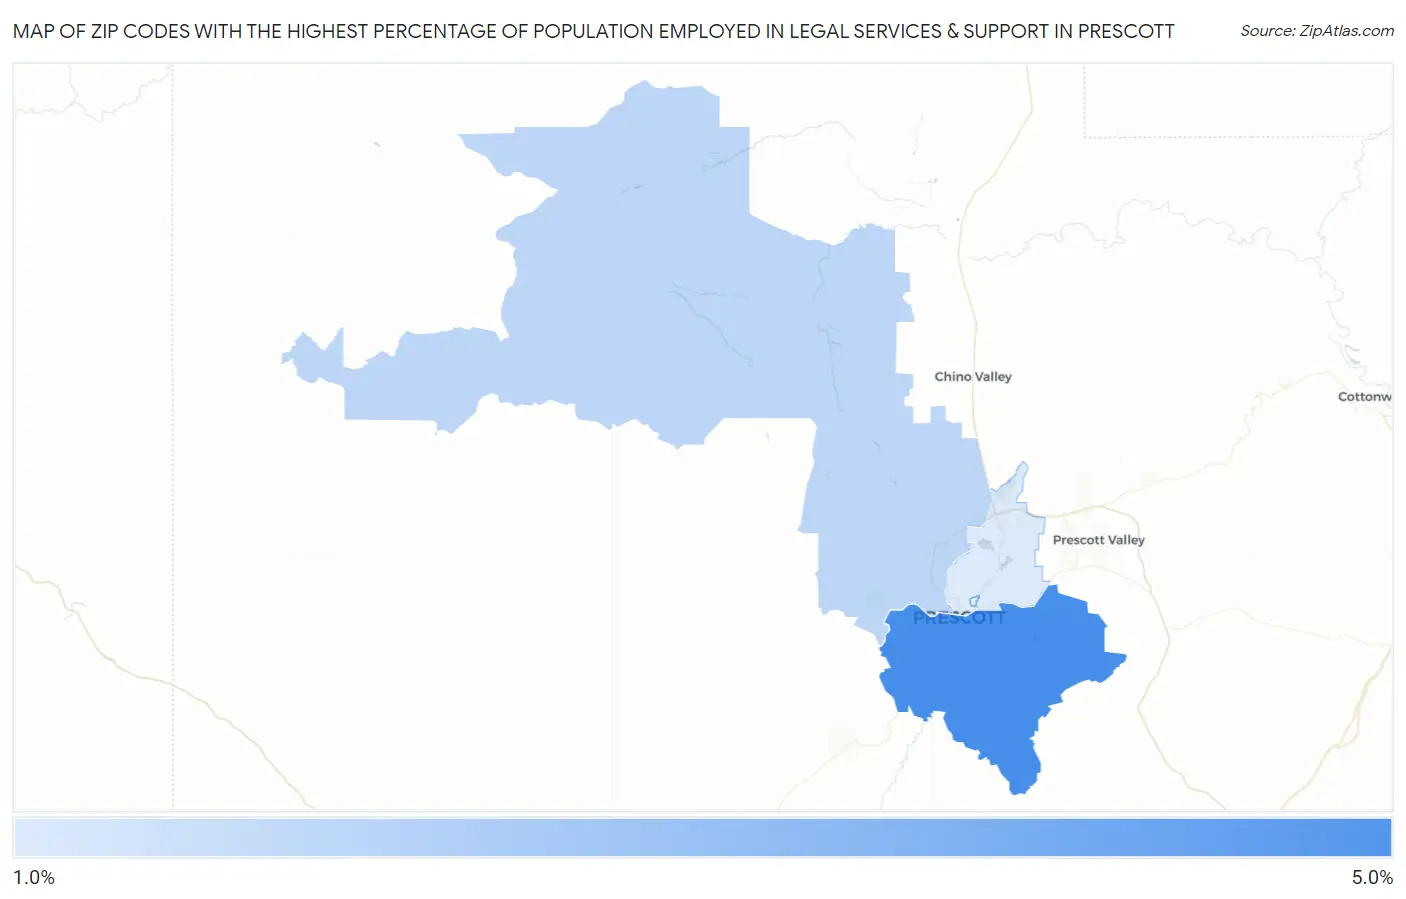
Map of Zip Codes with the Highest Percentage of Population Employed in Legal Services & Support in Prescott
1.1%
4.2%
Zip Codes with the Highest Percentage of Population Employed in Legal Services & Support in Prescott, AZ
| Zip Code | % Employed | vs State | vs National | |
| 1. | 86303 | 4.2% | 0.99%(+3.20)#6 | 1.2%(+3.00)#1,029 |
| 2. | 86305 | 1.7% | 0.99%(+0.755)#48 | 1.2%(+0.558)#4,171 |
| 3. | 86301 | 1.1% | 0.99%(+0.117)#93 | 1.2%(-0.081)#7,150 |
1
Common Questions
What are the Top 3 Zip Codes with the Highest Percentage of Population Employed in Legal Services & Support in Prescott, AZ?
Top 3 Zip Codes with the Highest Percentage of Population Employed in Legal Services & Support in Prescott, AZ are:
What zip code has the Highest Percentage of Population Employed in Legal Services & Support in Prescott, AZ?
86303 has the Highest Percentage of Population Employed in Legal Services & Support in Prescott, AZ with 4.2%.
What is the Percentage of Population Employed in Legal Services & Support in Prescott, AZ?
Percentage of Population Employed in Legal Services & Support in Prescott is 2.6%.
What is the Percentage of Population Employed in Legal Services & Support in Arizona?
Percentage of Population Employed in Legal Services & Support in Arizona is 0.99%.
What is the Percentage of Population Employed in Legal Services & Support in the United States?
Percentage of Population Employed in Legal Services & Support in the United States is 1.2%.