Zip Codes with the Highest Percentage of Population Employed in Agriculture, Fishing & Hunting in Prescott, AZ
RELATED REPORTS & OPTIONS
Agriculture, Fishing & Hunting
Prescott
Compare Zip Codes
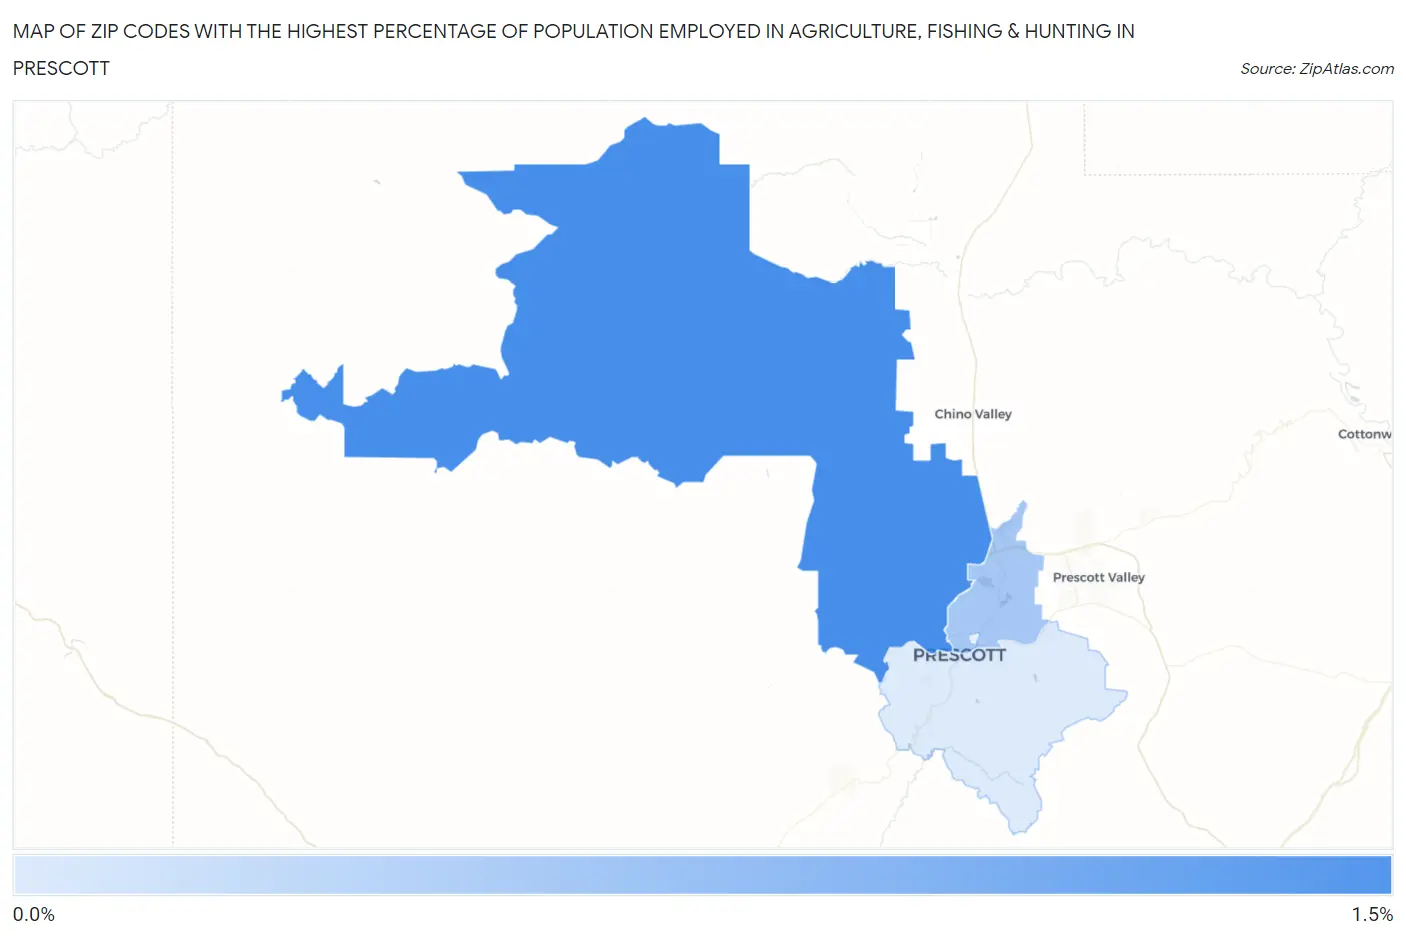
Map of Zip Codes with the Highest Percentage of Population Employed in Agriculture, Fishing & Hunting in Prescott
0.18%
1.1%
Zip Codes with the Highest Percentage of Population Employed in Agriculture, Fishing & Hunting in Prescott, AZ
| Zip Code | % Employed | vs State | vs National | |
| 1. | 86305 | 1.1% | 0.80%(+0.250)#116 | 1.2%(-0.146)#15,995 |
| 2. | 86301 | 0.50% | 0.80%(-0.303)#169 | 1.2%(-0.699)#19,279 |
| 3. | 86303 | 0.18% | 0.80%(-0.619)#239 | 1.2%(-1.02)#22,543 |
1
Common Questions
What are the Top 3 Zip Codes with the Highest Percentage of Population Employed in Agriculture, Fishing & Hunting in Prescott, AZ?
Top 3 Zip Codes with the Highest Percentage of Population Employed in Agriculture, Fishing & Hunting in Prescott, AZ are:
What zip code has the Highest Percentage of Population Employed in Agriculture, Fishing & Hunting in Prescott, AZ?
86305 has the Highest Percentage of Population Employed in Agriculture, Fishing & Hunting in Prescott, AZ with 1.1%.
What is the Percentage of Population Employed in Agriculture, Fishing & Hunting in Prescott, AZ?
Percentage of Population Employed in Agriculture, Fishing & Hunting in Prescott is 0.35%.
What is the Percentage of Population Employed in Agriculture, Fishing & Hunting in Arizona?
Percentage of Population Employed in Agriculture, Fishing & Hunting in Arizona is 0.80%.
What is the Percentage of Population Employed in Agriculture, Fishing & Hunting in the United States?
Percentage of Population Employed in Agriculture, Fishing & Hunting in the United States is 1.2%.