Zip Codes with the Highest Percentage of Population with a Degree in Visual and Performing Arts in Prescott, AZ
RELATED REPORTS & OPTIONS
Visual and Performing Arts
Prescott
Compare Zip Codes
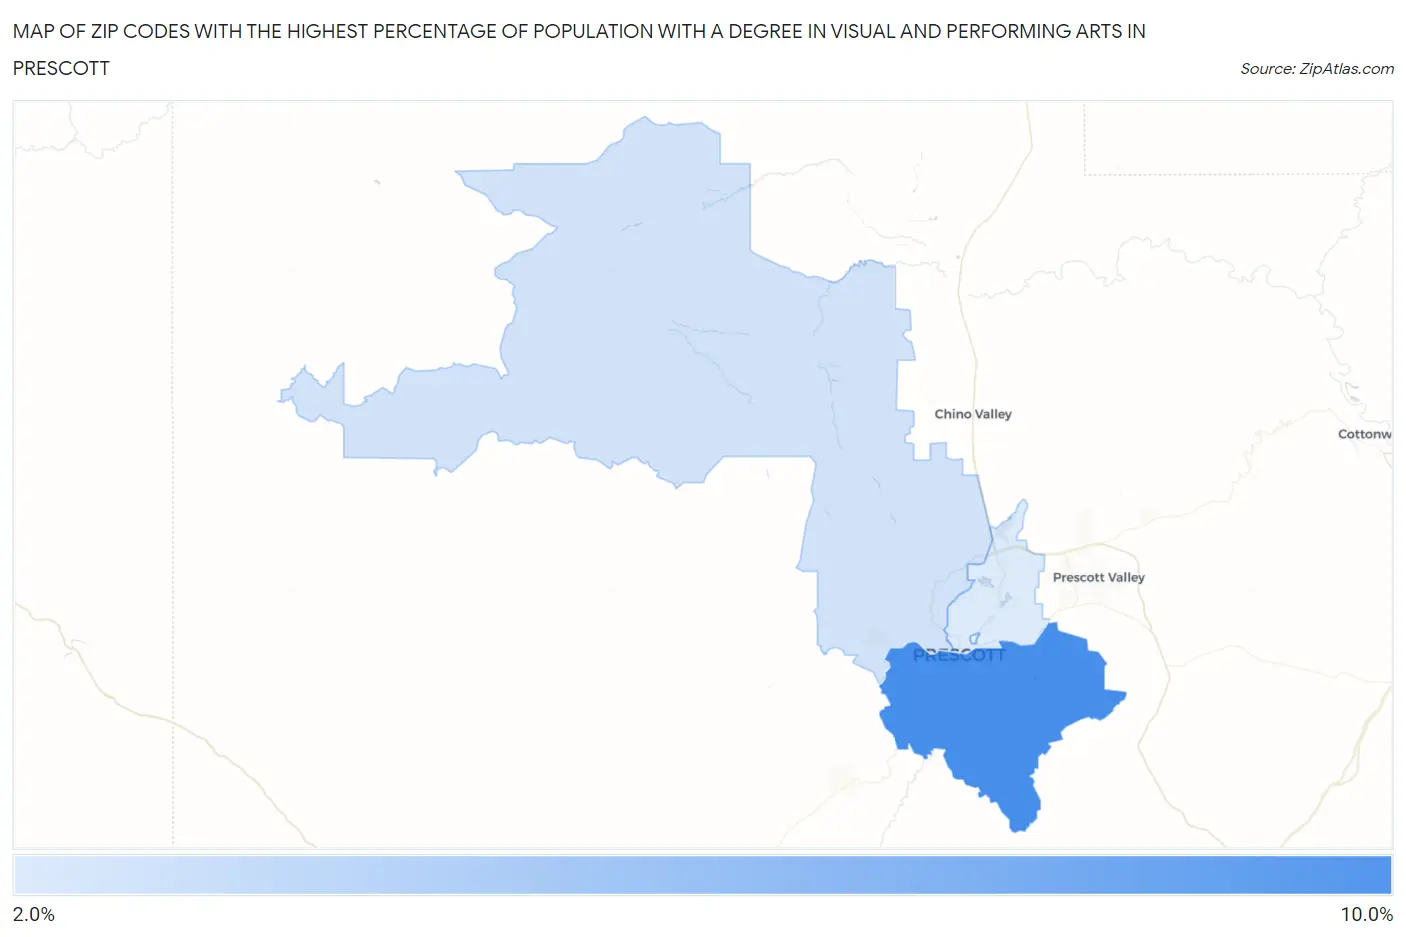
Map of Zip Codes with the Highest Percentage of Population with a Degree in Visual and Performing Arts in Prescott
2.9%
8.2%
Zip Codes with the Highest Percentage of Population with a Degree in Visual and Performing Arts in Prescott, AZ
| Zip Code | % Graduates | vs State | vs National | |
| 1. | 86303 | 8.2% | 3.6%(+4.64)#15 | 4.3%(+3.96)#2,714 |
| 2. | 86305 | 3.3% | 3.6%(-0.271)#146 | 4.3%(-0.948)#11,604 |
| 3. | 86301 | 2.9% | 3.6%(-0.682)#179 | 4.3%(-1.36)#13,133 |
1
Common Questions
What are the Top 3 Zip Codes with the Highest Percentage of Population with a Degree in Visual and Performing Arts in Prescott, AZ?
Top 3 Zip Codes with the Highest Percentage of Population with a Degree in Visual and Performing Arts in Prescott, AZ are:
What zip code has the Highest Percentage of Population with a Degree in Visual and Performing Arts in Prescott, AZ?
86303 has the Highest Percentage of Population with a Degree in Visual and Performing Arts in Prescott, AZ with 8.2%.
What is the Percentage of Population with a Degree in Visual and Performing Arts in Prescott, AZ?
Percentage of Population with a Degree in Visual and Performing Arts in Prescott is 5.0%.
What is the Percentage of Population with a Degree in Visual and Performing Arts in Arizona?
Percentage of Population with a Degree in Visual and Performing Arts in Arizona is 3.6%.
What is the Percentage of Population with a Degree in Visual and Performing Arts in the United States?
Percentage of Population with a Degree in Visual and Performing Arts in the United States is 4.3%.