Dallas County, AL Map & Demographics
Dallas County Map
Dallas County Overview
$22,798
PER CAPITA INCOME
$52,453
AVG FAMILY INCOME
$37,180
AVG HOUSEHOLD INCOME
25.4%
WAGE / INCOME GAP [ % ]
74.6¢/ $1
WAGE / INCOME GAP [ $ ]
$10,300
FAMILY INCOME DEFICIT
0.49
INEQUALITY / GINI INDEX
38,326
TOTAL POPULATION
17,895
MALE POPULATION
20,431
FEMALE POPULATION
87.59
MALES / 100 FEMALES
114.17
FEMALES / 100 MALES
40.4
MEDIAN AGE
3.6
AVG FAMILY SIZE
2.6
AVG HOUSEHOLD SIZE
15,813
LABOR FORCE [ PEOPLE ]
52.1%
PERCENT IN LABOR FORCE
9.1%
UNEMPLOYMENT RATE
Dallas County Area Codes
Income in Dallas County
Income Overview in Dallas County
Per Capita Income in Dallas County is $22,798, while median incomes of families and households are $52,453 and $37,180 respectively.
| Characteristic | Number | Measure |
| Per Capita Income | 38,326 | $22,798 |
| Median Family Income | 8,477 | $52,453 |
| Mean Family Income | 8,477 | $67,749 |
| Median Household Income | 14,753 | $37,180 |
| Mean Household Income | 14,753 | $53,213 |
| Income Deficit | 8,477 | $10,300 |
| Wage / Income Gap (%) | 38,326 | 25.44% |
| Wage / Income Gap ($) | 38,326 | 74.56¢ per $1 |
| Gini / Inequality Index | 38,326 | 0.49 |
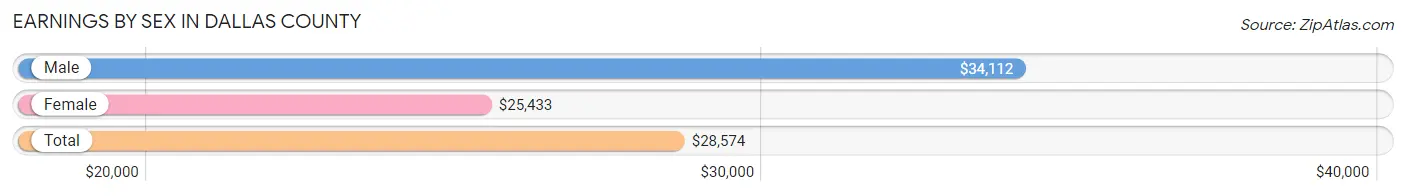
Earnings by Sex in Dallas County
Average Earnings in Dallas County are $28,574, $34,112 for men and $25,433 for women, a difference of 25.4%.
| Sex | Number | Average Earnings |
| Male | 7,630 (48.3%) | $34,112 |
| Female | 8,156 (51.7%) | $25,433 |
| Total | 15,786 (100.0%) | $28,574 |
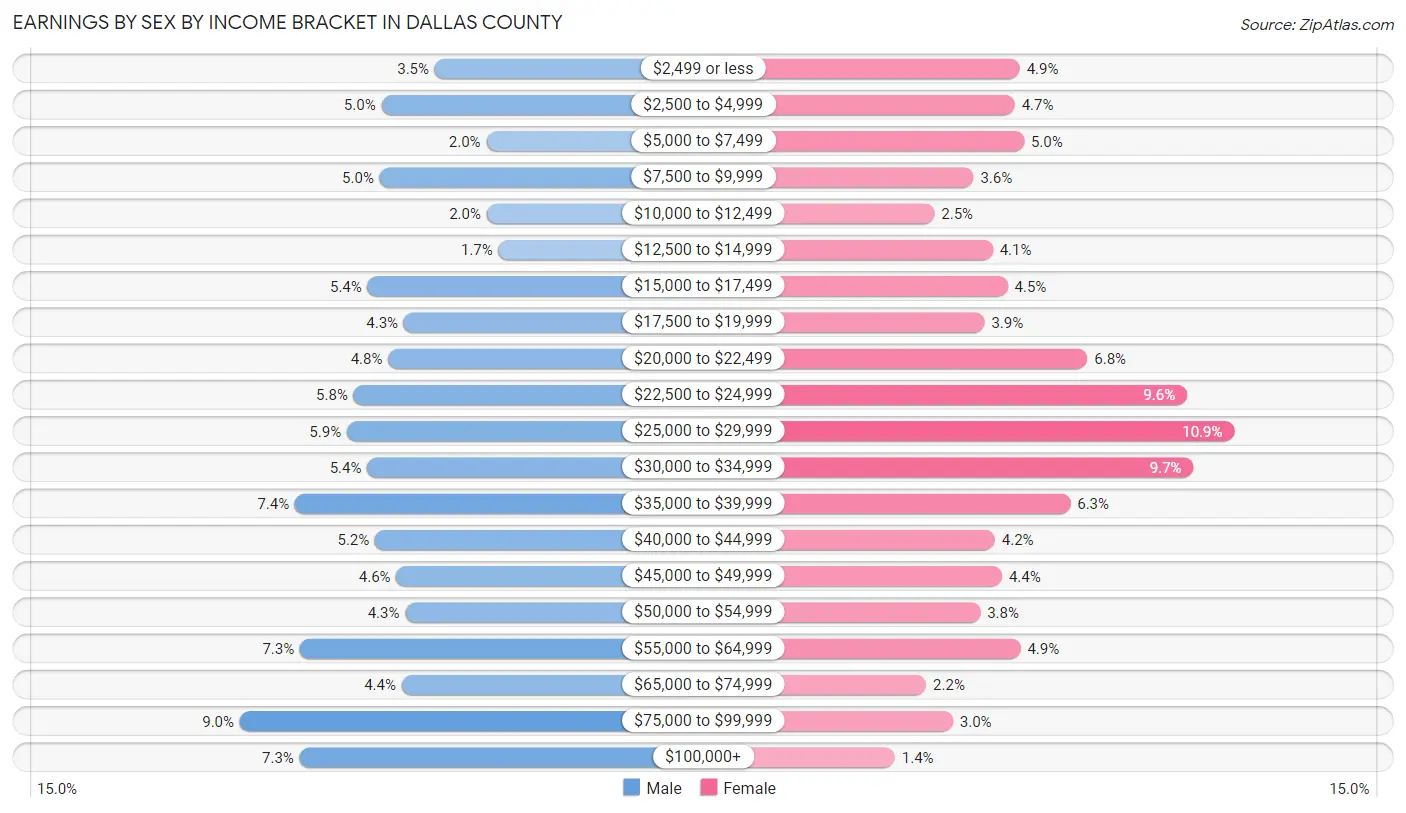
Earnings by Sex by Income Bracket in Dallas County
The most common earnings brackets in Dallas County are $75,000 to $99,999 for men (683 | 8.9%) and $25,000 to $29,999 for women (888 | 10.9%).
| Income | Male | Female |
| $2,499 or less | 265 (3.5%) | 396 (4.9%) |
| $2,500 to $4,999 | 379 (5.0%) | 385 (4.7%) |
| $5,000 to $7,499 | 154 (2.0%) | 406 (5.0%) |
| $7,500 to $9,999 | 383 (5.0%) | 290 (3.6%) |
| $10,000 to $12,499 | 153 (2.0%) | 201 (2.5%) |
| $12,500 to $14,999 | 128 (1.7%) | 334 (4.1%) |
| $15,000 to $17,499 | 409 (5.4%) | 369 (4.5%) |
| $17,500 to $19,999 | 331 (4.3%) | 316 (3.9%) |
| $20,000 to $22,499 | 365 (4.8%) | 551 (6.8%) |
| $22,500 to $24,999 | 439 (5.8%) | 780 (9.6%) |
| $25,000 to $29,999 | 453 (5.9%) | 888 (10.9%) |
| $30,000 to $34,999 | 410 (5.4%) | 794 (9.7%) |
| $35,000 to $39,999 | 565 (7.4%) | 512 (6.3%) |
| $40,000 to $44,999 | 393 (5.1%) | 339 (4.2%) |
| $45,000 to $49,999 | 347 (4.5%) | 356 (4.4%) |
| $50,000 to $54,999 | 328 (4.3%) | 306 (3.7%) |
| $55,000 to $64,999 | 554 (7.3%) | 398 (4.9%) |
| $65,000 to $74,999 | 336 (4.4%) | 182 (2.2%) |
| $75,000 to $99,999 | 683 (8.9%) | 243 (3.0%) |
| $100,000+ | 555 (7.3%) | 110 (1.3%) |
| Total | 7,630 (100.0%) | 8,156 (100.0%) |
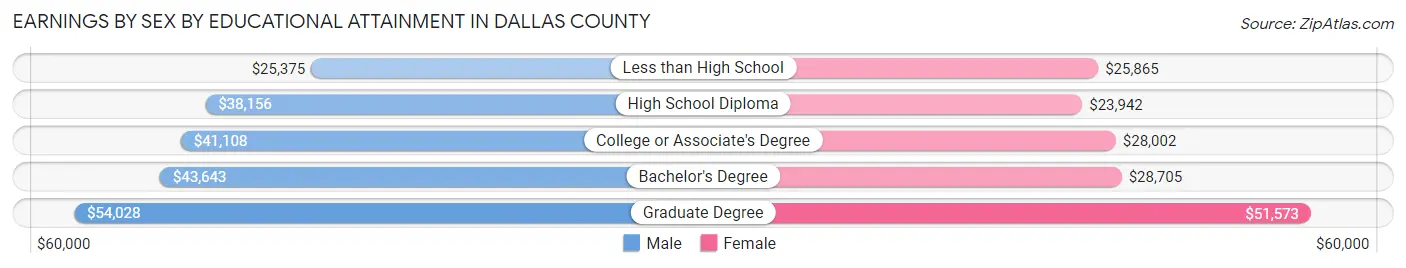
Earnings by Sex by Educational Attainment in Dallas County
Average earnings in Dallas County are $37,841 for men and $28,192 for women, a difference of 25.5%. Men with an educational attainment of graduate degree enjoy the highest average annual earnings of $54,028, while those with less than high school education earn the least with $25,375. Women with an educational attainment of graduate degree earn the most with the average annual earnings of $51,573, while those with high school diploma education have the smallest earnings of $23,942.
| Educational Attainment | Male Income | Female Income |
| Less than High School | $25,375 | $25,865 |
| High School Diploma | $38,156 | $23,942 |
| College or Associate's Degree | $41,108 | $28,002 |
| Bachelor's Degree | $43,643 | $28,705 |
| Graduate Degree | $54,028 | $51,573 |
| Total | $37,841 | $28,192 |
Family Income in Dallas County
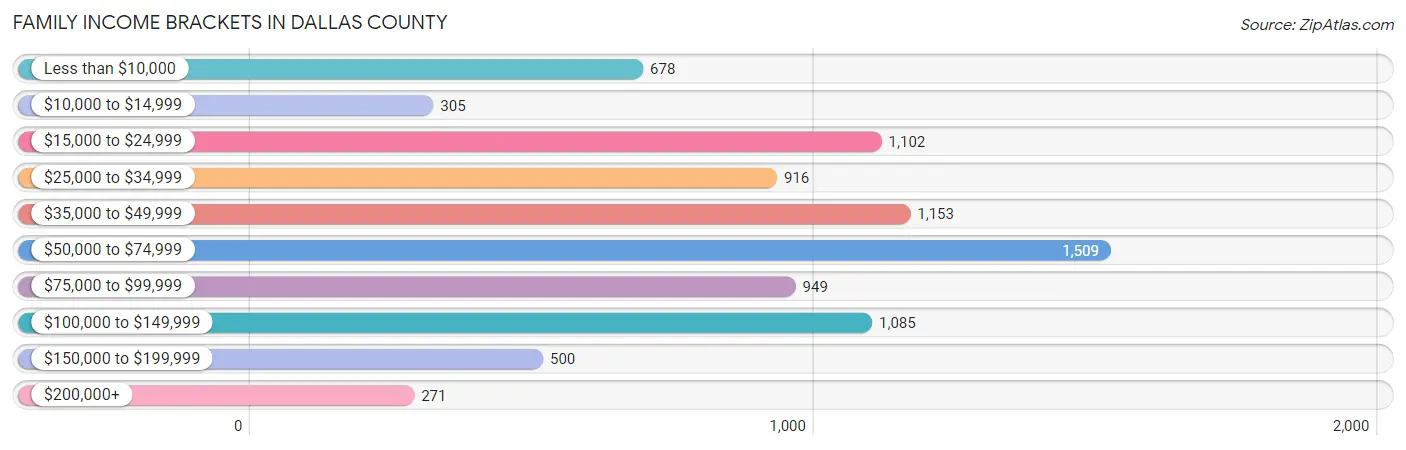
Family Income Brackets in Dallas County
According to the Dallas County family income data, there are 1,509 families falling into the $50,000 to $74,999 income range, which is the most common income bracket and makes up 17.8% of all families. Conversely, the $200,000+ income bracket is the least frequent group with only 271 families (3.2%) belonging to this category.
| Income Bracket | # Families | % Families |
| Less than $10,000 | 678 | 8.0% |
| $10,000 to $14,999 | 305 | 3.6% |
| $15,000 to $24,999 | 1,102 | 13.0% |
| $25,000 to $34,999 | 916 | 10.8% |
| $35,000 to $49,999 | 1,153 | 13.6% |
| $50,000 to $74,999 | 1,509 | 17.8% |
| $75,000 to $99,999 | 949 | 11.2% |
| $100,000 to $149,999 | 1,085 | 12.8% |
| $150,000 to $199,999 | 500 | 5.9% |
| $200,000+ | 271 | 3.2% |
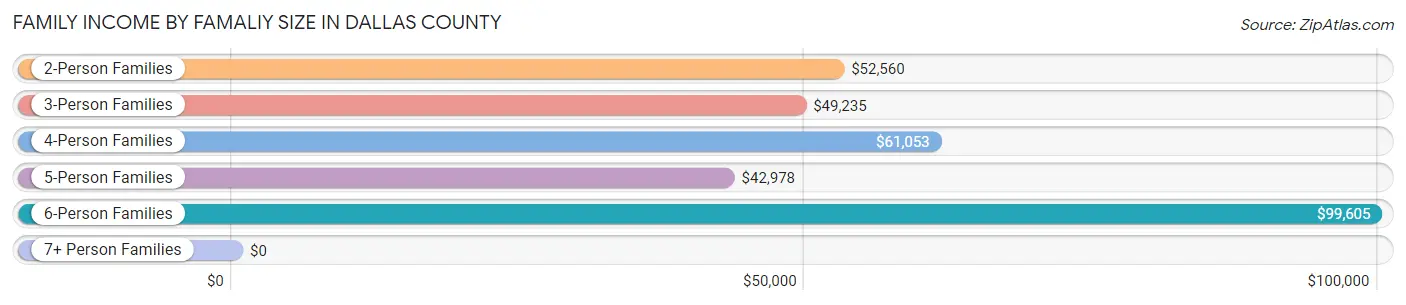
Family Income by Famaliy Size in Dallas County
6-person families (300 | 3.5%) account for the highest median family income in Dallas County with $99,605 per family, while 2-person families (4,298 | 50.7%) have the highest median income of $26,280 per family member.
| Income Bracket | # Families | Median Income |
| 2-Person Families | 4,298 (50.7%) | $52,560 |
| 3-Person Families | 2,176 (25.7%) | $49,235 |
| 4-Person Families | 1,138 (13.4%) | $61,053 |
| 5-Person Families | 447 (5.3%) | $42,978 |
| 6-Person Families | 300 (3.5%) | $99,605 |
| 7+ Person Families | 118 (1.4%) | $0 |
| Total | 8,477 (100.0%) | $52,453 |
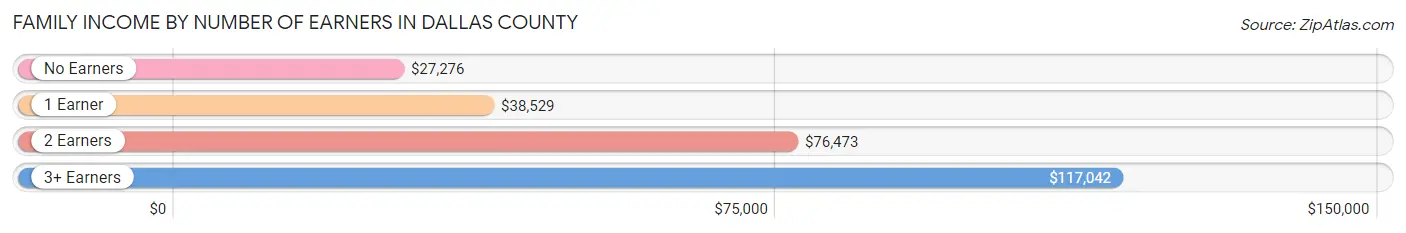
Family Income by Number of Earners in Dallas County
The median family income in Dallas County is $52,453, with families comprising 3+ earners (689) having the highest median family income of $117,042, while families with no earners (1,962) have the lowest median family income of $27,276, accounting for 8.1% and 23.1% of families, respectively.
| Number of Earners | # Families | Median Income |
| No Earners | 1,962 (23.1%) | $27,276 |
| 1 Earner | 3,204 (37.8%) | $38,529 |
| 2 Earners | 2,622 (30.9%) | $76,473 |
| 3+ Earners | 689 (8.1%) | $117,042 |
| Total | 8,477 (100.0%) | $52,453 |
Household Income in Dallas County
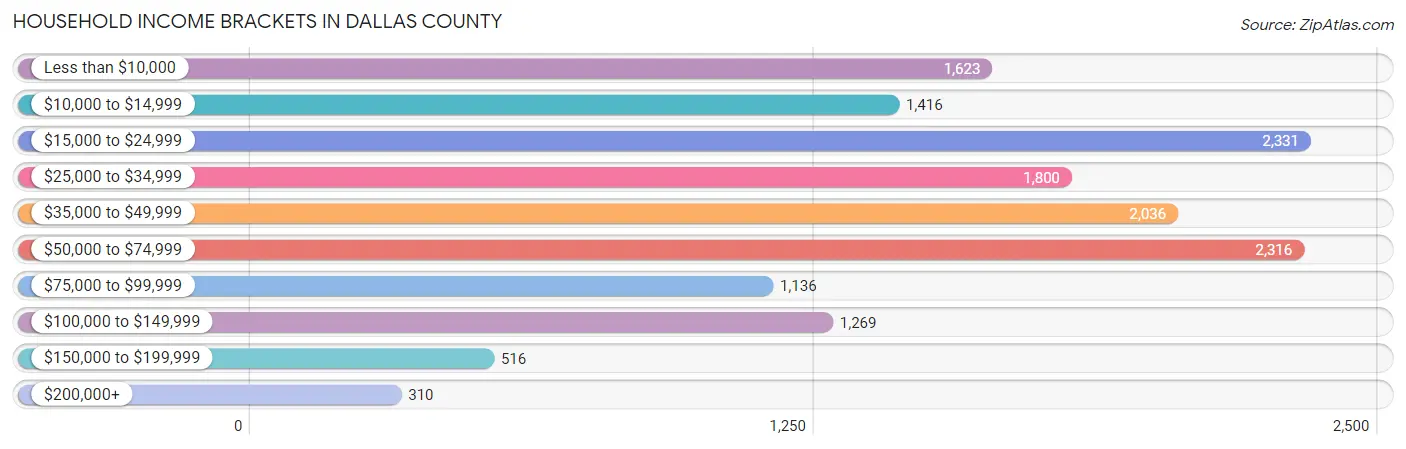
Household Income Brackets in Dallas County
With 2,331 households falling in the category, the $15,000 to $24,999 income range is the most frequent in Dallas County, accounting for 15.8% of all households. In contrast, only 310 households (2.1%) fall into the $200,000+ income bracket, making it the least populous group.
| Income Bracket | # Households | % Households |
| Less than $10,000 | 1,623 | 11.0% |
| $10,000 to $14,999 | 1,416 | 9.6% |
| $15,000 to $24,999 | 2,331 | 15.8% |
| $25,000 to $34,999 | 1,800 | 12.2% |
| $35,000 to $49,999 | 2,036 | 13.8% |
| $50,000 to $74,999 | 2,316 | 15.7% |
| $75,000 to $99,999 | 1,136 | 7.7% |
| $100,000 to $149,999 | 1,269 | 8.6% |
| $150,000 to $199,999 | 516 | 3.5% |
| $200,000+ | 310 | 2.1% |
Household Income by Householder Age in Dallas County
The median household income in Dallas County is $37,180, with the highest median household income of $42,008 found in the 45 to 64 years age bracket for the primary householder. A total of 5,665 households (38.4%) fall into this category. Meanwhile, the 15 to 24 years age bracket for the primary householder has the lowest median household income of $0, with 600 households (4.1%) in this group.
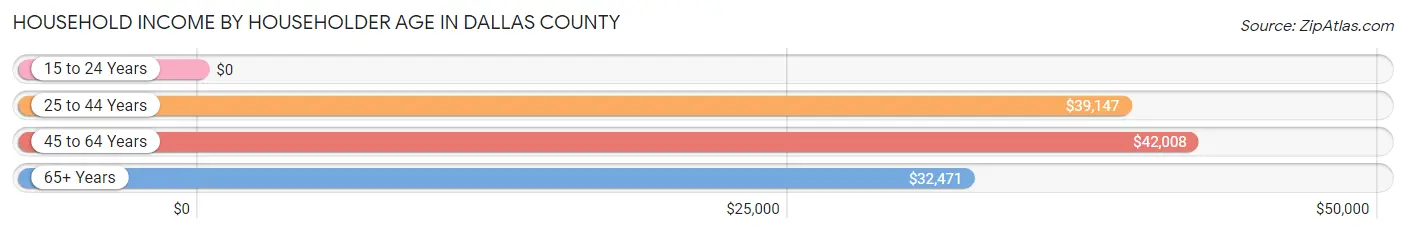
| Income Bracket | # Households | Median Income |
| 15 to 24 Years | 600 (4.1%) | $0 |
| 25 to 44 Years | 3,173 (21.5%) | $39,147 |
| 45 to 64 Years | 5,665 (38.4%) | $42,008 |
| 65+ Years | 5,315 (36.0%) | $32,471 |
| Total | 14,753 (100.0%) | $37,180 |
Poverty in Dallas County
Income Below Poverty by Sex and Age in Dallas County
With 23.6% poverty level for males and 30.1% for females among the residents of Dallas County, under 5 year old males and under 5 year old females are the most vulnerable to poverty, with 798 males (66.2%) and 562 females (56.4%) in their respective age groups living below the poverty level.
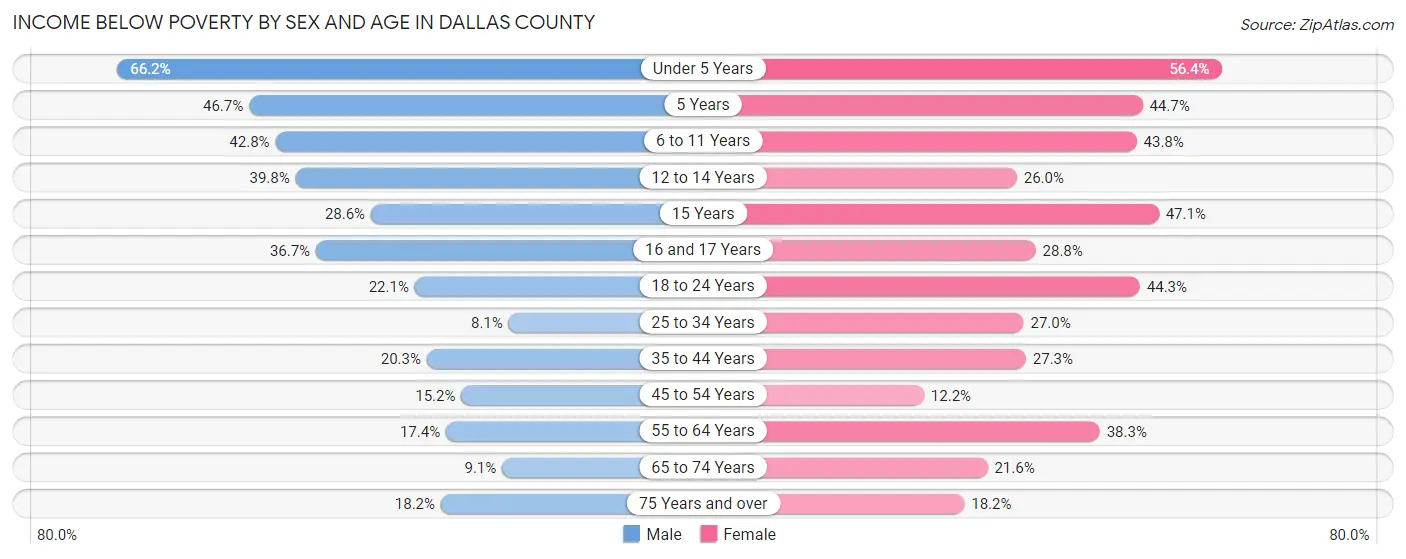
| Age Bracket | Male | Female |
| Under 5 Years | 798 (66.2%) | 562 (56.4%) |
| 5 Years | 161 (46.7%) | 246 (44.7%) |
| 6 to 11 Years | 543 (42.8%) | 577 (43.8%) |
| 12 to 14 Years | 377 (39.8%) | 158 (26.0%) |
| 15 Years | 130 (28.6%) | 72 (47.1%) |
| 16 and 17 Years | 158 (36.7%) | 175 (28.8%) |
| 18 to 24 Years | 339 (22.1%) | 710 (44.3%) |
| 25 to 34 Years | 160 (8.1%) | 630 (27.0%) |
| 35 to 44 Years | 377 (20.3%) | 640 (27.3%) |
| 45 to 54 Years | 304 (15.1%) | 297 (12.2%) |
| 55 to 64 Years | 439 (17.4%) | 1,152 (38.3%) |
| 65 to 74 Years | 182 (9.1%) | 531 (21.6%) |
| 75 Years and over | 201 (18.2%) | 311 (18.2%) |
| Total | 4,169 (23.6%) | 6,061 (30.1%) |
Income Above Poverty by Sex and Age in Dallas County
According to the poverty statistics in Dallas County, males aged 25 to 34 years and females aged 45 to 54 years are the age groups that are most secure financially, with 91.9% of males and 87.8% of females in these age groups living above the poverty line.
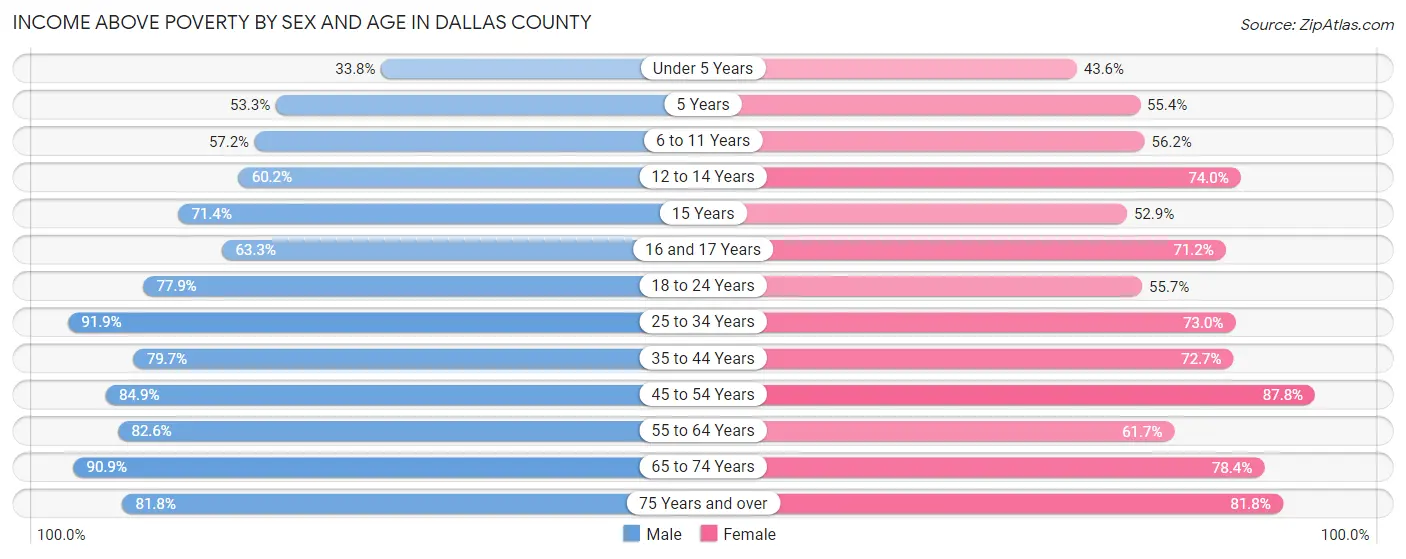
| Age Bracket | Male | Female |
| Under 5 Years | 407 (33.8%) | 435 (43.6%) |
| 5 Years | 184 (53.3%) | 305 (55.3%) |
| 6 to 11 Years | 727 (57.2%) | 741 (56.2%) |
| 12 to 14 Years | 571 (60.2%) | 450 (74.0%) |
| 15 Years | 325 (71.4%) | 81 (52.9%) |
| 16 and 17 Years | 272 (63.3%) | 433 (71.2%) |
| 18 to 24 Years | 1,197 (77.9%) | 894 (55.7%) |
| 25 to 34 Years | 1,809 (91.9%) | 1,704 (73.0%) |
| 35 to 44 Years | 1,482 (79.7%) | 1,702 (72.7%) |
| 45 to 54 Years | 1,703 (84.9%) | 2,139 (87.8%) |
| 55 to 64 Years | 2,080 (82.6%) | 1,856 (61.7%) |
| 65 to 74 Years | 1,820 (90.9%) | 1,924 (78.4%) |
| 75 Years and over | 904 (81.8%) | 1,399 (81.8%) |
| Total | 13,481 (76.4%) | 14,063 (69.9%) |
Income Below Poverty Among Married-Couple Families in Dallas County
The poverty statistics for married-couple families in Dallas County show that 6.5% or 298 of the total 4,581 families live below the poverty line. Families with 3 or 4 children have the highest poverty rate of 30.6%, comprising of 59 families. On the other hand, families with no children have the lowest poverty rate of 4.5%, which includes 150 families.
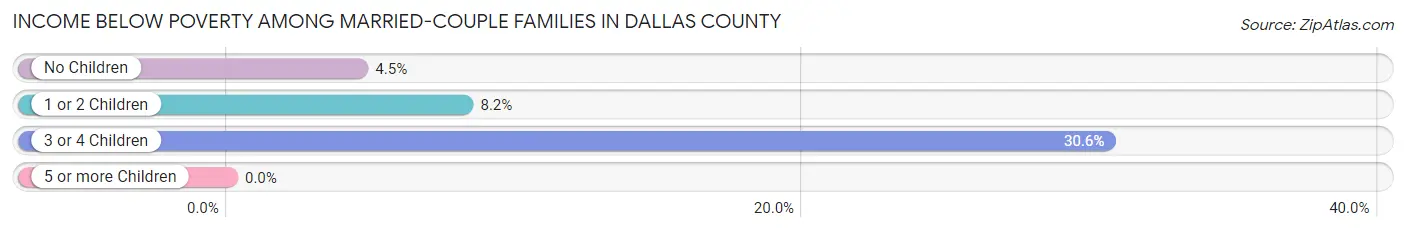
| Children | Above Poverty | Below Poverty |
| No Children | 3,153 (95.5%) | 150 (4.5%) |
| 1 or 2 Children | 996 (91.8%) | 89 (8.2%) |
| 3 or 4 Children | 134 (69.4%) | 59 (30.6%) |
| 5 or more Children | 0 (0.0%) | 0 (0.0%) |
| Total | 4,283 (93.5%) | 298 (6.5%) |
Income Below Poverty Among Single-Parent Households in Dallas County
According to the poverty data in Dallas County, 19.0% or 144 single-father households and 44.4% or 1,394 single-mother households are living below the poverty line. Among single-father households, those with 3 or 4 children have the highest poverty rate, with 12 households (30.8%) experiencing poverty. Likewise, among single-mother households, those with 5 or more children have the highest poverty rate, with 18 households (100.0%) falling below the poverty line.
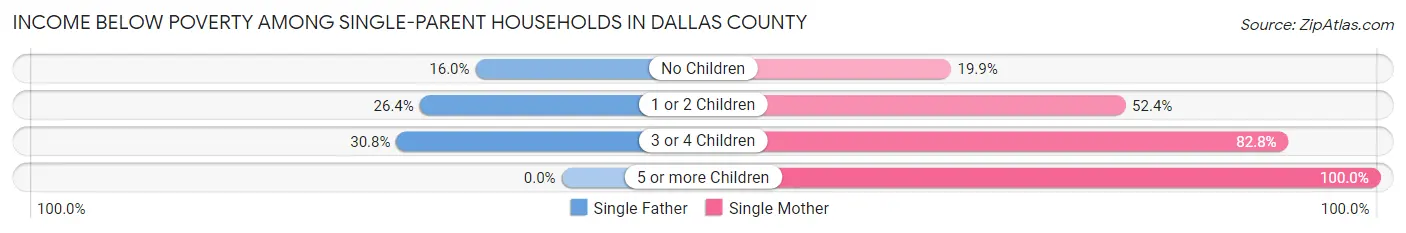
| Children | Single Father | Single Mother |
| No Children | 90 (16.0%) | 226 (19.9%) |
| 1 or 2 Children | 42 (26.4%) | 851 (52.4%) |
| 3 or 4 Children | 12 (30.8%) | 299 (82.8%) |
| 5 or more Children | 0 (0.0%) | 18 (100.0%) |
| Total | 144 (19.0%) | 1,394 (44.4%) |
Income Below Poverty Among Married-Couple vs Single-Parent Households in Dallas County
The poverty data for Dallas County shows that 298 of the married-couple family households (6.5%) and 1,538 of the single-parent households (39.5%) are living below the poverty level. Within the married-couple family households, those with 3 or 4 children have the highest poverty rate, with 59 households (30.6%) falling below the poverty line. Among the single-parent households, those with 5 or more children have the highest poverty rate, with 18 household (100.0%) living below poverty.
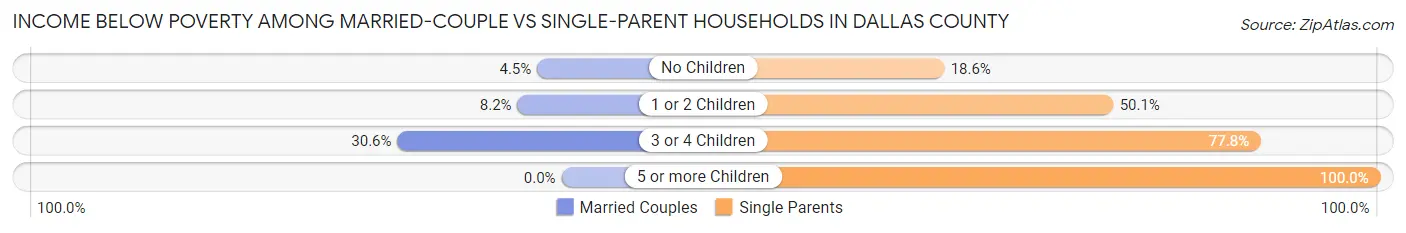
| Children | Married-Couple Families | Single-Parent Households |
| No Children | 150 (4.5%) | 316 (18.6%) |
| 1 or 2 Children | 89 (8.2%) | 893 (50.1%) |
| 3 or 4 Children | 59 (30.6%) | 311 (77.7%) |
| 5 or more Children | 0 (0.0%) | 18 (100.0%) |
| Total | 298 (6.5%) | 1,538 (39.5%) |
Race in Dallas County
The most populous races in Dallas County are Black / African American (26,467 | 69.1%), White / Caucasian (10,634 | 27.8%), and Two or more Races (761 | 2.0%).
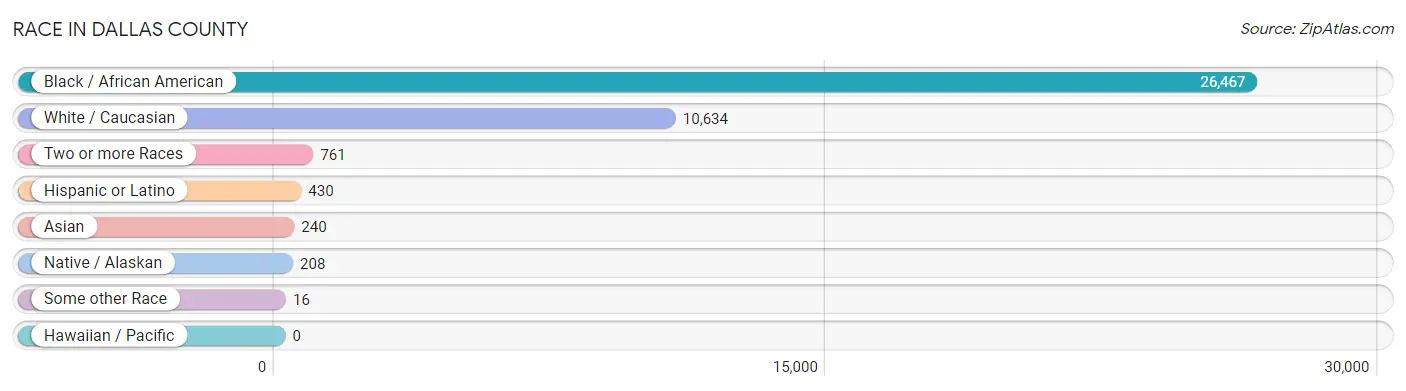
| Race | # Population | % Population |
| Asian | 240 | 0.6% |
| Black / African American | 26,467 | 69.1% |
| Hawaiian / Pacific | 0 | 0.0% |
| Hispanic or Latino | 430 | 1.1% |
| Native / Alaskan | 208 | 0.5% |
| White / Caucasian | 10,634 | 27.8% |
| Two or more Races | 761 | 2.0% |
| Some other Race | 16 | 0.0% |
| Total | 38,326 | 100.0% |
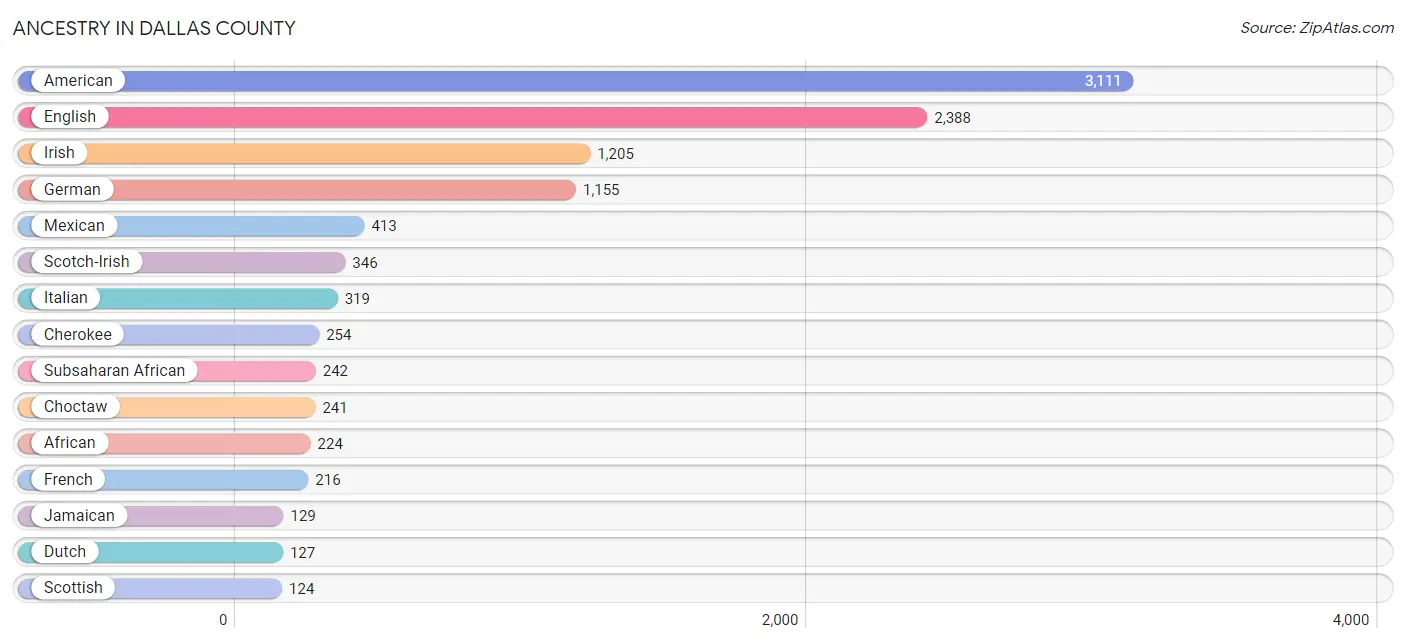
Ancestry in Dallas County
The most populous ancestries reported in Dallas County are American (3,111 | 8.1%), English (2,388 | 6.2%), Irish (1,205 | 3.1%), German (1,155 | 3.0%), and Mexican (413 | 1.1%), together accounting for 21.6% of all Dallas County residents.
| Ancestry | # Population | % Population |
| African | 224 | 0.6% |
| American | 3,111 | 8.1% |
| Arab | 17 | 0.0% |
| British | 65 | 0.2% |
| Burmese | 6 | 0.0% |
| Cherokee | 254 | 0.7% |
| Choctaw | 241 | 0.6% |
| Creek | 61 | 0.2% |
| Croatian | 3 | 0.0% |
| Czech | 3 | 0.0% |
| Danish | 18 | 0.1% |
| Dutch | 127 | 0.3% |
| Eastern European | 15 | 0.0% |
| English | 2,388 | 6.2% |
| European | 58 | 0.2% |
| Finnish | 8 | 0.0% |
| French | 216 | 0.6% |
| French Canadian | 11 | 0.0% |
| German | 1,155 | 3.0% |
| Guyanese | 5 | 0.0% |
| Haitian | 1 | 0.0% |
| Irish | 1,205 | 3.1% |
| Italian | 319 | 0.8% |
| Jamaican | 129 | 0.3% |
| Mexican | 413 | 1.1% |
| Northern European | 2 | 0.0% |
| Norwegian | 13 | 0.0% |
| Polish | 61 | 0.2% |
| Potawatomi | 37 | 0.1% |
| Pueblo | 21 | 0.1% |
| Puerto Rican | 17 | 0.0% |
| Romanian | 9 | 0.0% |
| Scandinavian | 18 | 0.1% |
| Scotch-Irish | 346 | 0.9% |
| Scottish | 124 | 0.3% |
| Sri Lankan | 122 | 0.3% |
| Subsaharan African | 242 | 0.6% |
| Swedish | 50 | 0.1% |
| Swiss | 15 | 0.0% |
| Thai | 107 | 0.3% |
| Welsh | 16 | 0.0% | View All 41 Rows |
Immigrants in Dallas County
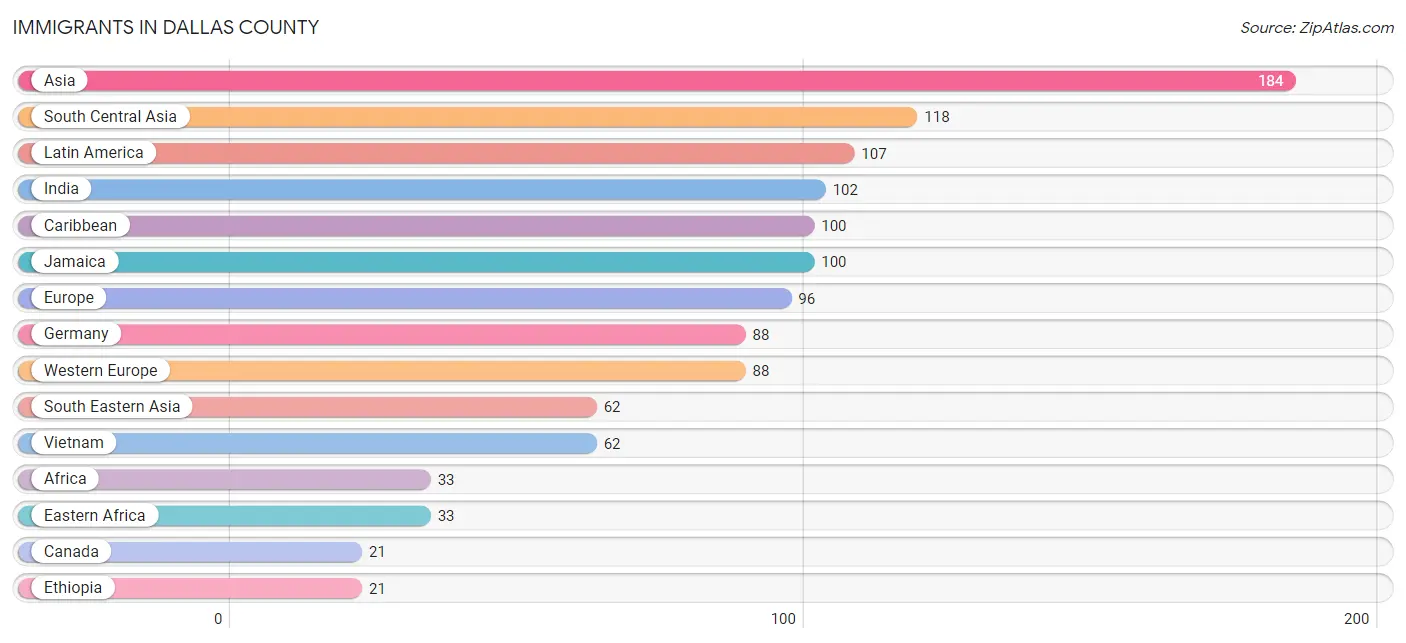
The most numerous immigrant groups reported in Dallas County came from Asia (184 | 0.5%), South Central Asia (118 | 0.3%), Latin America (107 | 0.3%), India (102 | 0.3%), and Caribbean (100 | 0.3%), together accounting for 1.6% of all Dallas County residents.
| Immigration Origin | # Population | % Population |
| Africa | 33 | 0.1% |
| Asia | 184 | 0.5% |
| Canada | 21 | 0.1% |
| Caribbean | 100 | 0.3% |
| Central America | 7 | 0.0% |
| Eastern Africa | 33 | 0.1% |
| Ethiopia | 21 | 0.1% |
| Europe | 96 | 0.3% |
| Germany | 88 | 0.2% |
| India | 102 | 0.3% |
| Jamaica | 100 | 0.3% |
| Latin America | 107 | 0.3% |
| Mexico | 7 | 0.0% |
| Northern Europe | 8 | 0.0% |
| Pakistan | 16 | 0.0% |
| South Central Asia | 118 | 0.3% |
| South Eastern Asia | 62 | 0.2% |
| Vietnam | 62 | 0.2% |
| Western Asia | 4 | 0.0% |
| Western Europe | 88 | 0.2% |
| Yemen | 4 | 0.0% | View All 21 Rows |
Sex and Age in Dallas County
Sex and Age in Dallas County
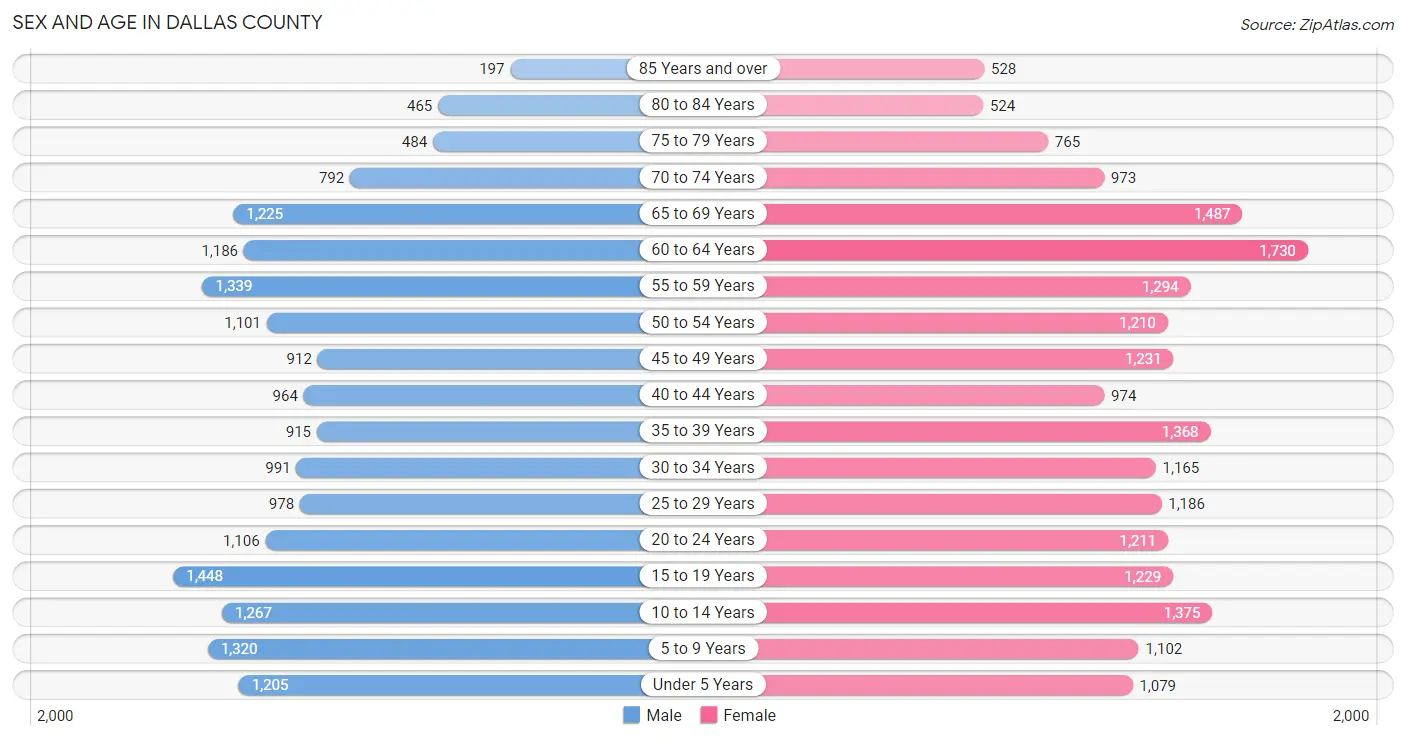
The most populous age groups in Dallas County are 15 to 19 Years (1,448 | 8.1%) for men and 60 to 64 Years (1,730 | 8.5%) for women.
| Age Bracket | Male | Female |
| Under 5 Years | 1,205 (6.7%) | 1,079 (5.3%) |
| 5 to 9 Years | 1,320 (7.4%) | 1,102 (5.4%) |
| 10 to 14 Years | 1,267 (7.1%) | 1,375 (6.7%) |
| 15 to 19 Years | 1,448 (8.1%) | 1,229 (6.0%) |
| 20 to 24 Years | 1,106 (6.2%) | 1,211 (5.9%) |
| 25 to 29 Years | 978 (5.5%) | 1,186 (5.8%) |
| 30 to 34 Years | 991 (5.5%) | 1,165 (5.7%) |
| 35 to 39 Years | 915 (5.1%) | 1,368 (6.7%) |
| 40 to 44 Years | 964 (5.4%) | 974 (4.8%) |
| 45 to 49 Years | 912 (5.1%) | 1,231 (6.0%) |
| 50 to 54 Years | 1,101 (6.1%) | 1,210 (5.9%) |
| 55 to 59 Years | 1,339 (7.5%) | 1,294 (6.3%) |
| 60 to 64 Years | 1,186 (6.6%) | 1,730 (8.5%) |
| 65 to 69 Years | 1,225 (6.9%) | 1,487 (7.3%) |
| 70 to 74 Years | 792 (4.4%) | 973 (4.8%) |
| 75 to 79 Years | 484 (2.7%) | 765 (3.7%) |
| 80 to 84 Years | 465 (2.6%) | 524 (2.6%) |
| 85 Years and over | 197 (1.1%) | 528 (2.6%) |
| Total | 17,895 (100.0%) | 20,431 (100.0%) |
Families and Households in Dallas County
Median Family Size in Dallas County
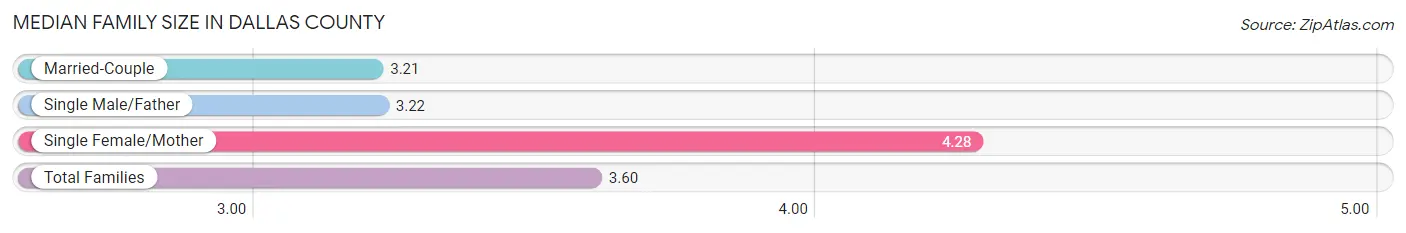
The median family size in Dallas County is 3.60 persons per family, with single female/mother families (3,137 | 37.0%) accounting for the largest median family size of 4.28 persons per family. On the other hand, married-couple families (4,581 | 54.0%) represent the smallest median family size with 3.21 persons per family.
| Family Type | # Families | Family Size |
| Married-Couple | 4,581 (54.0%) | 3.21 |
| Single Male/Father | 759 (8.9%) | 3.22 |
| Single Female/Mother | 3,137 (37.0%) | 4.28 |
| Total Families | 8,477 (100.0%) | 3.60 |
Median Household Size in Dallas County
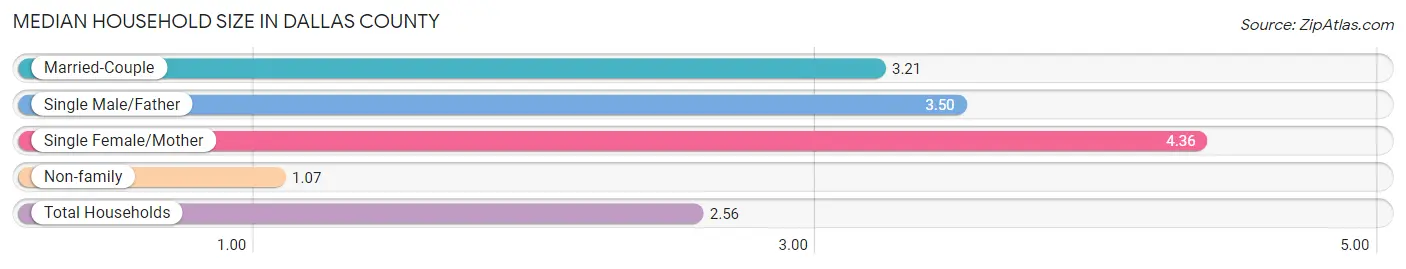
The median household size in Dallas County is 2.56 persons per household, with single female/mother households (3,137 | 21.3%) accounting for the largest median household size of 4.36 persons per household. non-family households (6,276 | 42.5%) represent the smallest median household size with 1.07 persons per household.
| Household Type | # Households | Household Size |
| Married-Couple | 4,581 (31.0%) | 3.21 |
| Single Male/Father | 759 (5.1%) | 3.50 |
| Single Female/Mother | 3,137 (21.3%) | 4.36 |
| Non-family | 6,276 (42.5%) | 1.07 |
| Total Households | 14,753 (100.0%) | 2.56 |
Household Size by Marriage Status in Dallas County
Out of a total of 14,753 households in Dallas County, 8,477 (57.5%) are family households, while 6,276 (42.5%) are nonfamily households. The most numerous type of family households are 2-person households, comprising 4,242, and the most common type of nonfamily households are 1-person households, comprising 5,936.
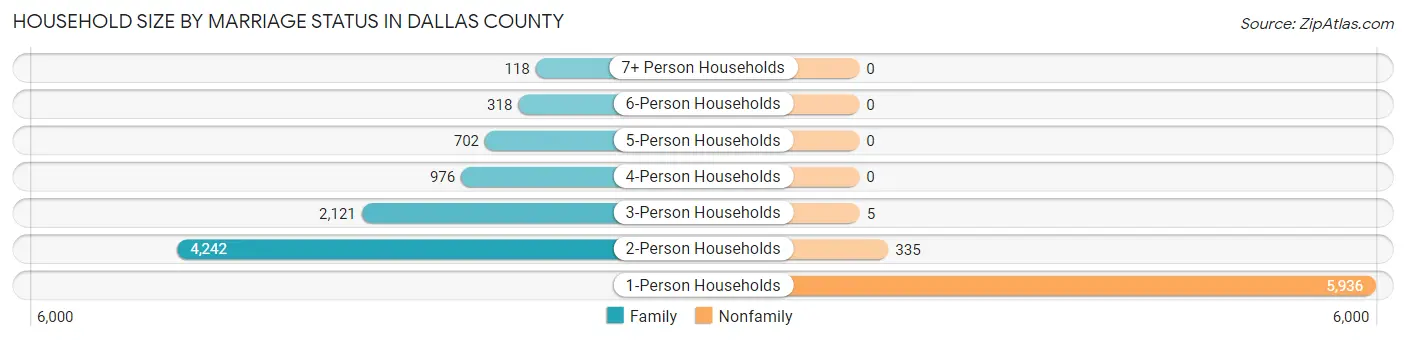
| Household Size | Family Households | Nonfamily Households |
| 1-Person Households | - | 5,936 (40.2%) |
| 2-Person Households | 4,242 (28.7%) | 335 (2.3%) |
| 3-Person Households | 2,121 (14.4%) | 5 (0.0%) |
| 4-Person Households | 976 (6.6%) | 0 (0.0%) |
| 5-Person Households | 702 (4.8%) | 0 (0.0%) |
| 6-Person Households | 318 (2.2%) | 0 (0.0%) |
| 7+ Person Households | 118 (0.8%) | 0 (0.0%) |
| Total | 8,477 (57.5%) | 6,276 (42.5%) |
Female Fertility in Dallas County
Fertility by Age in Dallas County
Average fertility rate in Dallas County is 49.0 births per 1,000 women. Women in the age bracket of 20 to 34 years have the highest fertility rate with 79.0 births per 1,000 women. Women in the age bracket of 20 to 34 years acount for 66.8% of all women with births.
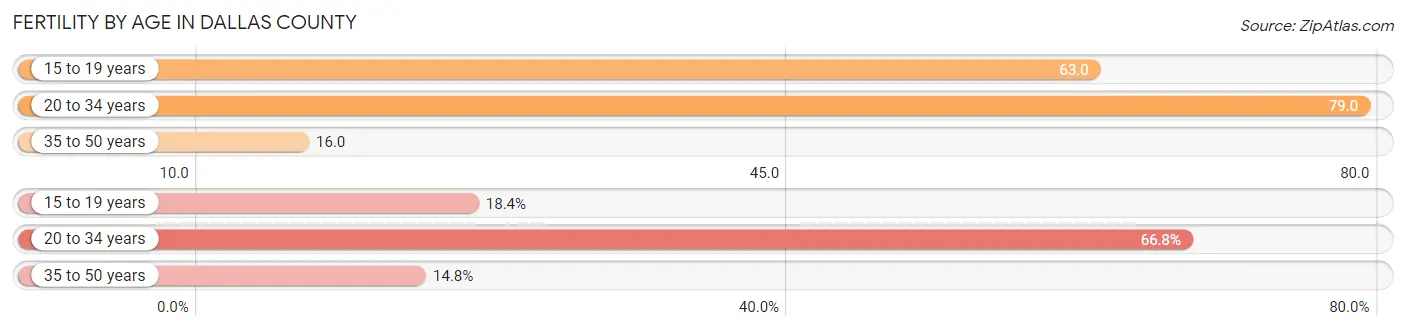
| Age Bracket | Women with Births | Births / 1,000 Women |
| 15 to 19 years | 77 (18.4%) | 63.0 |
| 20 to 34 years | 280 (66.8%) | 79.0 |
| 35 to 50 years | 62 (14.8%) | 16.0 |
| Total | 419 (100.0%) | 49.0 |
Fertility by Age by Marriage Status in Dallas County
51.6% of women with births (419) in Dallas County are married. The highest percentage of unmarried women with births falls into 15 to 19 years age bracket with 100.0% of them unmarried at the time of birth, while the lowest percentage of unmarried women with births belong to 20 to 34 years age bracket with 28.2% of them unmarried.
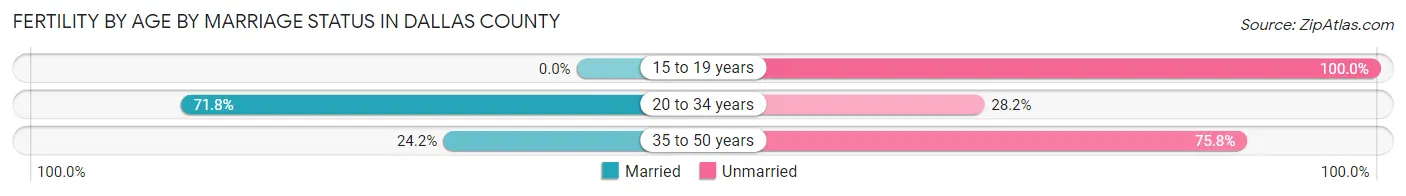
| Age Bracket | Married | Unmarried |
| 15 to 19 years | 0 (0.0%) | 77 (100.0%) |
| 20 to 34 years | 201 (71.8%) | 79 (28.2%) |
| 35 to 50 years | 15 (24.2%) | 47 (75.8%) |
| Total | 216 (51.5%) | 203 (48.4%) |
Fertility by Education in Dallas County
Average fertility rate in Dallas County is 49.0 births per 1,000 women. Women with the education attainment of high school diploma have the highest fertility rate of 70.0 births per 1,000 women, while women with the education attainment of bachelor's degree have the lowest fertility at 15.0 births per 1,000 women. Women with the education attainment of high school diploma represent 46.5% of all women with births.
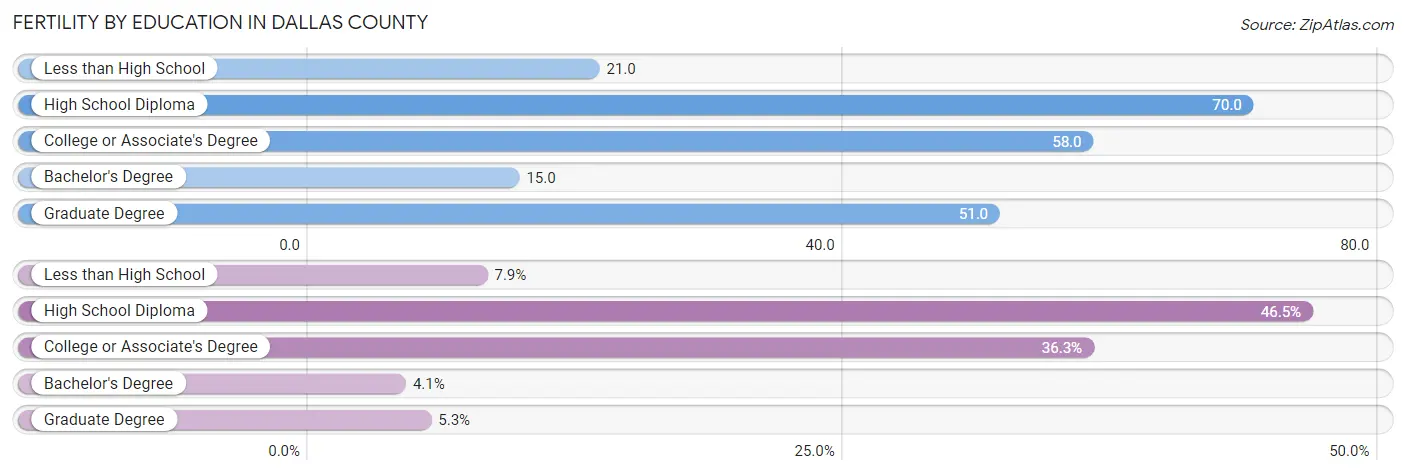
| Educational Attainment | Women with Births | Births / 1,000 Women |
| Less than High School | 33 (7.9%) | 21.0 |
| High School Diploma | 195 (46.5%) | 70.0 |
| College or Associate's Degree | 152 (36.3%) | 58.0 |
| Bachelor's Degree | 17 (4.1%) | 15.0 |
| Graduate Degree | 22 (5.2%) | 51.0 |
| Total | 419 (100.0%) | 49.0 |
Fertility by Education by Marriage Status in Dallas County
48.4% of women with births in Dallas County are unmarried. Women with the educational attainment of bachelor's degree are most likely to be married with 100.0% of them married at childbirth, while women with the educational attainment of high school diploma are least likely to be married with 73.3% of them unmarried at childbirth.
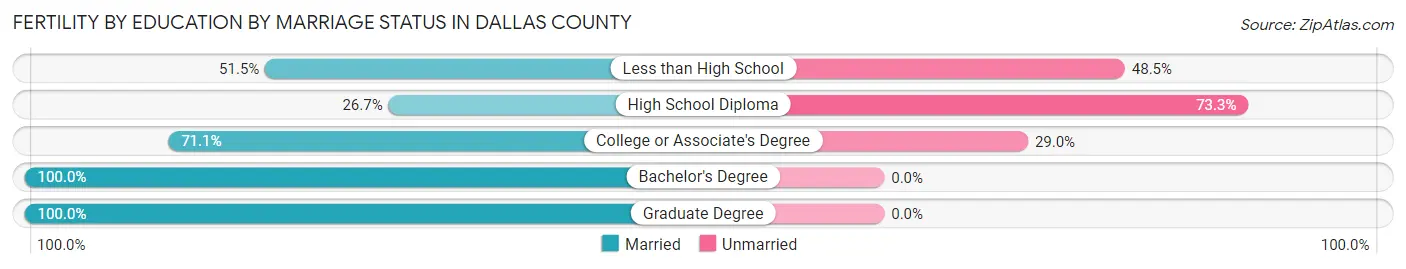
| Educational Attainment | Married | Unmarried |
| Less than High School | 17 (51.5%) | 16 (48.5%) |
| High School Diploma | 52 (26.7%) | 143 (73.3%) |
| College or Associate's Degree | 108 (71.1%) | 44 (28.9%) |
| Bachelor's Degree | 17 (100.0%) | 0 (0.0%) |
| Graduate Degree | 22 (100.0%) | 0 (0.0%) |
| Total | 216 (51.5%) | 203 (48.4%) |
Employment Characteristics in Dallas County
Employment by Class of Employer in Dallas County
Among the 14,138 employed individuals in Dallas County, private company employees (10,403 | 73.6%), local government employees (944 | 6.7%), and self-employed (not incorporated) (789 | 5.6%) make up the most common classes of employment.
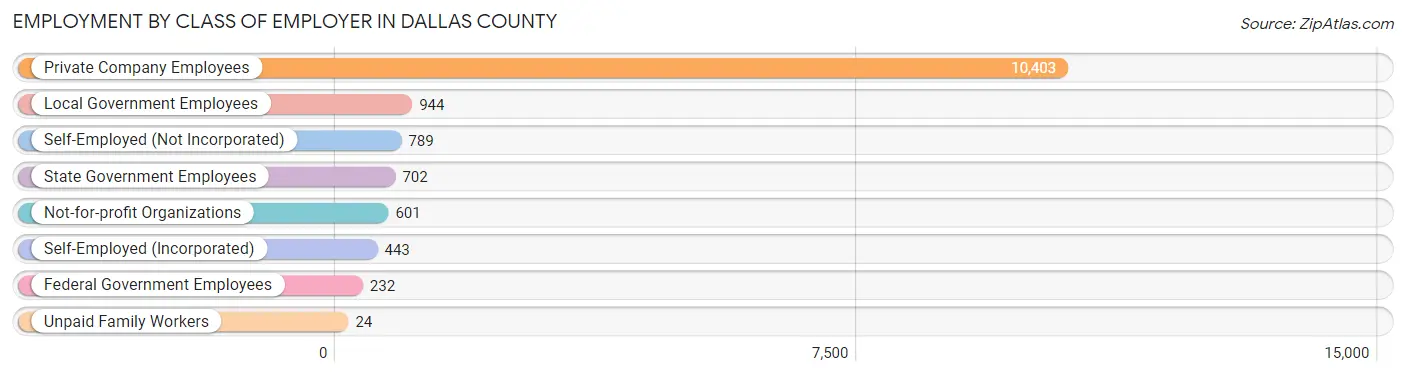
| Employer Class | # Employees | % Employees |
| Private Company Employees | 10,403 | 73.6% |
| Self-Employed (Incorporated) | 443 | 3.1% |
| Self-Employed (Not Incorporated) | 789 | 5.6% |
| Not-for-profit Organizations | 601 | 4.3% |
| Local Government Employees | 944 | 6.7% |
| State Government Employees | 702 | 5.0% |
| Federal Government Employees | 232 | 1.6% |
| Unpaid Family Workers | 24 | 0.2% |
| Total | 14,138 | 100.0% |
Employment Status by Age in Dallas County
According to the labor force statistics for Dallas County, out of the total population over 16 years of age (30,351), 52.1% or 15,813 individuals are in the labor force, with 9.1% or 1,439 of them unemployed. The age group with the highest labor force participation rate is 30 to 34 years, with 84.6% or 1,824 individuals in the labor force. Within the labor force, the 20 to 24 years age range has the highest percentage of unemployed individuals, with 23.4% or 403 of them being unemployed.
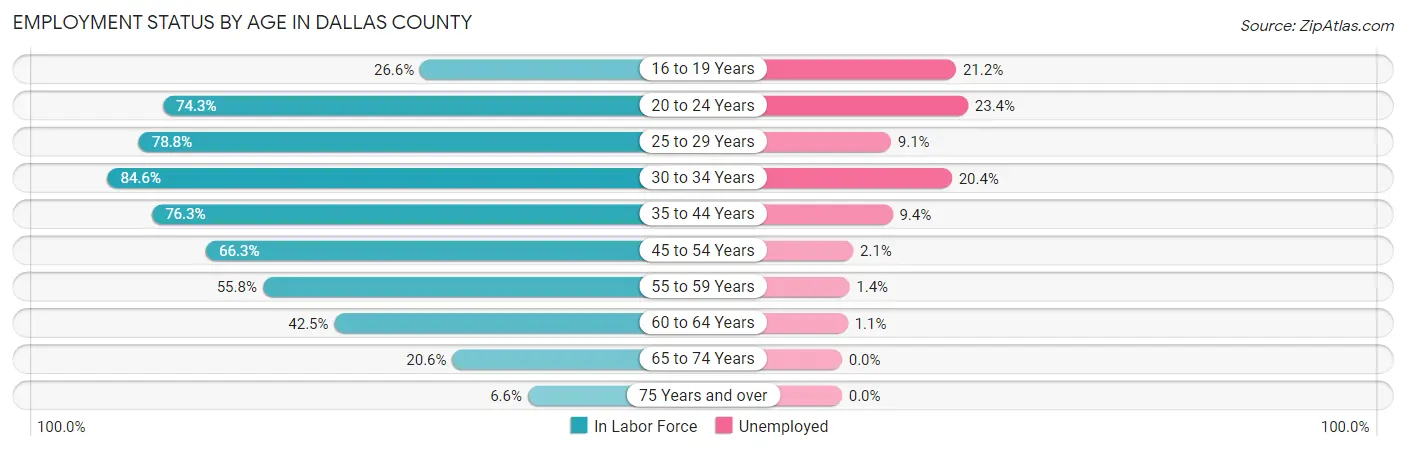
| Age Bracket | In Labor Force | Unemployed |
| 16 to 19 Years | 545 (26.6%) | 116 (21.2%) |
| 20 to 24 Years | 1,722 (74.3%) | 403 (23.4%) |
| 25 to 29 Years | 1,705 (78.8%) | 155 (9.1%) |
| 30 to 34 Years | 1,824 (84.6%) | 372 (20.4%) |
| 35 to 44 Years | 3,221 (76.3%) | 303 (9.4%) |
| 45 to 54 Years | 2,953 (66.3%) | 62 (2.1%) |
| 55 to 59 Years | 1,469 (55.8%) | 21 (1.4%) |
| 60 to 64 Years | 1,239 (42.5%) | 14 (1.1%) |
| 65 to 74 Years | 922 (20.6%) | 0 (0.0%) |
| 75 Years and over | 196 (6.6%) | 0 (0.0%) |
| Total | 15,813 (52.1%) | 1,439 (9.1%) |
Employment Status by Educational Attainment in Dallas County
According to labor force statistics for Dallas County, 66.9% of individuals (12,406) out of the total population between 25 and 64 years of age (18,544) are in the labor force, with 7.5% or 930 of them being unemployed. The group with the highest labor force participation rate are those with the educational attainment of bachelor's degree or higher, with 88.6% or 2,502 individuals in the labor force. Within the labor force, individuals with less than high school education have the highest percentage of unemployment, with 11.8% or 114 of them being unemployed.
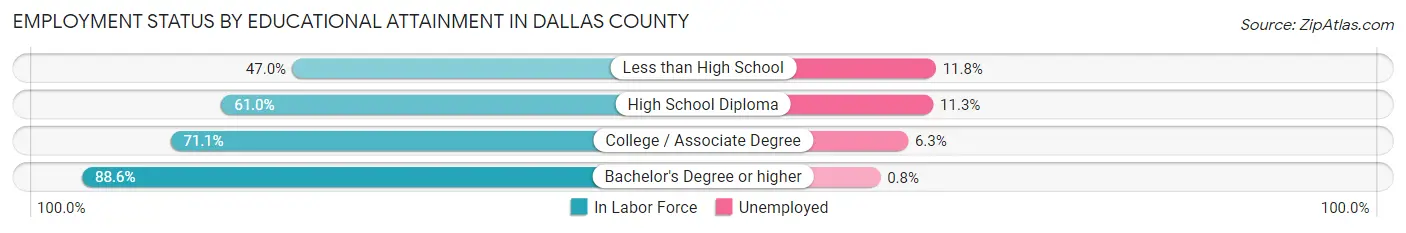
| Educational Attainment | In Labor Force | Unemployed |
| Less than High School | 970 (47.0%) | 244 (11.8%) |
| High School Diploma | 4,599 (61.0%) | 852 (11.3%) |
| College / Associate Degree | 4,349 (71.1%) | 385 (6.3%) |
| Bachelor's Degree or higher | 2,502 (88.6%) | 23 (0.8%) |
| Total | 12,406 (66.9%) | 1,391 (7.5%) |
Employment Occupations by Sex in Dallas County
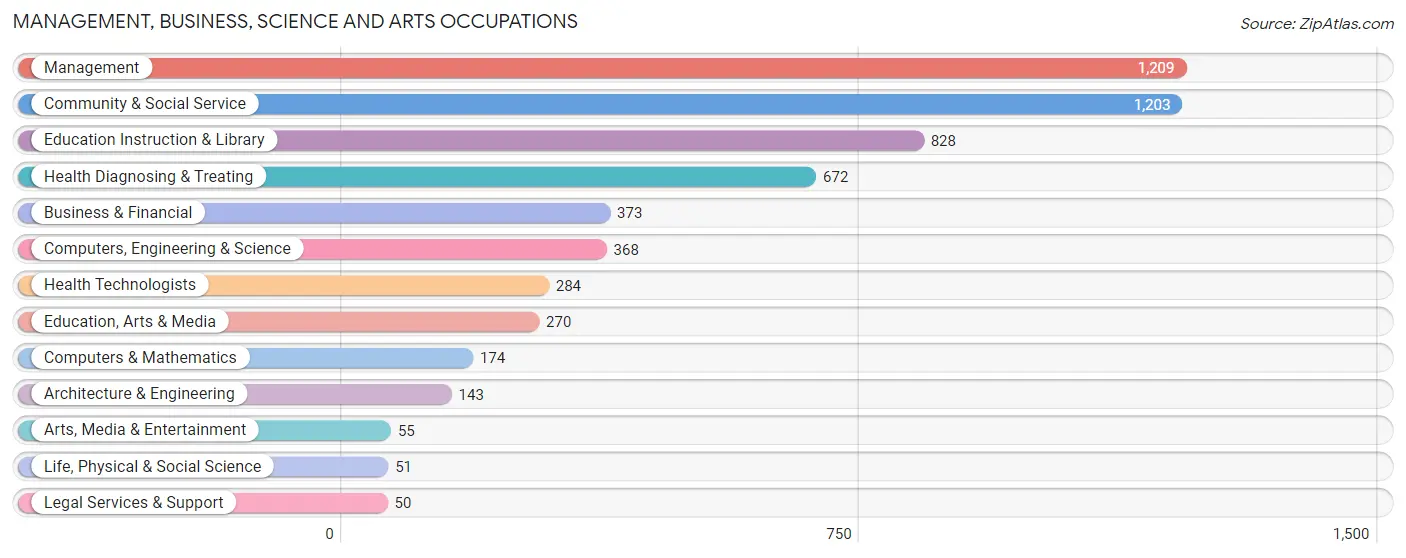
Management, Business, Science and Arts Occupations
The most common Management, Business, Science and Arts occupations in Dallas County are Management (1,209 | 8.4%), Community & Social Service (1,203 | 8.4%), Education Instruction & Library (828 | 5.8%), Health Diagnosing & Treating (672 | 4.7%), and Business & Financial (373 | 2.6%).
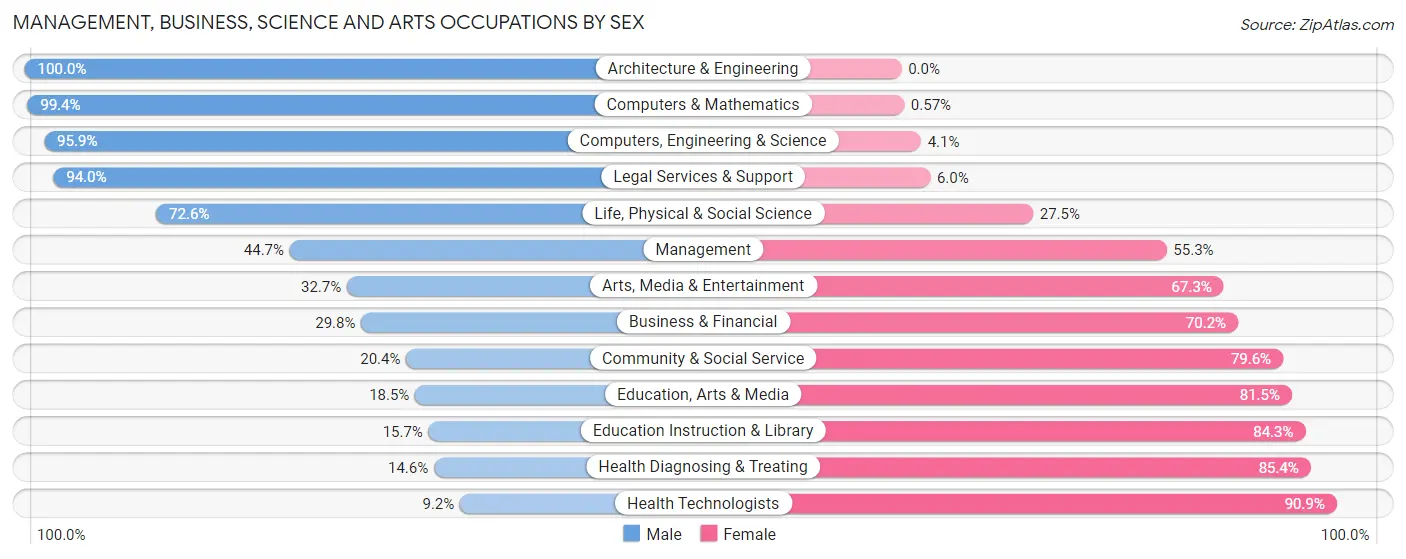
Management, Business, Science and Arts Occupations by Sex
Within the Management, Business, Science and Arts occupations in Dallas County, the most male-oriented occupations are Architecture & Engineering (100.0%), Computers & Mathematics (99.4%), and Computers, Engineering & Science (95.9%), while the most female-oriented occupations are Health Technologists (90.8%), Health Diagnosing & Treating (85.4%), and Education Instruction & Library (84.3%).
| Occupation | Male | Female |
| Management | 540 (44.7%) | 669 (55.3%) |
| Business & Financial | 111 (29.8%) | 262 (70.2%) |
| Computers, Engineering & Science | 353 (95.9%) | 15 (4.1%) |
| Computers & Mathematics | 173 (99.4%) | 1 (0.6%) |
| Architecture & Engineering | 143 (100.0%) | 0 (0.0%) |
| Life, Physical & Social Science | 37 (72.6%) | 14 (27.5%) |
| Community & Social Service | 245 (20.4%) | 958 (79.6%) |
| Education, Arts & Media | 50 (18.5%) | 220 (81.5%) |
| Legal Services & Support | 47 (94.0%) | 3 (6.0%) |
| Education Instruction & Library | 130 (15.7%) | 698 (84.3%) |
| Arts, Media & Entertainment | 18 (32.7%) | 37 (67.3%) |
| Health Diagnosing & Treating | 98 (14.6%) | 574 (85.4%) |
| Health Technologists | 26 (9.1%) | 258 (90.8%) |
| Total (Category) | 1,347 (35.2%) | 2,478 (64.8%) |
| Total (Overall) | 6,935 (48.3%) | 7,424 (51.7%) |
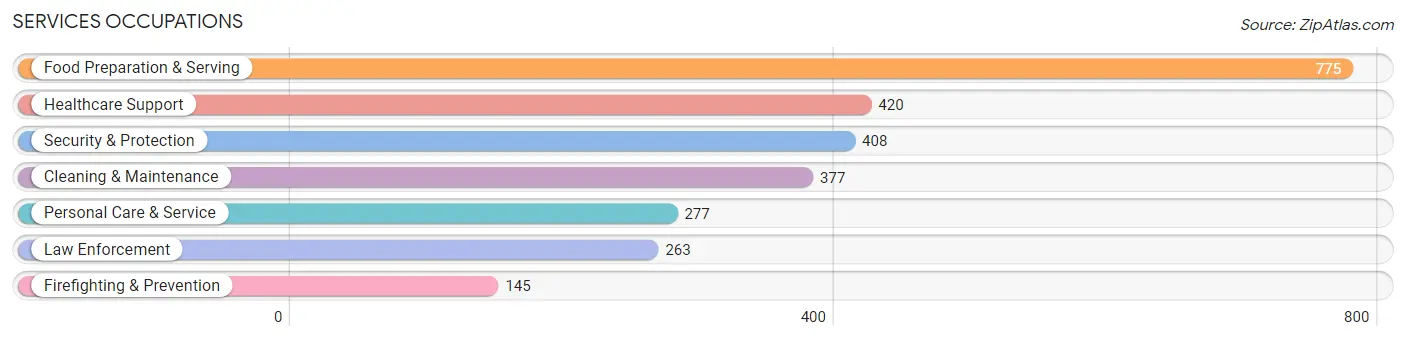
Services Occupations
The most common Services occupations in Dallas County are Food Preparation & Serving (775 | 5.4%), Healthcare Support (420 | 2.9%), Security & Protection (408 | 2.8%), Cleaning & Maintenance (377 | 2.6%), and Personal Care & Service (277 | 1.9%).
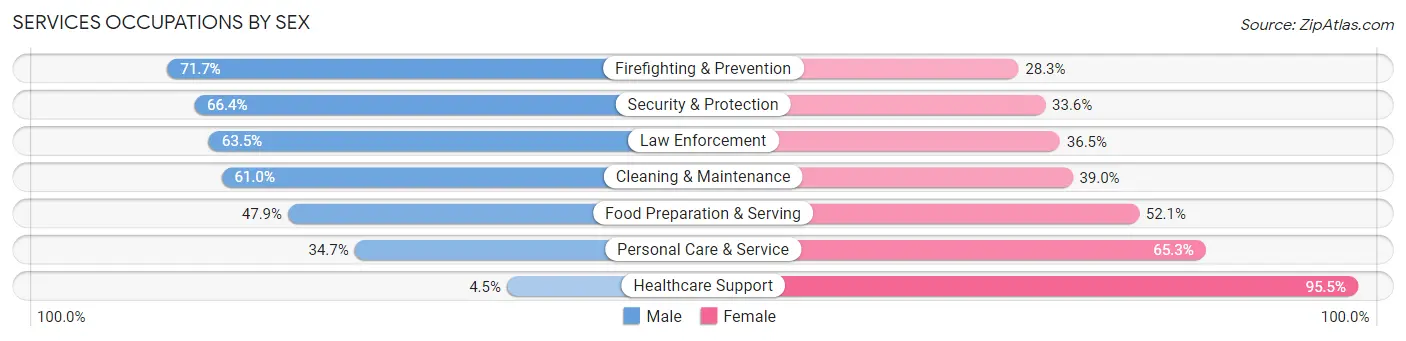
Services Occupations by Sex
Within the Services occupations in Dallas County, the most male-oriented occupations are Firefighting & Prevention (71.7%), Security & Protection (66.4%), and Law Enforcement (63.5%), while the most female-oriented occupations are Healthcare Support (95.5%), Personal Care & Service (65.3%), and Food Preparation & Serving (52.1%).
| Occupation | Male | Female |
| Healthcare Support | 19 (4.5%) | 401 (95.5%) |
| Security & Protection | 271 (66.4%) | 137 (33.6%) |
| Firefighting & Prevention | 104 (71.7%) | 41 (28.3%) |
| Law Enforcement | 167 (63.5%) | 96 (36.5%) |
| Food Preparation & Serving | 371 (47.9%) | 404 (52.1%) |
| Cleaning & Maintenance | 230 (61.0%) | 147 (39.0%) |
| Personal Care & Service | 96 (34.7%) | 181 (65.3%) |
| Total (Category) | 987 (43.7%) | 1,270 (56.3%) |
| Total (Overall) | 6,935 (48.3%) | 7,424 (51.7%) |
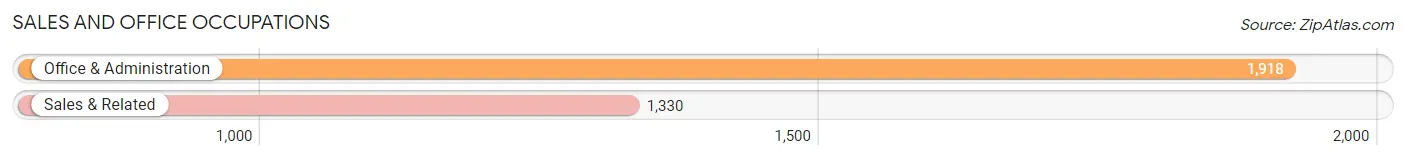
Sales and Office Occupations
The most common Sales and Office occupations in Dallas County are Office & Administration (1,918 | 13.4%), and Sales & Related (1,330 | 9.3%).
Sales and Office Occupations by Sex

| Occupation | Male | Female |
| Sales & Related | 506 (38.1%) | 824 (62.0%) |
| Office & Administration | 312 (16.3%) | 1,606 (83.7%) |
| Total (Category) | 818 (25.2%) | 2,430 (74.8%) |
| Total (Overall) | 6,935 (48.3%) | 7,424 (51.7%) |
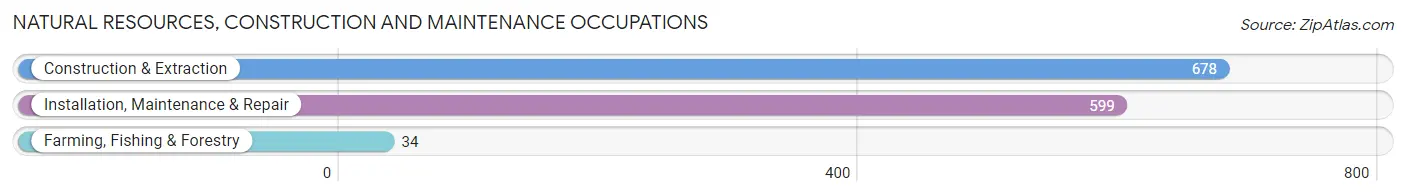
Natural Resources, Construction and Maintenance Occupations
The most common Natural Resources, Construction and Maintenance occupations in Dallas County are Construction & Extraction (678 | 4.7%), Installation, Maintenance & Repair (599 | 4.2%), and Farming, Fishing & Forestry (34 | 0.2%).
Natural Resources, Construction and Maintenance Occupations by Sex
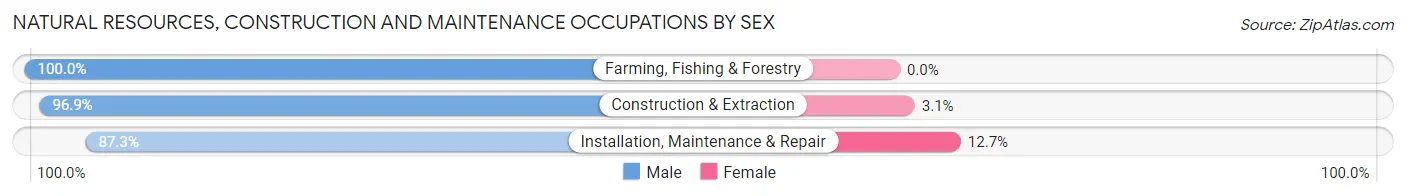
| Occupation | Male | Female |
| Farming, Fishing & Forestry | 34 (100.0%) | 0 (0.0%) |
| Construction & Extraction | 657 (96.9%) | 21 (3.1%) |
| Installation, Maintenance & Repair | 523 (87.3%) | 76 (12.7%) |
| Total (Category) | 1,214 (92.6%) | 97 (7.4%) |
| Total (Overall) | 6,935 (48.3%) | 7,424 (51.7%) |
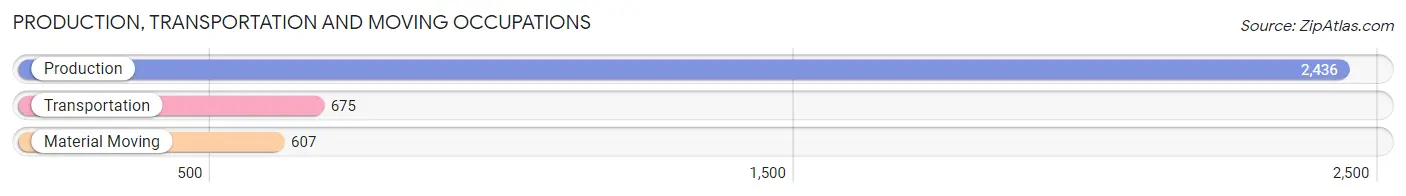
Production, Transportation and Moving Occupations
The most common Production, Transportation and Moving occupations in Dallas County are Production (2,436 | 17.0%), Transportation (675 | 4.7%), and Material Moving (607 | 4.2%).
Production, Transportation and Moving Occupations by Sex
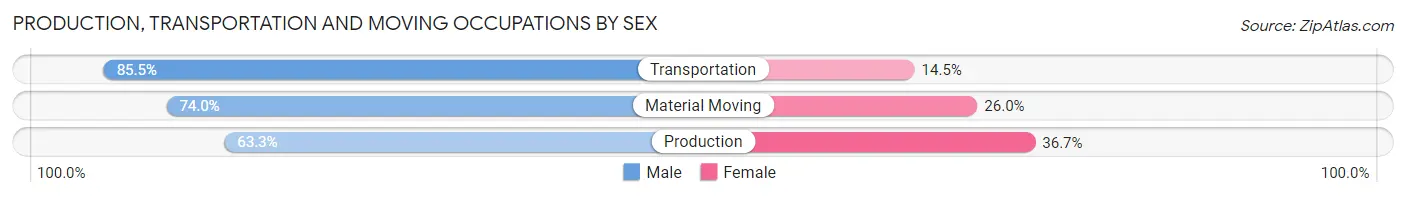
| Occupation | Male | Female |
| Production | 1,543 (63.3%) | 893 (36.7%) |
| Transportation | 577 (85.5%) | 98 (14.5%) |
| Material Moving | 449 (74.0%) | 158 (26.0%) |
| Total (Category) | 2,569 (69.1%) | 1,149 (30.9%) |
| Total (Overall) | 6,935 (48.3%) | 7,424 (51.7%) |
Employment Industries by Sex in Dallas County
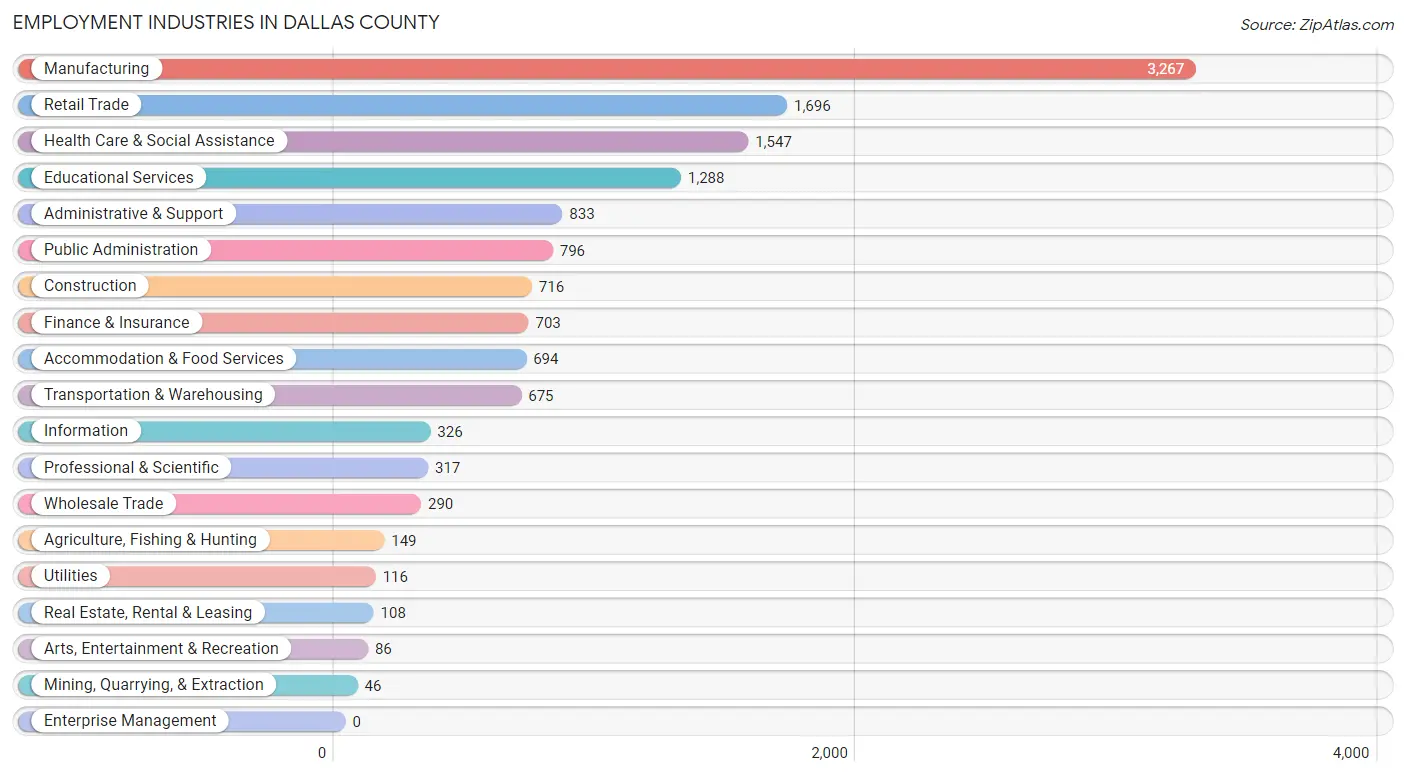
Employment Industries in Dallas County
The major employment industries in Dallas County include Manufacturing (3,267 | 22.8%), Retail Trade (1,696 | 11.8%), Health Care & Social Assistance (1,547 | 10.8%), Educational Services (1,288 | 9.0%), and Administrative & Support (833 | 5.8%).
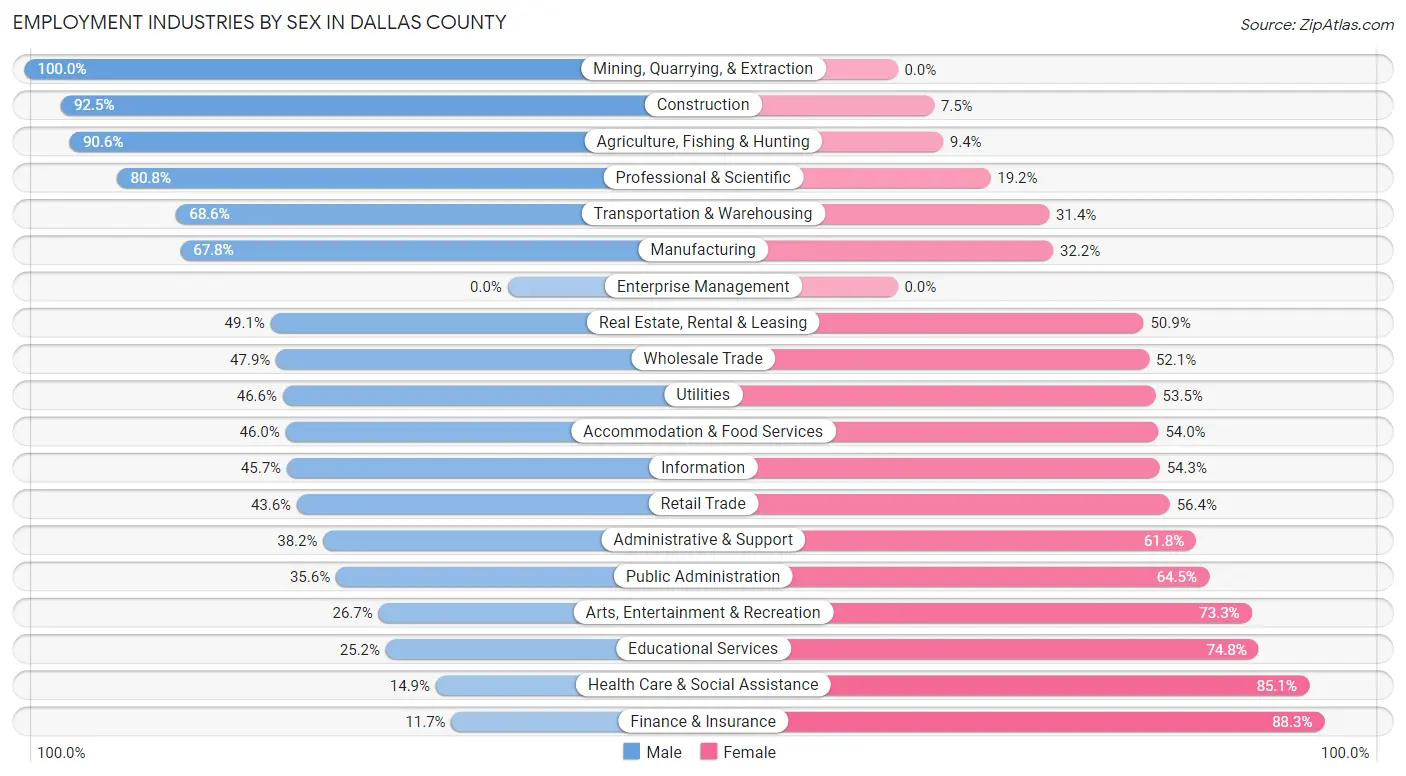
Employment Industries by Sex in Dallas County
The Dallas County industries that see more men than women are Mining, Quarrying, & Extraction (100.0%), Construction (92.5%), and Agriculture, Fishing & Hunting (90.6%), whereas the industries that tend to have a higher number of women are Finance & Insurance (88.3%), Health Care & Social Assistance (85.1%), and Educational Services (74.8%).
| Industry | Male | Female |
| Agriculture, Fishing & Hunting | 135 (90.6%) | 14 (9.4%) |
| Mining, Quarrying, & Extraction | 46 (100.0%) | 0 (0.0%) |
| Construction | 662 (92.5%) | 54 (7.5%) |
| Manufacturing | 2,214 (67.8%) | 1,053 (32.2%) |
| Wholesale Trade | 139 (47.9%) | 151 (52.1%) |
| Retail Trade | 740 (43.6%) | 956 (56.4%) |
| Transportation & Warehousing | 463 (68.6%) | 212 (31.4%) |
| Utilities | 54 (46.6%) | 62 (53.4%) |
| Information | 149 (45.7%) | 177 (54.3%) |
| Finance & Insurance | 82 (11.7%) | 621 (88.3%) |
| Real Estate, Rental & Leasing | 53 (49.1%) | 55 (50.9%) |
| Professional & Scientific | 256 (80.8%) | 61 (19.2%) |
| Enterprise Management | 0 (0.0%) | 0 (0.0%) |
| Administrative & Support | 318 (38.2%) | 515 (61.8%) |
| Educational Services | 325 (25.2%) | 963 (74.8%) |
| Health Care & Social Assistance | 230 (14.9%) | 1,317 (85.1%) |
| Arts, Entertainment & Recreation | 23 (26.7%) | 63 (73.3%) |
| Accommodation & Food Services | 319 (46.0%) | 375 (54.0%) |
| Public Administration | 283 (35.5%) | 513 (64.4%) |
| Total | 6,935 (48.3%) | 7,424 (51.7%) |
Education in Dallas County
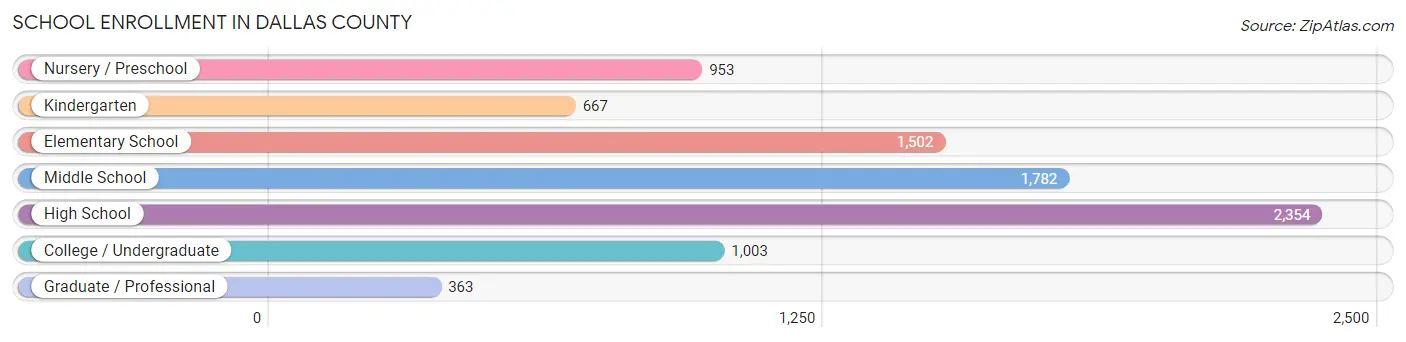
School Enrollment in Dallas County
The most common levels of schooling among the 8,624 students in Dallas County are high school (2,354 | 27.3%), middle school (1,782 | 20.7%), and elementary school (1,502 | 17.4%).
| School Level | # Students | % Students |
| Nursery / Preschool | 953 | 11.1% |
| Kindergarten | 667 | 7.7% |
| Elementary School | 1,502 | 17.4% |
| Middle School | 1,782 | 20.7% |
| High School | 2,354 | 27.3% |
| College / Undergraduate | 1,003 | 11.6% |
| Graduate / Professional | 363 | 4.2% |
| Total | 8,624 | 100.0% |
School Enrollment by Age by Funding Source in Dallas County
Out of a total of 8,624 students who are enrolled in schools in Dallas County, 1,397 (16.2%) attend a private institution, while the remaining 7,227 (83.8%) are enrolled in public schools. The age group of 3 to 4 year olds has the highest likelihood of being enrolled in private schools, with 251 (36.1% in the age bracket) enrolled. Conversely, the age group of 20 to 24 year olds has the lowest likelihood of being enrolled in a private school, with 471 (97.5% in the age bracket) attending a public institution.
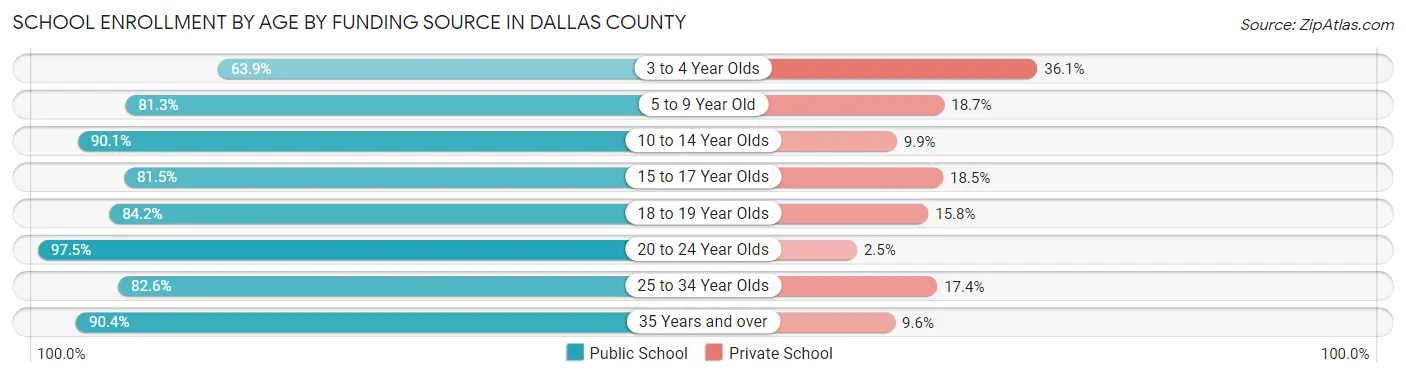
| Age Bracket | Public School | Private School |
| 3 to 4 Year Olds | 445 (63.9%) | 251 (36.1%) |
| 5 to 9 Year Old | 1,908 (81.3%) | 440 (18.7%) |
| 10 to 14 Year Olds | 2,119 (90.1%) | 233 (9.9%) |
| 15 to 17 Year Olds | 1,312 (81.5%) | 298 (18.5%) |
| 18 to 19 Year Olds | 465 (84.2%) | 87 (15.8%) |
| 20 to 24 Year Olds | 471 (97.5%) | 12 (2.5%) |
| 25 to 34 Year Olds | 180 (82.6%) | 38 (17.4%) |
| 35 Years and over | 330 (90.4%) | 35 (9.6%) |
| Total | 7,227 (83.8%) | 1,397 (16.2%) |
Educational Attainment by Field of Study in Dallas County
Business (1,166 | 26.6%), education (1,116 | 25.5%), science & technology (555 | 12.7%), arts & humanities (330 | 7.5%), and social sciences (314 | 7.2%) are the most common fields of study among 4,378 individuals in Dallas County who have obtained a bachelor's degree or higher.
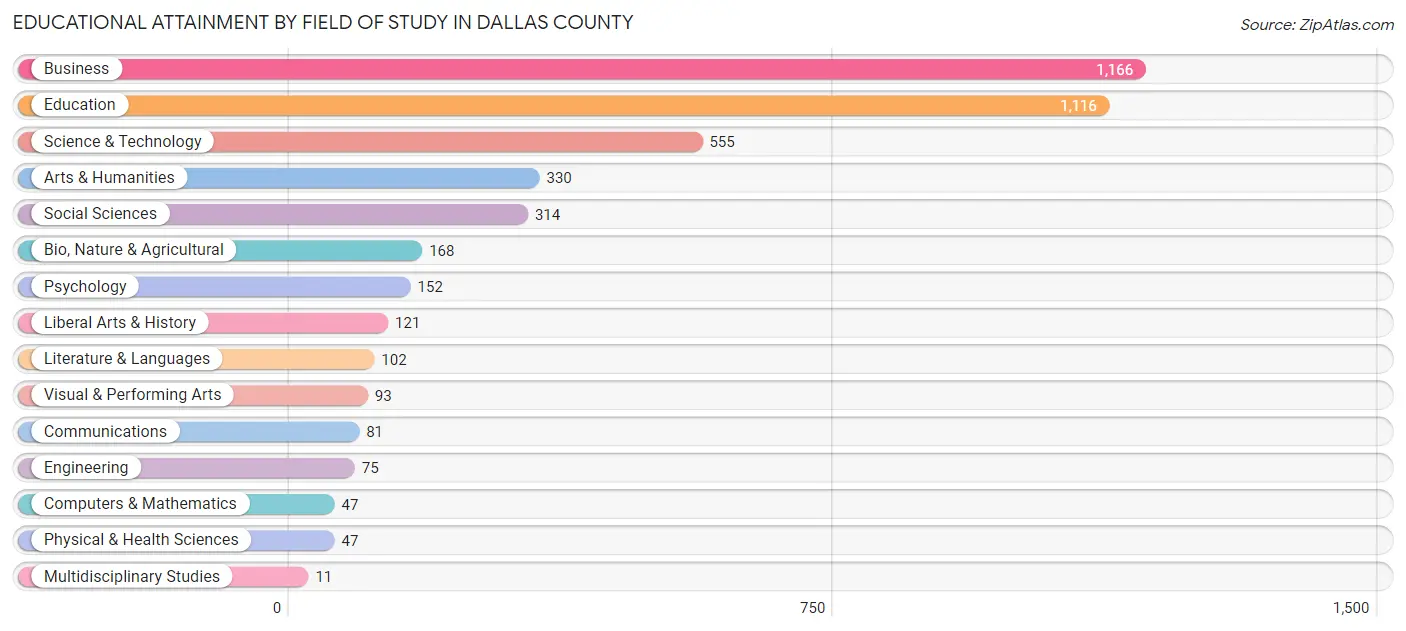
| Field of Study | # Graduates | % Graduates |
| Computers & Mathematics | 47 | 1.1% |
| Bio, Nature & Agricultural | 168 | 3.8% |
| Physical & Health Sciences | 47 | 1.1% |
| Psychology | 152 | 3.5% |
| Social Sciences | 314 | 7.2% |
| Engineering | 75 | 1.7% |
| Multidisciplinary Studies | 11 | 0.3% |
| Science & Technology | 555 | 12.7% |
| Business | 1,166 | 26.6% |
| Education | 1,116 | 25.5% |
| Literature & Languages | 102 | 2.3% |
| Liberal Arts & History | 121 | 2.8% |
| Visual & Performing Arts | 93 | 2.1% |
| Communications | 81 | 1.8% |
| Arts & Humanities | 330 | 7.5% |
| Total | 4,378 | 100.0% |
Transportation & Commute in Dallas County
Vehicle Availability by Sex in Dallas County
The most prevalent vehicle ownership categories in Dallas County are males with 2 vehicles (2,399, accounting for 35.4%) and females with 2 vehicles (2,585, making up 32.8%).
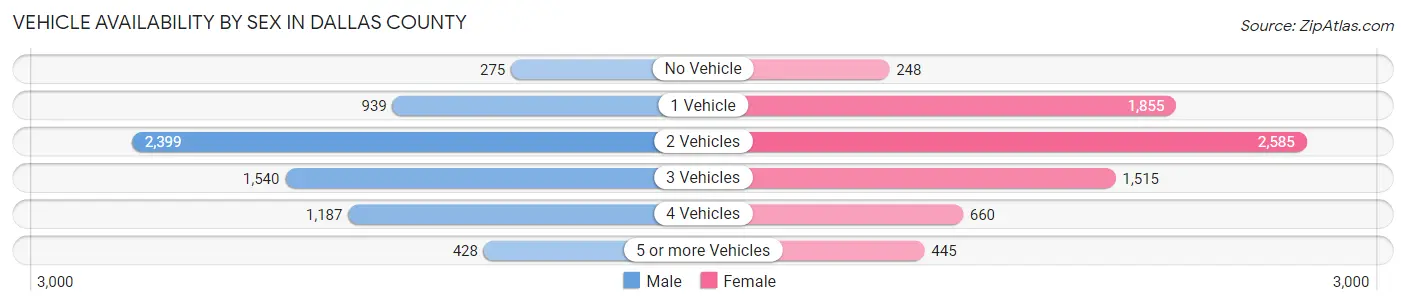
| Vehicles Available | Male | Female |
| No Vehicle | 275 (4.1%) | 248 (3.4%) |
| 1 Vehicle | 939 (13.9%) | 1,855 (25.4%) |
| 2 Vehicles | 2,399 (35.4%) | 2,585 (35.4%) |
| 3 Vehicles | 1,540 (22.8%) | 1,515 (20.7%) |
| 4 Vehicles | 1,187 (17.5%) | 660 (9.0%) |
| 5 or more Vehicles | 428 (6.3%) | 445 (6.1%) |
| Total | 6,768 (100.0%) | 7,308 (100.0%) |
Commute Time in Dallas County
The most frequently occuring commute durations in Dallas County are 15 to 19 minutes (3,062 commuters, 22.6%), 10 to 14 minutes (1,837 commuters, 13.6%), and 20 to 24 minutes (1,768 commuters, 13.0%).
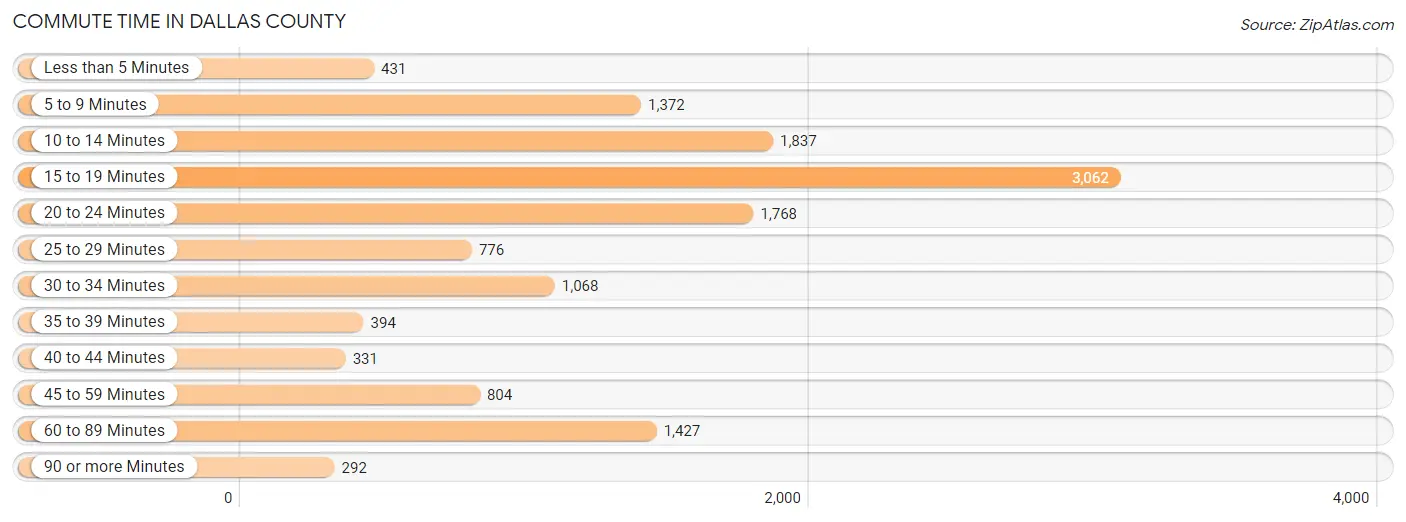
| Commute Time | # Commuters | % Commuters |
| Less than 5 Minutes | 431 | 3.2% |
| 5 to 9 Minutes | 1,372 | 10.1% |
| 10 to 14 Minutes | 1,837 | 13.6% |
| 15 to 19 Minutes | 3,062 | 22.6% |
| 20 to 24 Minutes | 1,768 | 13.0% |
| 25 to 29 Minutes | 776 | 5.7% |
| 30 to 34 Minutes | 1,068 | 7.9% |
| 35 to 39 Minutes | 394 | 2.9% |
| 40 to 44 Minutes | 331 | 2.4% |
| 45 to 59 Minutes | 804 | 5.9% |
| 60 to 89 Minutes | 1,427 | 10.5% |
| 90 or more Minutes | 292 | 2.1% |
Commute Time by Sex in Dallas County
The most common commute times in Dallas County are 15 to 19 minutes (1,546 commuters, 23.6%) for males and 15 to 19 minutes (1,516 commuters, 21.7%) for females.
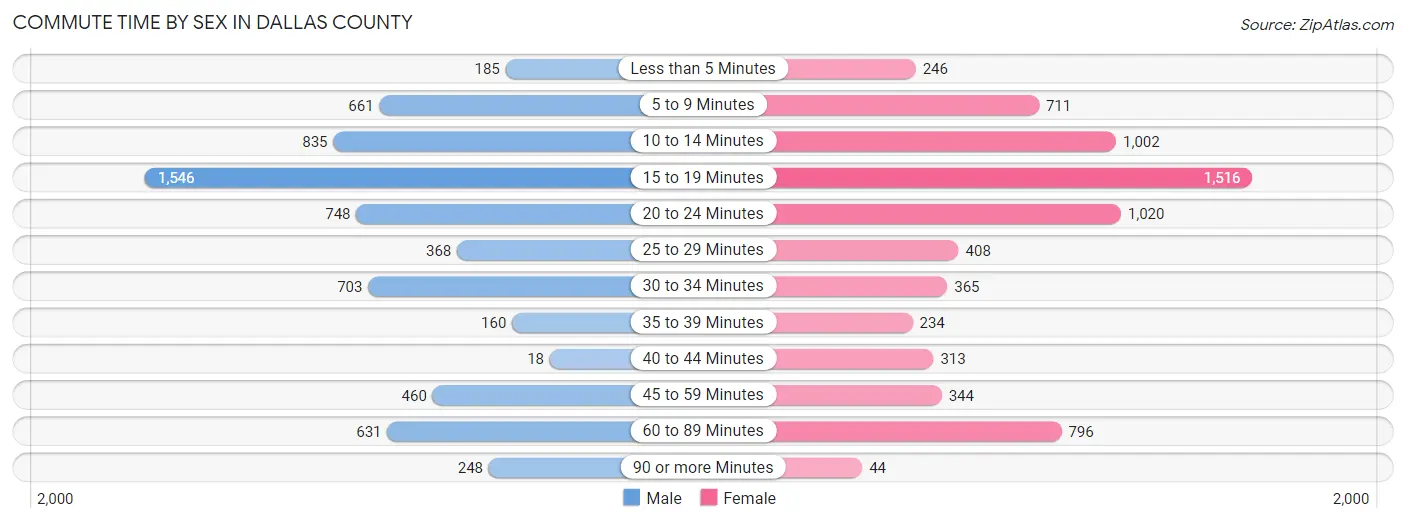
| Commute Time | Male | Female |
| Less than 5 Minutes | 185 (2.8%) | 246 (3.5%) |
| 5 to 9 Minutes | 661 (10.1%) | 711 (10.2%) |
| 10 to 14 Minutes | 835 (12.7%) | 1,002 (14.3%) |
| 15 to 19 Minutes | 1,546 (23.6%) | 1,516 (21.7%) |
| 20 to 24 Minutes | 748 (11.4%) | 1,020 (14.6%) |
| 25 to 29 Minutes | 368 (5.6%) | 408 (5.8%) |
| 30 to 34 Minutes | 703 (10.7%) | 365 (5.2%) |
| 35 to 39 Minutes | 160 (2.4%) | 234 (3.3%) |
| 40 to 44 Minutes | 18 (0.3%) | 313 (4.5%) |
| 45 to 59 Minutes | 460 (7.0%) | 344 (4.9%) |
| 60 to 89 Minutes | 631 (9.6%) | 796 (11.4%) |
| 90 or more Minutes | 248 (3.8%) | 44 (0.6%) |
Time of Departure to Work by Sex in Dallas County
The most frequent times of departure to work in Dallas County are 7:00 AM to 7:29 AM (1,101, 16.8%) for males and 7:30 AM to 7:59 AM (1,152, 16.5%) for females.
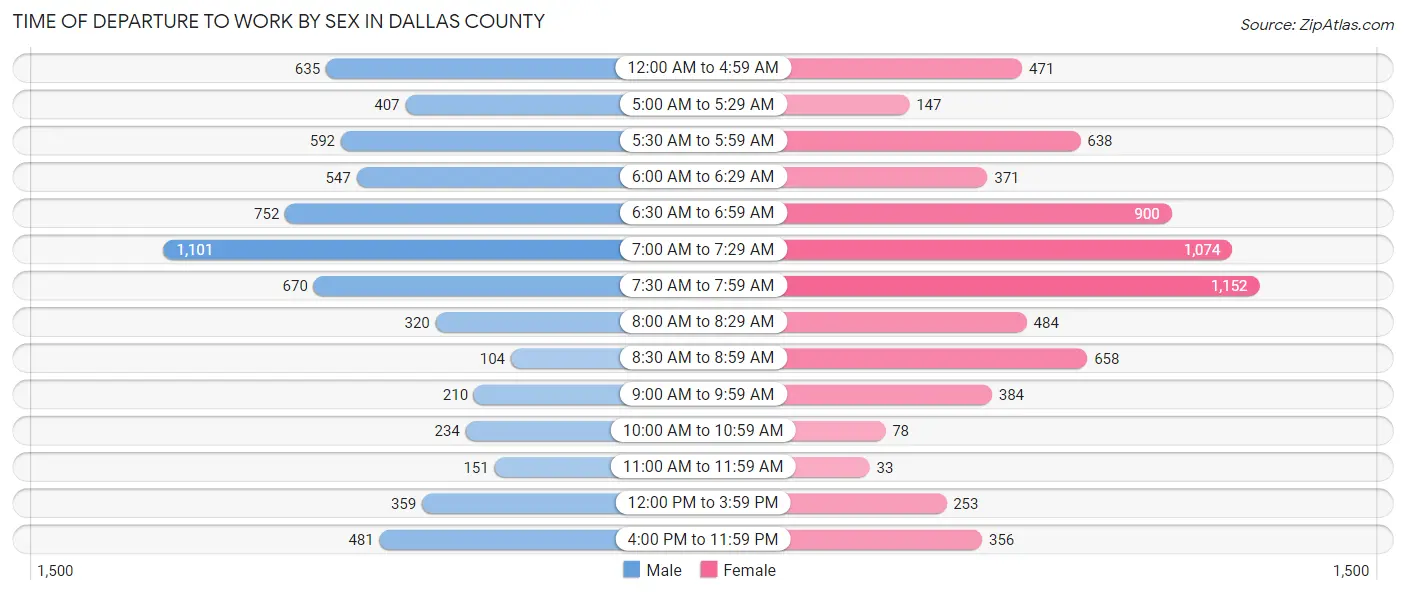
| Time of Departure | Male | Female |
| 12:00 AM to 4:59 AM | 635 (9.7%) | 471 (6.7%) |
| 5:00 AM to 5:29 AM | 407 (6.2%) | 147 (2.1%) |
| 5:30 AM to 5:59 AM | 592 (9.0%) | 638 (9.1%) |
| 6:00 AM to 6:29 AM | 547 (8.3%) | 371 (5.3%) |
| 6:30 AM to 6:59 AM | 752 (11.5%) | 900 (12.9%) |
| 7:00 AM to 7:29 AM | 1,101 (16.8%) | 1,074 (15.3%) |
| 7:30 AM to 7:59 AM | 670 (10.2%) | 1,152 (16.5%) |
| 8:00 AM to 8:29 AM | 320 (4.9%) | 484 (6.9%) |
| 8:30 AM to 8:59 AM | 104 (1.6%) | 658 (9.4%) |
| 9:00 AM to 9:59 AM | 210 (3.2%) | 384 (5.5%) |
| 10:00 AM to 10:59 AM | 234 (3.6%) | 78 (1.1%) |
| 11:00 AM to 11:59 AM | 151 (2.3%) | 33 (0.5%) |
| 12:00 PM to 3:59 PM | 359 (5.5%) | 253 (3.6%) |
| 4:00 PM to 11:59 PM | 481 (7.3%) | 356 (5.1%) |
| Total | 6,563 (100.0%) | 6,999 (100.0%) |
Housing Occupancy in Dallas County
Occupancy by Ownership in Dallas County
Of the total 14,753 dwellings in Dallas County, owner-occupied units account for 9,060 (61.4%), while renter-occupied units make up 5,693 (38.6%).
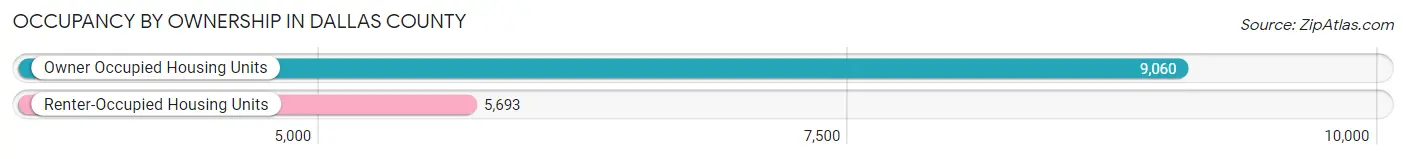
| Occupancy | # Housing Units | % Housing Units |
| Owner Occupied Housing Units | 9,060 | 61.4% |
| Renter-Occupied Housing Units | 5,693 | 38.6% |
| Total Occupied Housing Units | 14,753 | 100.0% |
Occupancy by Household Size in Dallas County
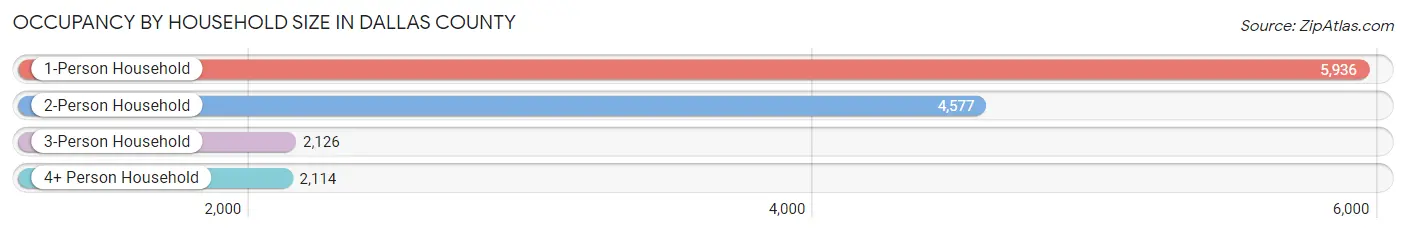
| Household Size | # Housing Units | % Housing Units |
| 1-Person Household | 5,936 | 40.2% |
| 2-Person Household | 4,577 | 31.0% |
| 3-Person Household | 2,126 | 14.4% |
| 4+ Person Household | 2,114 | 14.3% |
| Total Housing Units | 14,753 | 100.0% |
Occupancy by Ownership by Household Size in Dallas County
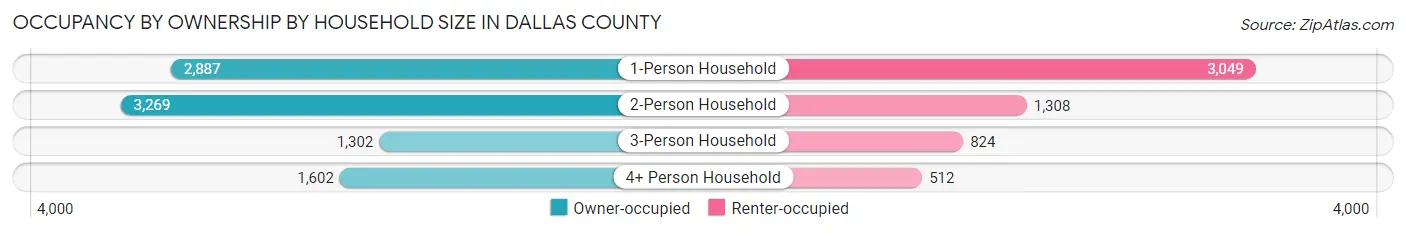
| Household Size | Owner-occupied | Renter-occupied |
| 1-Person Household | 2,887 (48.6%) | 3,049 (51.4%) |
| 2-Person Household | 3,269 (71.4%) | 1,308 (28.6%) |
| 3-Person Household | 1,302 (61.2%) | 824 (38.8%) |
| 4+ Person Household | 1,602 (75.8%) | 512 (24.2%) |
| Total Housing Units | 9,060 (61.4%) | 5,693 (38.6%) |
Occupancy by Educational Attainment in Dallas County
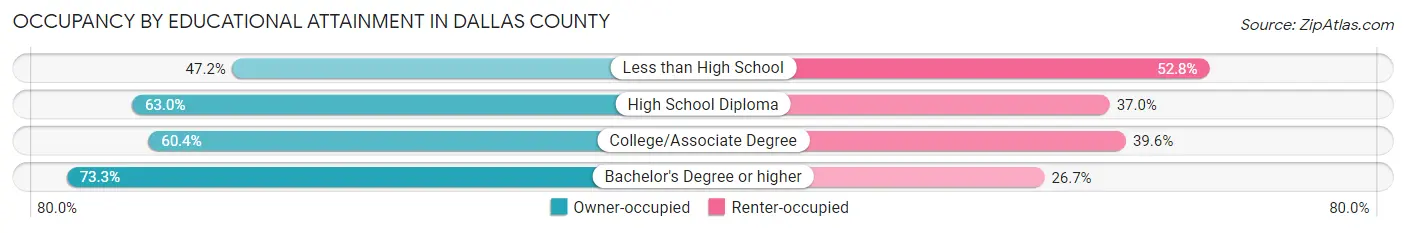
| Household Size | Owner-occupied | Renter-occupied |
| Less than High School | 1,056 (47.2%) | 1,183 (52.8%) |
| High School Diploma | 3,699 (63.0%) | 2,176 (37.0%) |
| College/Associate Degree | 2,624 (60.4%) | 1,722 (39.6%) |
| Bachelor's Degree or higher | 1,681 (73.3%) | 612 (26.7%) |
Occupancy by Age of Householder in Dallas County
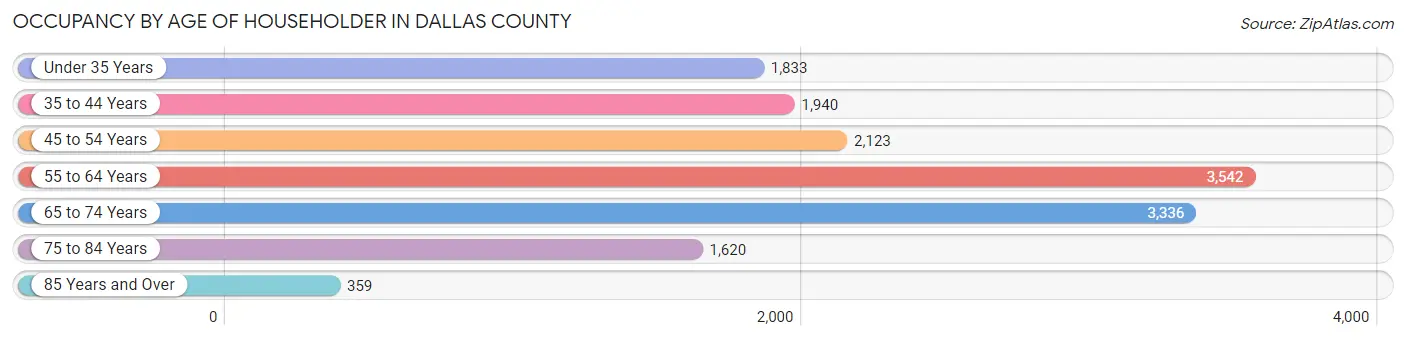
| Age Bracket | # Households | % Households |
| Under 35 Years | 1,833 | 12.4% |
| 35 to 44 Years | 1,940 | 13.2% |
| 45 to 54 Years | 2,123 | 14.4% |
| 55 to 64 Years | 3,542 | 24.0% |
| 65 to 74 Years | 3,336 | 22.6% |
| 75 to 84 Years | 1,620 | 11.0% |
| 85 Years and Over | 359 | 2.4% |
| Total | 14,753 | 100.0% |
Housing Finances in Dallas County
Median Income by Occupancy in Dallas County
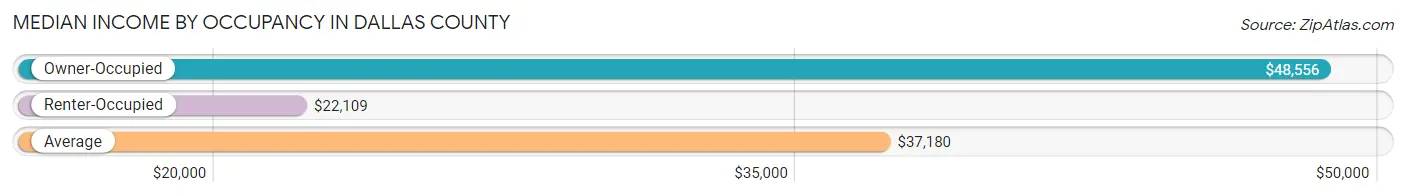
| Occupancy Type | # Households | Median Income |
| Owner-Occupied | 9,060 (61.4%) | $48,556 |
| Renter-Occupied | 5,693 (38.6%) | $22,109 |
| Average | 14,753 (100.0%) | $37,180 |
Occupancy by Householder Income Bracket in Dallas County
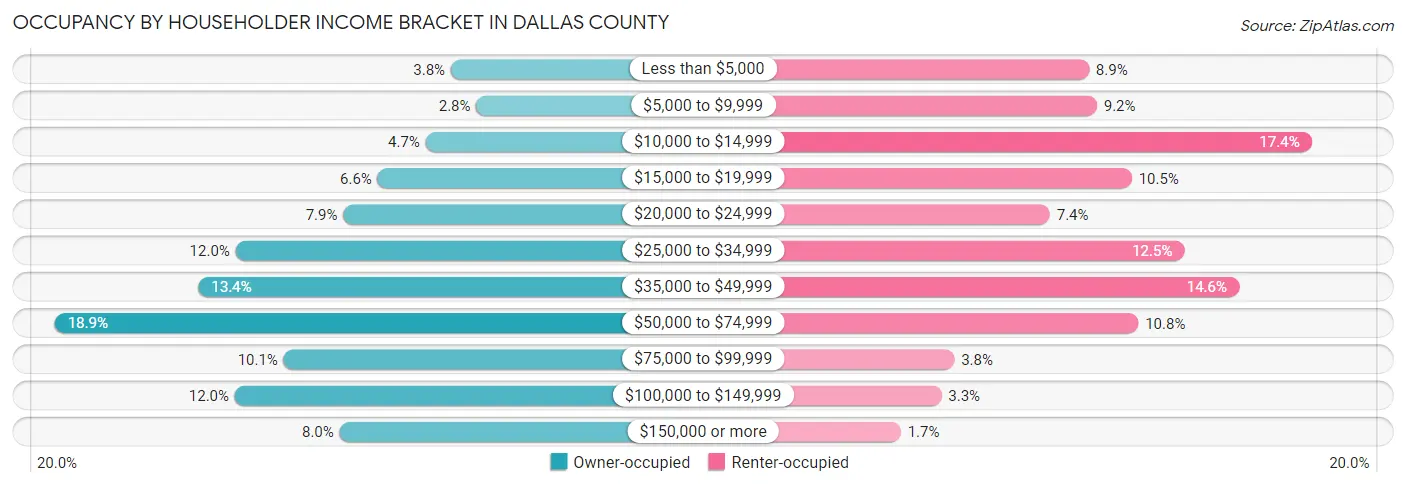
| Income Bracket | Owner-occupied | Renter-occupied |
| Less than $5,000 | 341 (3.8%) | 506 (8.9%) |
| $5,000 to $9,999 | 253 (2.8%) | 523 (9.2%) |
| $10,000 to $14,999 | 428 (4.7%) | 989 (17.4%) |
| $15,000 to $19,999 | 593 (6.6%) | 599 (10.5%) |
| $20,000 to $24,999 | 712 (7.9%) | 421 (7.4%) |
| $25,000 to $34,999 | 1,084 (12.0%) | 713 (12.5%) |
| $35,000 to $49,999 | 1,212 (13.4%) | 831 (14.6%) |
| $50,000 to $74,999 | 1,708 (18.9%) | 613 (10.8%) |
| $75,000 to $99,999 | 918 (10.1%) | 214 (3.8%) |
| $100,000 to $149,999 | 1,086 (12.0%) | 186 (3.3%) |
| $150,000 or more | 725 (8.0%) | 98 (1.7%) |
| Total | 9,060 (100.0%) | 5,693 (100.0%) |
Monthly Housing Cost Tiers in Dallas County
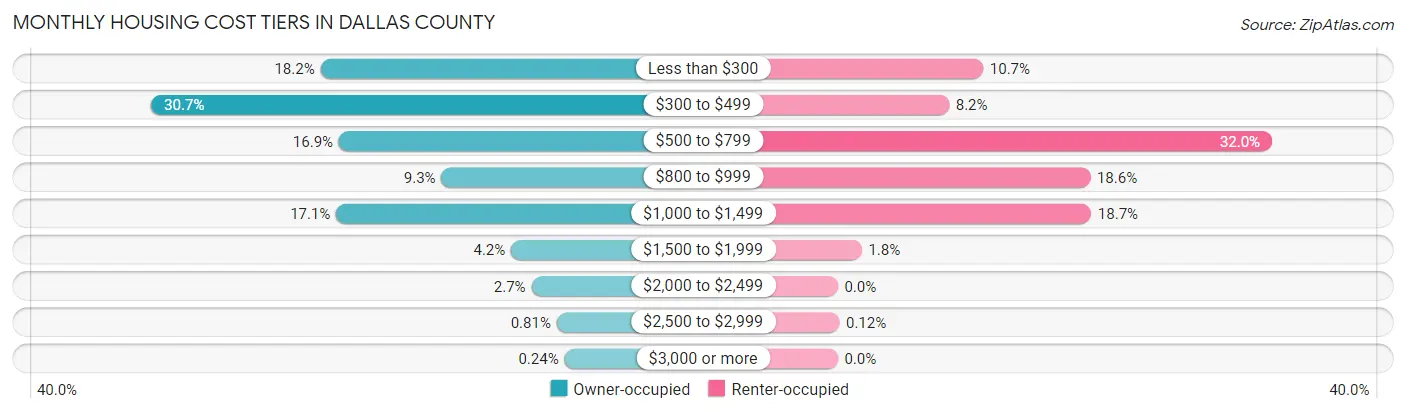
| Monthly Cost | Owner-occupied | Renter-occupied |
| Less than $300 | 1,650 (18.2%) | 610 (10.7%) |
| $300 to $499 | 2,780 (30.7%) | 467 (8.2%) |
| $500 to $799 | 1,527 (16.9%) | 1,822 (32.0%) |
| $800 to $999 | 843 (9.3%) | 1,059 (18.6%) |
| $1,000 to $1,499 | 1,545 (17.1%) | 1,063 (18.7%) |
| $1,500 to $1,999 | 378 (4.2%) | 101 (1.8%) |
| $2,000 to $2,499 | 242 (2.7%) | 0 (0.0%) |
| $2,500 to $2,999 | 73 (0.8%) | 7 (0.1%) |
| $3,000 or more | 22 (0.2%) | 0 (0.0%) |
| Total | 9,060 (100.0%) | 5,693 (100.0%) |
Physical Housing Characteristics in Dallas County
Housing Structures in Dallas County
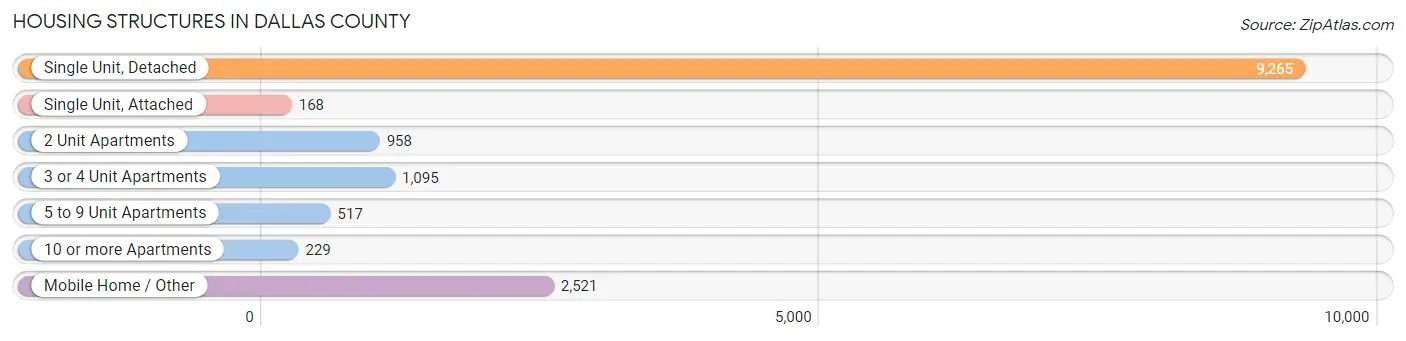
| Structure Type | # Housing Units | % Housing Units |
| Single Unit, Detached | 9,265 | 62.8% |
| Single Unit, Attached | 168 | 1.1% |
| 2 Unit Apartments | 958 | 6.5% |
| 3 or 4 Unit Apartments | 1,095 | 7.4% |
| 5 to 9 Unit Apartments | 517 | 3.5% |
| 10 or more Apartments | 229 | 1.5% |
| Mobile Home / Other | 2,521 | 17.1% |
| Total | 14,753 | 100.0% |
Housing Structures by Occupancy in Dallas County
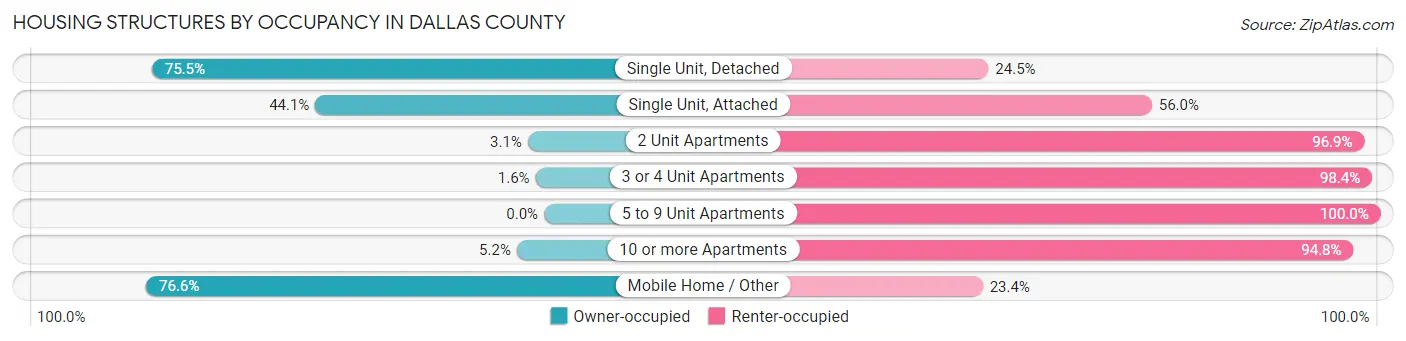
| Structure Type | Owner-occupied | Renter-occupied |
| Single Unit, Detached | 6,995 (75.5%) | 2,270 (24.5%) |
| Single Unit, Attached | 74 (44.1%) | 94 (55.9%) |
| 2 Unit Apartments | 30 (3.1%) | 928 (96.9%) |
| 3 or 4 Unit Apartments | 18 (1.6%) | 1,077 (98.4%) |
| 5 to 9 Unit Apartments | 0 (0.0%) | 517 (100.0%) |
| 10 or more Apartments | 12 (5.2%) | 217 (94.8%) |
| Mobile Home / Other | 1,931 (76.6%) | 590 (23.4%) |
| Total | 9,060 (61.4%) | 5,693 (38.6%) |
Housing Structures by Number of Rooms in Dallas County

| Number of Rooms | Owner-occupied | Renter-occupied |
| 1 Room | 12 (0.1%) | 213 (3.7%) |
| 2 or 3 Rooms | 181 (2.0%) | 507 (8.9%) |
| 4 or 5 Rooms | 2,422 (26.7%) | 2,752 (48.3%) |
| 6 or 7 Rooms | 3,645 (40.2%) | 1,946 (34.2%) |
| 8 or more Rooms | 2,800 (30.9%) | 275 (4.8%) |
| Total | 9,060 (100.0%) | 5,693 (100.0%) |
Housing Structure by Heating Type in Dallas County
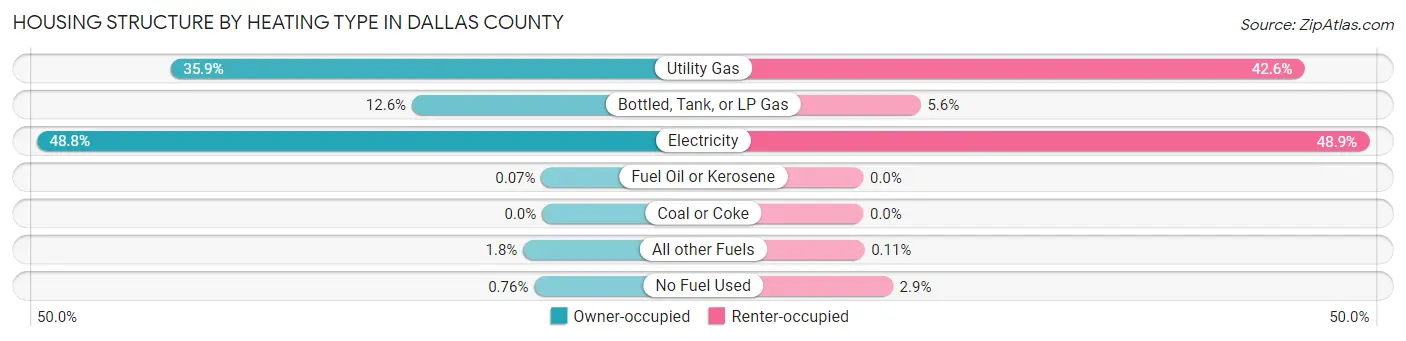
| Heating Type | Owner-occupied | Renter-occupied |
| Utility Gas | 3,254 (35.9%) | 2,426 (42.6%) |
| Bottled, Tank, or LP Gas | 1,140 (12.6%) | 316 (5.6%) |
| Electricity | 4,425 (48.8%) | 2,782 (48.9%) |
| Fuel Oil or Kerosene | 6 (0.1%) | 0 (0.0%) |
| Coal or Coke | 0 (0.0%) | 0 (0.0%) |
| All other Fuels | 166 (1.8%) | 6 (0.1%) |
| No Fuel Used | 69 (0.8%) | 163 (2.9%) |
| Total | 9,060 (100.0%) | 5,693 (100.0%) |
Household Vehicle Usage in Dallas County
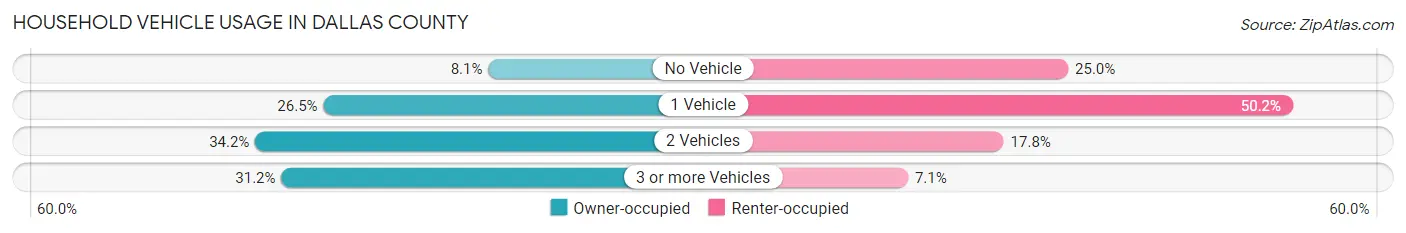
| Vehicles per Household | Owner-occupied | Renter-occupied |
| No Vehicle | 730 (8.1%) | 1,423 (25.0%) |
| 1 Vehicle | 2,404 (26.5%) | 2,856 (50.2%) |
| 2 Vehicles | 3,096 (34.2%) | 1,012 (17.8%) |
| 3 or more Vehicles | 2,830 (31.2%) | 402 (7.1%) |
| Total | 9,060 (100.0%) | 5,693 (100.0%) |
Real Estate & Mortgages in Dallas County
Real Estate and Mortgage Overview in Dallas County
| Characteristic | Without Mortgage | With Mortgage |
| Housing Units | 5,804 | 3,256 |
| Median Property Value | $77,600 | $120,800 |
| Median Household Income | $37,473 | $510 |
| Monthly Housing Costs | $363 | $22 |
| Real Estate Taxes | $278 | $540 |
Property Value by Mortgage Status in Dallas County
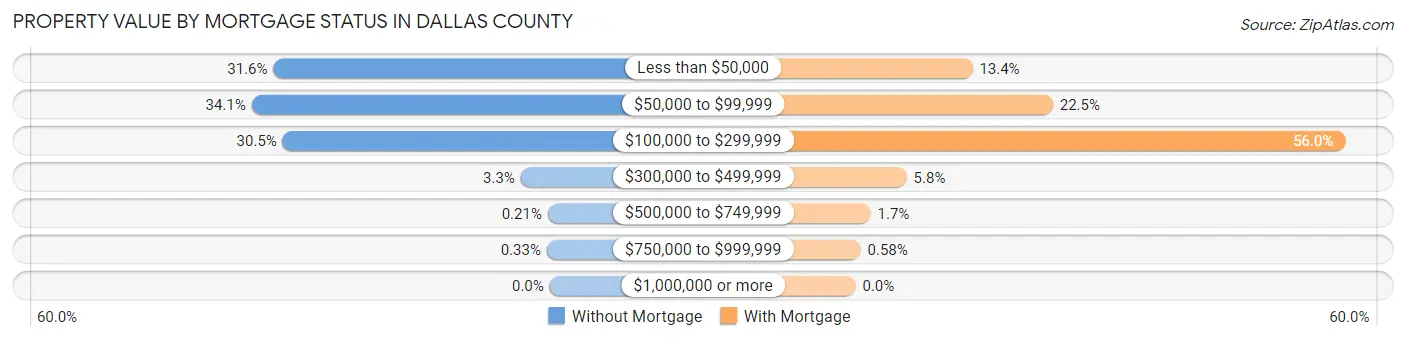
| Property Value | Without Mortgage | With Mortgage |
| Less than $50,000 | 1,833 (31.6%) | 435 (13.4%) |
| $50,000 to $99,999 | 1,977 (34.1%) | 734 (22.5%) |
| $100,000 to $299,999 | 1,771 (30.5%) | 1,822 (56.0%) |
| $300,000 to $499,999 | 192 (3.3%) | 190 (5.8%) |
| $500,000 to $749,999 | 12 (0.2%) | 56 (1.7%) |
| $750,000 to $999,999 | 19 (0.3%) | 19 (0.6%) |
| $1,000,000 or more | 0 (0.0%) | 0 (0.0%) |
| Total | 5,804 (100.0%) | 3,256 (100.0%) |
Household Income by Mortgage Status in Dallas County
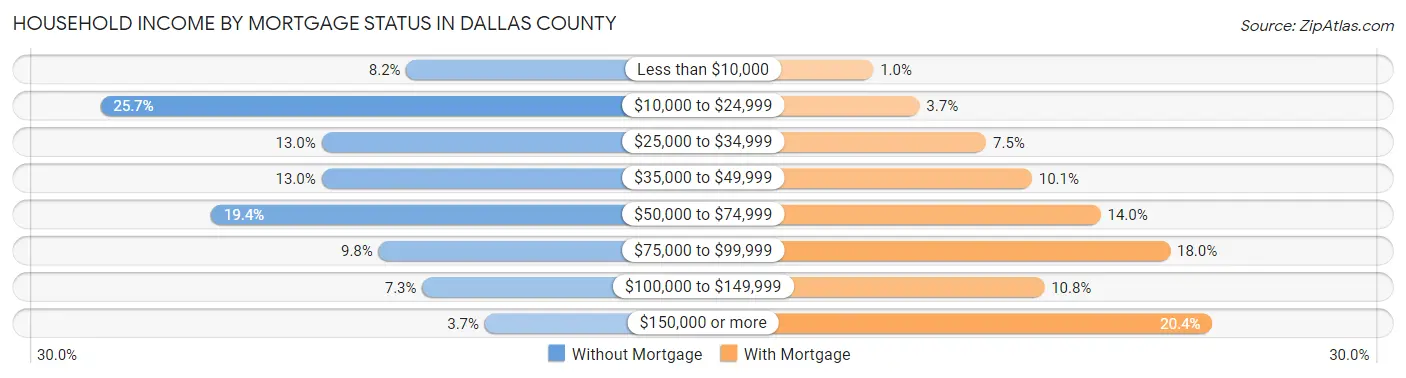
| Household Income | Without Mortgage | With Mortgage |
| Less than $10,000 | 475 (8.2%) | 33 (1.0%) |
| $10,000 to $24,999 | 1,490 (25.7%) | 119 (3.6%) |
| $25,000 to $34,999 | 756 (13.0%) | 243 (7.5%) |
| $35,000 to $49,999 | 756 (13.0%) | 328 (10.1%) |
| $50,000 to $74,999 | 1,123 (19.4%) | 456 (14.0%) |
| $75,000 to $99,999 | 567 (9.8%) | 585 (18.0%) |
| $100,000 to $149,999 | 422 (7.3%) | 351 (10.8%) |
| $150,000 or more | 215 (3.7%) | 664 (20.4%) |
| Total | 5,804 (100.0%) | 3,256 (100.0%) |
Property Value to Household Income Ratio in Dallas County
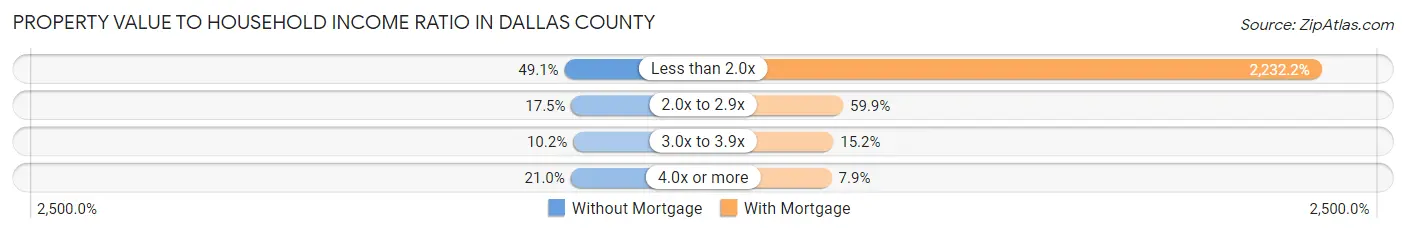
| Value-to-Income Ratio | Without Mortgage | With Mortgage |
| Less than 2.0x | 2,849 (49.1%) | 72,680 (2,232.2%) |
| 2.0x to 2.9x | 1,015 (17.5%) | 1,951 (59.9%) |
| 3.0x to 3.9x | 594 (10.2%) | 494 (15.2%) |
| 4.0x or more | 1,218 (21.0%) | 258 (7.9%) |
| Total | 5,804 (100.0%) | 3,256 (100.0%) |
Real Estate Taxes by Mortgage Status in Dallas County
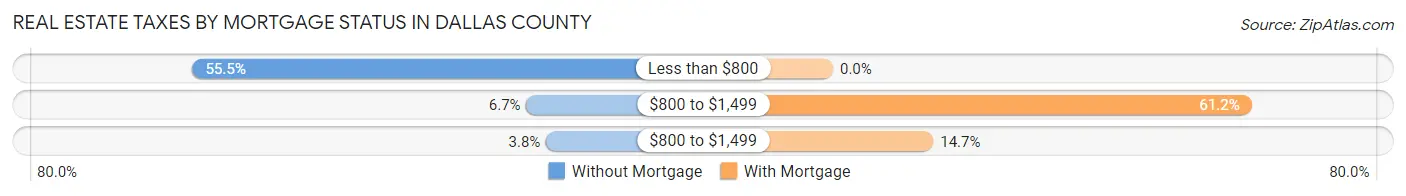
| Property Taxes | Without Mortgage | With Mortgage |
| Less than $800 | 3,219 (55.5%) | 0 (0.0%) |
| $800 to $1,499 | 387 (6.7%) | 1,991 (61.2%) |
| $800 to $1,499 | 220 (3.8%) | 477 (14.6%) |
| Total | 5,804 (100.0%) | 3,256 (100.0%) |
Health & Disability in Dallas County
Health Insurance Coverage by Age in Dallas County
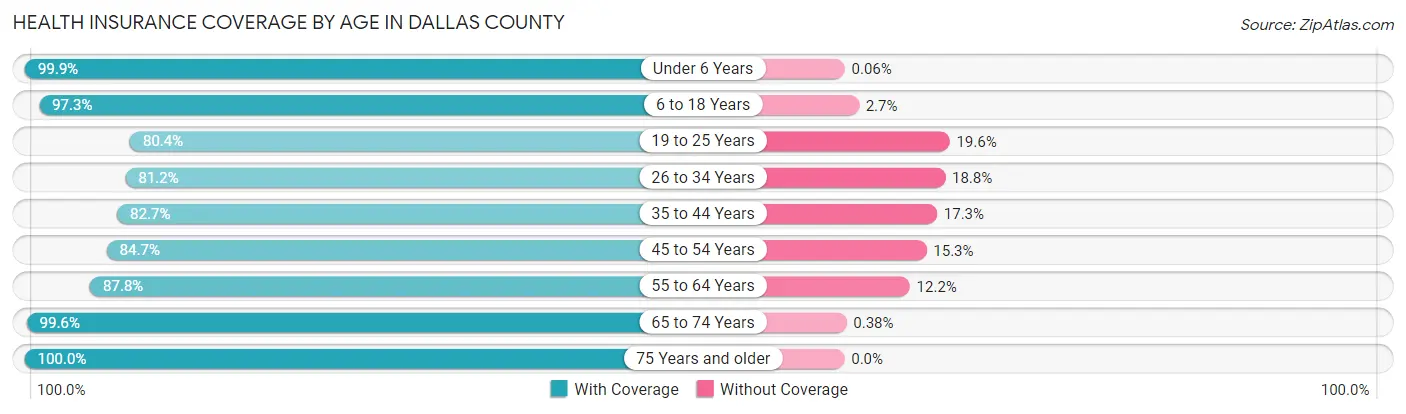
| Age Bracket | With Coverage | Without Coverage |
| Under 6 Years | 3,178 (99.9%) | 2 (0.1%) |
| 6 to 18 Years | 6,153 (97.3%) | 170 (2.7%) |
| 19 to 25 Years | 2,536 (80.4%) | 619 (19.6%) |
| 26 to 34 Years | 3,192 (81.2%) | 738 (18.8%) |
| 35 to 44 Years | 3,476 (82.7%) | 725 (17.3%) |
| 45 to 54 Years | 3,763 (84.7%) | 680 (15.3%) |
| 55 to 64 Years | 4,853 (87.8%) | 674 (12.2%) |
| 65 to 74 Years | 4,440 (99.6%) | 17 (0.4%) |
| 75 Years and older | 2,815 (100.0%) | 0 (0.0%) |
| Total | 34,406 (90.5%) | 3,625 (9.5%) |
Health Insurance Coverage by Citizenship Status in Dallas County

| Citizenship Status | With Coverage | Without Coverage |
| Native Born | 3,178 (99.9%) | 2 (0.1%) |
| Foreign Born, Citizen | 6,153 (97.3%) | 170 (2.7%) |
| Foreign Born, not a Citizen | 2,536 (80.4%) | 619 (19.6%) |
Health Insurance Coverage by Household Income in Dallas County
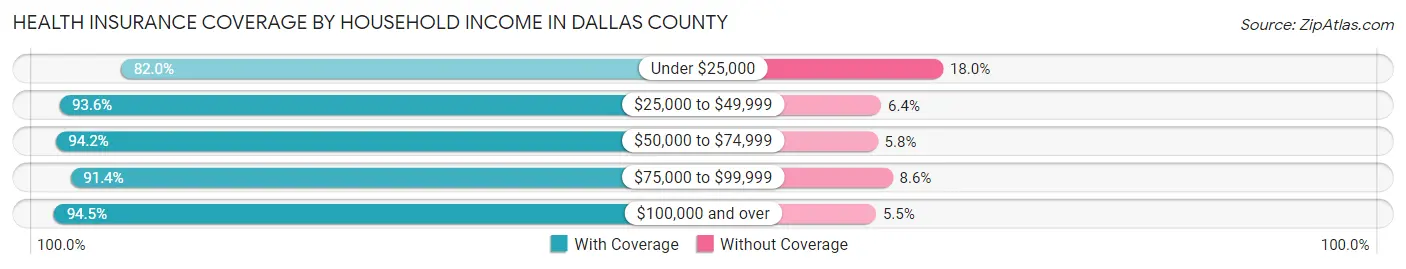
| Household Income | With Coverage | Without Coverage |
| Under $25,000 | 8,296 (82.0%) | 1,823 (18.0%) |
| $25,000 to $49,999 | 9,425 (93.6%) | 649 (6.4%) |
| $50,000 to $74,999 | 6,159 (94.2%) | 378 (5.8%) |
| $75,000 to $99,999 | 3,163 (91.4%) | 297 (8.6%) |
| $100,000 and over | 7,152 (94.5%) | 413 (5.5%) |
Public vs Private Health Insurance Coverage by Age in Dallas County
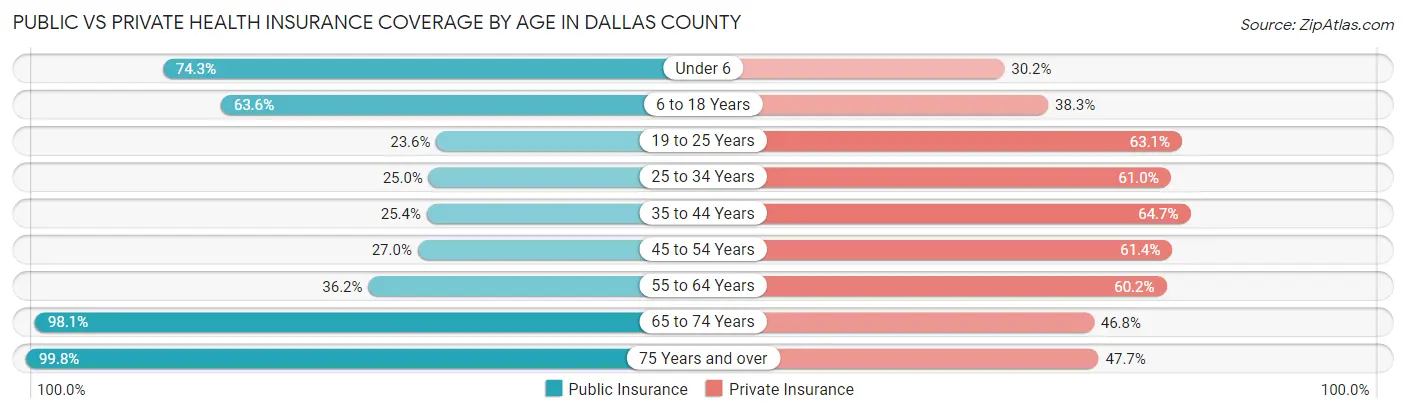
| Age Bracket | Public Insurance | Private Insurance |
| Under 6 | 2,364 (74.3%) | 959 (30.2%) |
| 6 to 18 Years | 4,020 (63.6%) | 2,422 (38.3%) |
| 19 to 25 Years | 744 (23.6%) | 1,991 (63.1%) |
| 25 to 34 Years | 982 (25.0%) | 2,398 (61.0%) |
| 35 to 44 Years | 1,065 (25.4%) | 2,717 (64.7%) |
| 45 to 54 Years | 1,201 (27.0%) | 2,726 (61.4%) |
| 55 to 64 Years | 2,000 (36.2%) | 3,329 (60.2%) |
| 65 to 74 Years | 4,372 (98.1%) | 2,085 (46.8%) |
| 75 Years and over | 2,808 (99.8%) | 1,342 (47.7%) |
| Total | 19,556 (51.4%) | 19,969 (52.5%) |
Disability Status by Sex by Age in Dallas County
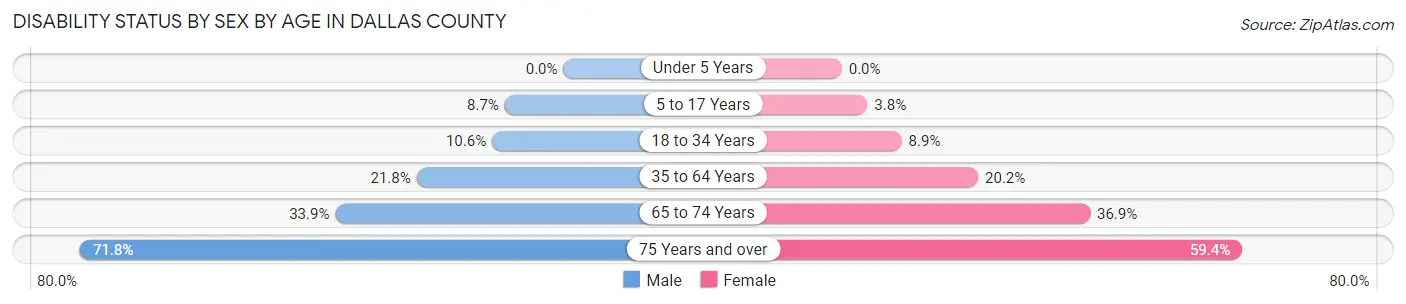
| Age Bracket | Male | Female |
| Under 5 Years | 0 (0.0%) | 0 (0.0%) |
| 5 to 17 Years | 302 (8.7%) | 123 (3.8%) |
| 18 to 34 Years | 381 (10.6%) | 356 (8.9%) |
| 35 to 64 Years | 1,392 (21.8%) | 1,576 (20.2%) |
| 65 to 74 Years | 678 (33.9%) | 905 (36.9%) |
| 75 Years and over | 793 (71.8%) | 1,016 (59.4%) |
Disability Class by Sex by Age in Dallas County
Disability Class: Hearing Difficulty
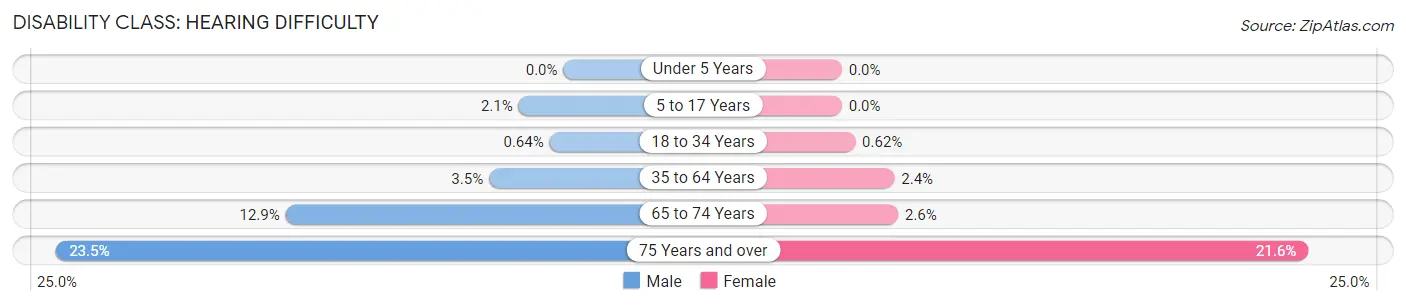
| Age Bracket | Male | Female |
| Under 5 Years | 0 (0.0%) | 0 (0.0%) |
| 5 to 17 Years | 72 (2.1%) | 0 (0.0%) |
| 18 to 34 Years | 23 (0.6%) | 25 (0.6%) |
| 35 to 64 Years | 220 (3.5%) | 190 (2.4%) |
| 65 to 74 Years | 258 (12.9%) | 64 (2.6%) |
| 75 Years and over | 260 (23.5%) | 370 (21.6%) |
Disability Class: Vision Difficulty
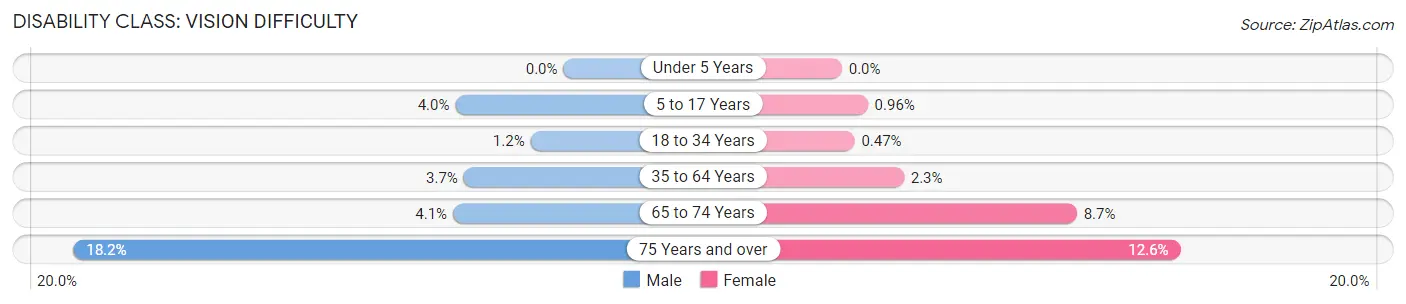
| Age Bracket | Male | Female |
| Under 5 Years | 0 (0.0%) | 0 (0.0%) |
| 5 to 17 Years | 139 (4.0%) | 31 (1.0%) |
| 18 to 34 Years | 44 (1.2%) | 19 (0.5%) |
| 35 to 64 Years | 236 (3.7%) | 179 (2.3%) |
| 65 to 74 Years | 82 (4.1%) | 214 (8.7%) |
| 75 Years and over | 201 (18.2%) | 215 (12.6%) |
Disability Class: Cognitive Difficulty
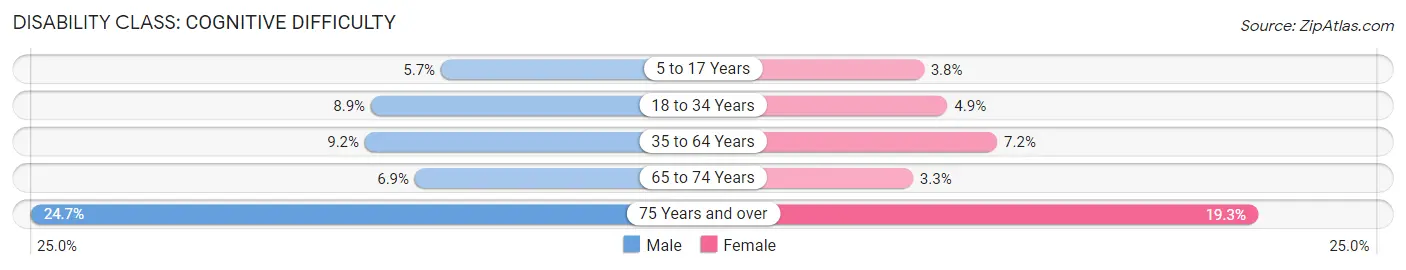
| Age Bracket | Male | Female |
| 5 to 17 Years | 197 (5.7%) | 123 (3.8%) |
| 18 to 34 Years | 321 (8.9%) | 196 (4.9%) |
| 35 to 64 Years | 588 (9.2%) | 561 (7.2%) |
| 65 to 74 Years | 138 (6.9%) | 81 (3.3%) |
| 75 Years and over | 273 (24.7%) | 330 (19.3%) |
Disability Class: Ambulatory Difficulty
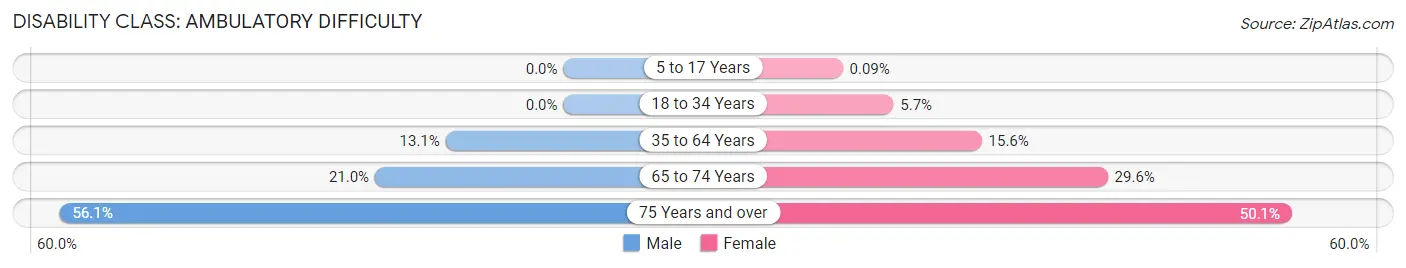
| Age Bracket | Male | Female |
| 5 to 17 Years | 0 (0.0%) | 3 (0.1%) |
| 18 to 34 Years | 0 (0.0%) | 230 (5.7%) |
| 35 to 64 Years | 837 (13.1%) | 1,212 (15.6%) |
| 65 to 74 Years | 420 (21.0%) | 727 (29.6%) |
| 75 Years and over | 620 (56.1%) | 857 (50.1%) |
Disability Class: Self-Care Difficulty
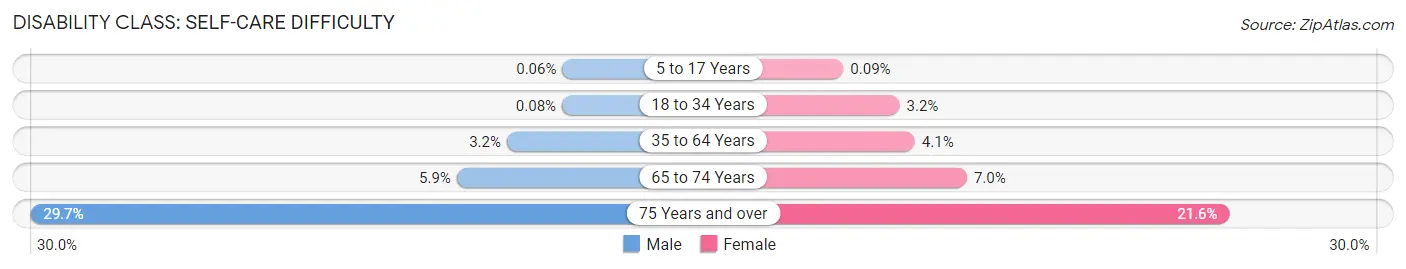
| Age Bracket | Male | Female |
| 5 to 17 Years | 2 (0.1%) | 3 (0.1%) |
| 18 to 34 Years | 3 (0.1%) | 129 (3.2%) |
| 35 to 64 Years | 201 (3.2%) | 317 (4.1%) |
| 65 to 74 Years | 119 (5.9%) | 171 (7.0%) |
| 75 Years and over | 328 (29.7%) | 369 (21.6%) |
Technology Access in Dallas County
Computing Device Access in Dallas County
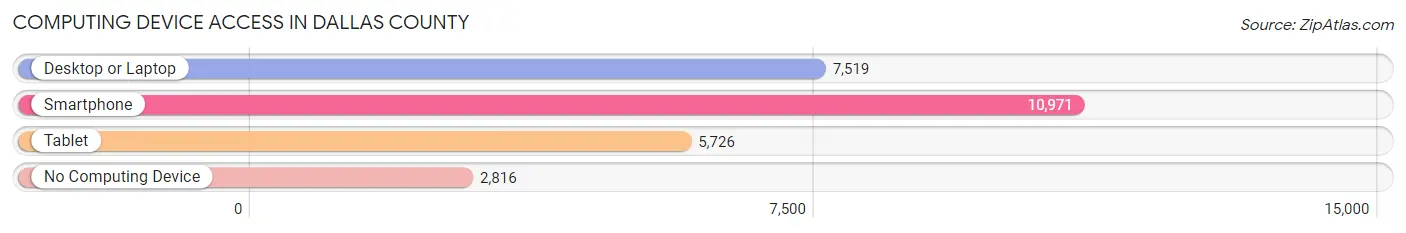
| Device Type | # Households | % Households |
| Desktop or Laptop | 7,519 | 51.0% |
| Smartphone | 10,971 | 74.4% |
| Tablet | 5,726 | 38.8% |
| No Computing Device | 2,816 | 19.1% |
| Total | 14,753 | 100.0% |
Internet Access in Dallas County
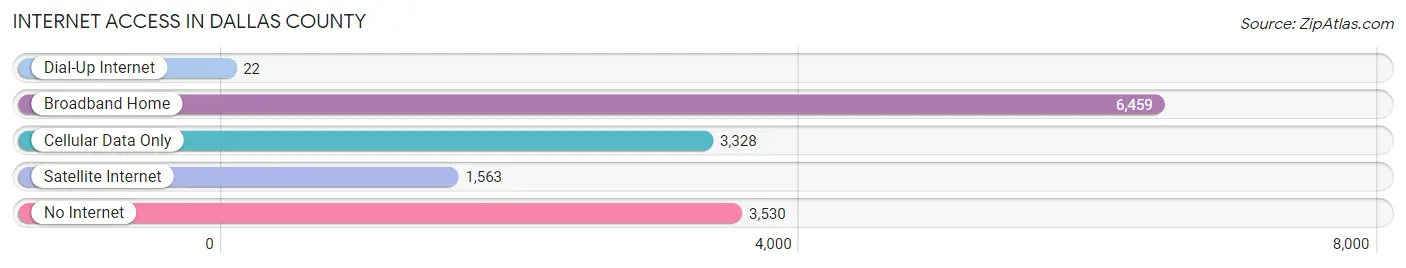
| Internet Type | # Households | % Households |
| Dial-Up Internet | 22 | 0.2% |
| Broadband Home | 6,459 | 43.8% |
| Cellular Data Only | 3,328 | 22.6% |
| Satellite Internet | 1,563 | 10.6% |
| No Internet | 3,530 | 23.9% |
| Total | 14,753 | 100.0% |
Dallas County Summary
Dallas County is located in the southwestern corner of the state of Alabama. It is bordered by Wilcox, Lowndes, and Perry counties to the north, Autauga and Chilton counties to the east, and Clarke and Monroe counties to the south. The county seat is Selma, which is also the largest city in the county. Dallas County was established in 1818 and named after Alexander J. Dallas, the Secretary of the Treasury under President James Madison.
Geography
Dallas County covers an area of 845 square miles and is located in the Black Belt region of Alabama. The terrain is mostly flat with some rolling hills and is mostly covered in pine and hardwood forests. The county is drained by the Alabama River, which forms its western boundary. The Cahaba River also flows through the county.
Demographics
As of the 2010 census, Dallas County had a population of 43,820. The racial makeup of the county was 57.2% African American, 40.2% White, 0.3% Native American, 0.2% Asian, 0.1% Pacific Islander, 1.2% from other races, and 0.9% from two or more races. Hispanic or Latino of any race were 2.2% of the population.
The median household income in Dallas County was $30,945, and the median family income was $37,945. The per capita income was $16,845. About 24.2% of the population was below the poverty line.
Economy
Dallas County’s economy is largely based on agriculture. The main crops grown in the county are cotton, corn, soybeans, and peanuts. Livestock production is also important, with cattle, hogs, and poultry being the main animals raised.
The county also has a number of manufacturing and industrial businesses. The largest employers in the county are the Selma-Dallas County Hospital, the Dallas County Board of Education, and the Dallas County Sheriff’s Office.
History
Dallas County was established in 1818 and named after Alexander J. Dallas, the Secretary of the Treasury under President James Madison. The county was originally part of the Choctaw Nation, but was ceded to the United States in 1816.
The county was the site of the Battle of Selma during the Civil War. The battle was fought on April 2, 1865 and resulted in a Confederate victory.
Selma was the site of the Selma to Montgomery marches in 1965. The marches were part of the civil rights movement and were led by Martin Luther King Jr. The marches resulted in the passage of the Voting Rights Act of 1965.
Today, Dallas County is a largely rural county with a population of 43,820. The county is home to a number of historic sites, including the Selma to Montgomery National Historic Trail, the Selma Courthouse Square Historic District, and the Old Live Oak Cemetery.
Common Questions
What is Per Capita Income in Dallas County?
Per Capita income in Dallas County is $22,798.
What is the Median Family Income in Dallas County?
Median Family Income in Dallas County is $52,453.
What is the Median Household income in Dallas County?
Median Household Income in Dallas County is $37,180.
What is Income or Wage Gap in Dallas County?
Income or Wage Gap in Dallas County is 25.4%.
Women in Dallas County earn 74.6 cents for every dollar earned by a man.
What is Family Income Deficit in Dallas County?
Family Income Deficit in Dallas County is $10,300.
Families that are below poverty line in Dallas County earn $10,300 less on average than the poverty threshold level.
What is Inequality or Gini Index in Dallas County?
Inequality or Gini Index in Dallas County is 0.49.
What is the Total Population of Dallas County?
Total Population of Dallas County is 38,326.
What is the Total Male Population of Dallas County?
Total Male Population of Dallas County is 17,895.
What is the Total Female Population of Dallas County?
Total Female Population of Dallas County is 20,431.
What is the Ratio of Males per 100 Females in Dallas County?
There are 87.59 Males per 100 Females in Dallas County.
What is the Ratio of Females per 100 Males in Dallas County?
There are 114.17 Females per 100 Males in Dallas County.
What is the Median Population Age in Dallas County?
Median Population Age in Dallas County is 40.4 Years.
What is the Average Family Size in Dallas County
Average Family Size in Dallas County is 3.6 People.
What is the Average Household Size in Dallas County
Average Household Size in Dallas County is 2.6 People.
How Large is the Labor Force in Dallas County?
There are 15,813 People in the Labor Forcein in Dallas County.
What is the Percentage of People in the Labor Force in Dallas County?
52.1% of People are in the Labor Force in Dallas County.
What is the Unemployment Rate in Dallas County?
Unemployment Rate in Dallas County is 9.1%.