Crenshaw County, AL Map & Demographics
Crenshaw County Map
Crenshaw County Overview
$32,396
PER CAPITA INCOME
$69,602
AVG FAMILY INCOME
$48,557
AVG HOUSEHOLD INCOME
35.7%
WAGE / INCOME GAP [ % ]
64.3¢/ $1
WAGE / INCOME GAP [ $ ]
$12,042
FAMILY INCOME DEFICIT
0.56
INEQUALITY / GINI INDEX
13,205
TOTAL POPULATION
6,451
MALE POPULATION
6,754
FEMALE POPULATION
95.51
MALES / 100 FEMALES
104.70
FEMALES / 100 MALES
42.3
MEDIAN AGE
3.5
AVG FAMILY SIZE
2.7
AVG HOUSEHOLD SIZE
5,489
LABOR FORCE [ PEOPLE ]
52.0%
PERCENT IN LABOR FORCE
6.1%
UNEMPLOYMENT RATE
Crenshaw County Area Codes
Income in Crenshaw County
Income Overview in Crenshaw County
Per Capita Income in Crenshaw County is $32,396, while median incomes of families and households are $69,602 and $48,557 respectively.
| Characteristic | Number | Measure |
| Per Capita Income | 13,205 | $32,396 |
| Median Family Income | 3,012 | $69,602 |
| Mean Family Income | 3,012 | $102,547 |
| Median Household Income | 4,839 | $48,557 |
| Mean Household Income | 4,839 | $78,621 |
| Income Deficit | 3,012 | $12,042 |
| Wage / Income Gap (%) | 13,205 | 35.73% |
| Wage / Income Gap ($) | 13,205 | 64.27¢ per $1 |
| Gini / Inequality Index | 13,205 | 0.56 |
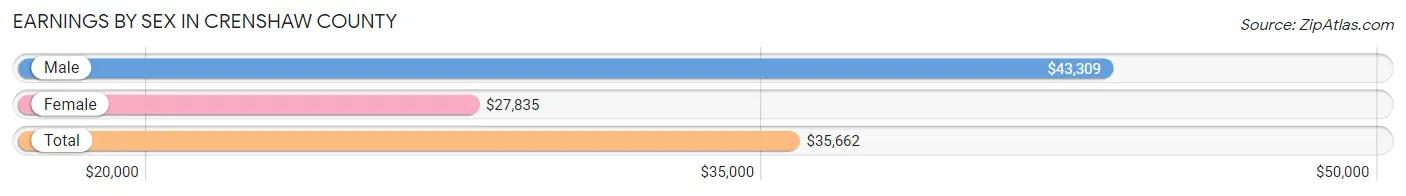
Earnings by Sex in Crenshaw County
Average Earnings in Crenshaw County are $35,662, $43,309 for men and $27,835 for women, a difference of 35.7%.
| Sex | Number | Average Earnings |
| Male | 3,049 (53.0%) | $43,309 |
| Female | 2,708 (47.0%) | $27,835 |
| Total | 5,757 (100.0%) | $35,662 |
Earnings by Sex by Income Bracket in Crenshaw County
The most common earnings brackets in Crenshaw County are $100,000+ for men (348 | 11.4%) and $35,000 to $39,999 for women (274 | 10.1%).
| Income | Male | Female |
| $2,499 or less | 104 (3.4%) | 169 (6.2%) |
| $2,500 to $4,999 | 33 (1.1%) | 166 (6.1%) |
| $5,000 to $7,499 | 35 (1.1%) | 72 (2.7%) |
| $7,500 to $9,999 | 84 (2.8%) | 187 (6.9%) |
| $10,000 to $12,499 | 67 (2.2%) | 93 (3.4%) |
| $12,500 to $14,999 | 46 (1.5%) | 49 (1.8%) |
| $15,000 to $17,499 | 70 (2.3%) | 114 (4.2%) |
| $17,500 to $19,999 | 75 (2.5%) | 166 (6.1%) |
| $20,000 to $22,499 | 66 (2.2%) | 90 (3.3%) |
| $22,500 to $24,999 | 75 (2.5%) | 143 (5.3%) |
| $25,000 to $29,999 | 269 (8.8%) | 215 (7.9%) |
| $30,000 to $34,999 | 152 (5.0%) | 263 (9.7%) |
| $35,000 to $39,999 | 274 (9.0%) | 274 (10.1%) |
| $40,000 to $44,999 | 209 (6.9%) | 151 (5.6%) |
| $45,000 to $49,999 | 272 (8.9%) | 37 (1.4%) |
| $50,000 to $54,999 | 253 (8.3%) | 97 (3.6%) |
| $55,000 to $64,999 | 210 (6.9%) | 175 (6.5%) |
| $65,000 to $74,999 | 167 (5.5%) | 48 (1.8%) |
| $75,000 to $99,999 | 240 (7.9%) | 65 (2.4%) |
| $100,000+ | 348 (11.4%) | 134 (5.0%) |
| Total | 3,049 (100.0%) | 2,708 (100.0%) |
Earnings by Sex by Educational Attainment in Crenshaw County
Average earnings in Crenshaw County are $46,142 for men and $30,723 for women, a difference of 33.4%. Men with an educational attainment of bachelor's degree enjoy the highest average annual earnings of $64,773, while those with less than high school education earn the least with $35,714. Women with an educational attainment of bachelor's degree earn the most with the average annual earnings of $55,324, while those with college or associate's degree education have the smallest earnings of $25,972.
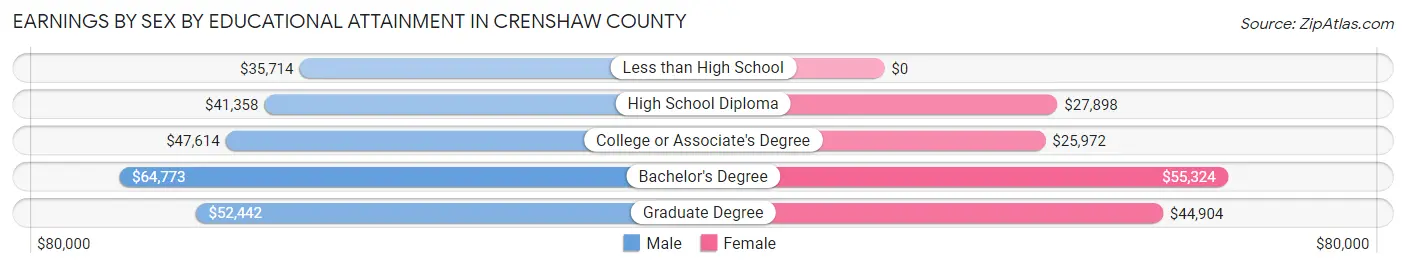
| Educational Attainment | Male Income | Female Income |
| Less than High School | $35,714 | $0 |
| High School Diploma | $41,358 | $27,898 |
| College or Associate's Degree | $47,614 | $25,972 |
| Bachelor's Degree | $64,773 | $55,324 |
| Graduate Degree | $52,442 | $44,904 |
| Total | $46,142 | $30,723 |
Family Income in Crenshaw County
Family Income Brackets in Crenshaw County
According to the Crenshaw County family income data, there are 572 families falling into the $75,000 to $99,999 income range, which is the most common income bracket and makes up 19.0% of all families. Conversely, the less than $10,000 income bracket is the least frequent group with only 72 families (2.4%) belonging to this category.
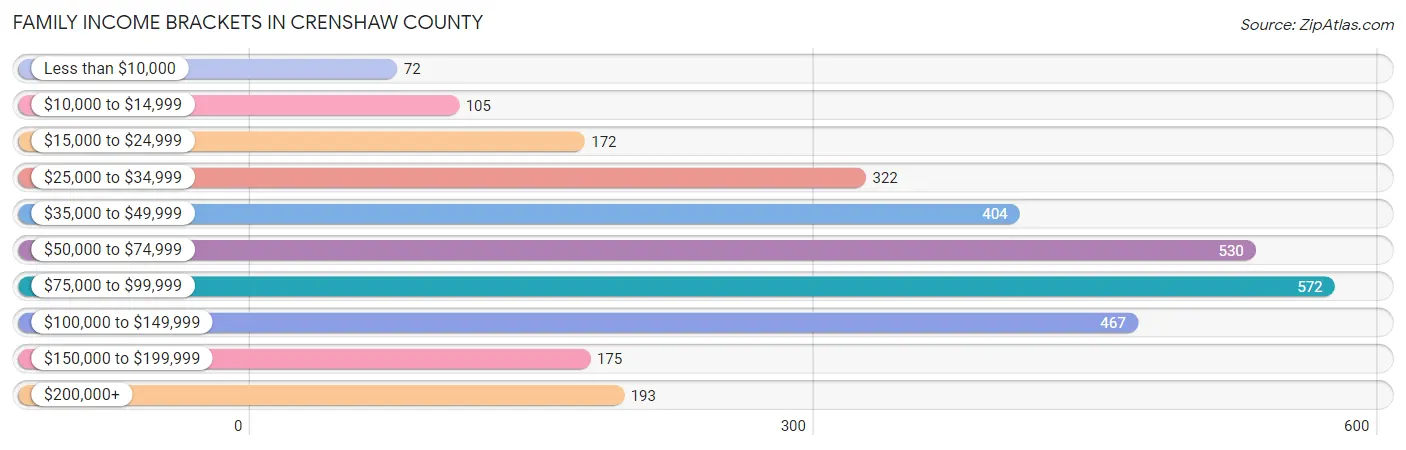
| Income Bracket | # Families | % Families |
| Less than $10,000 | 72 | 2.4% |
| $10,000 to $14,999 | 105 | 3.5% |
| $15,000 to $24,999 | 172 | 5.7% |
| $25,000 to $34,999 | 322 | 10.7% |
| $35,000 to $49,999 | 404 | 13.4% |
| $50,000 to $74,999 | 530 | 17.6% |
| $75,000 to $99,999 | 572 | 19.0% |
| $100,000 to $149,999 | 467 | 15.5% |
| $150,000 to $199,999 | 175 | 5.8% |
| $200,000+ | 193 | 6.4% |
Family Income by Famaliy Size in Crenshaw County
5-person families (198 | 6.6%) account for the highest median family income in Crenshaw County with $99,400 per family, while 2-person families (1,601 | 53.1%) have the highest median income of $28,542 per family member.
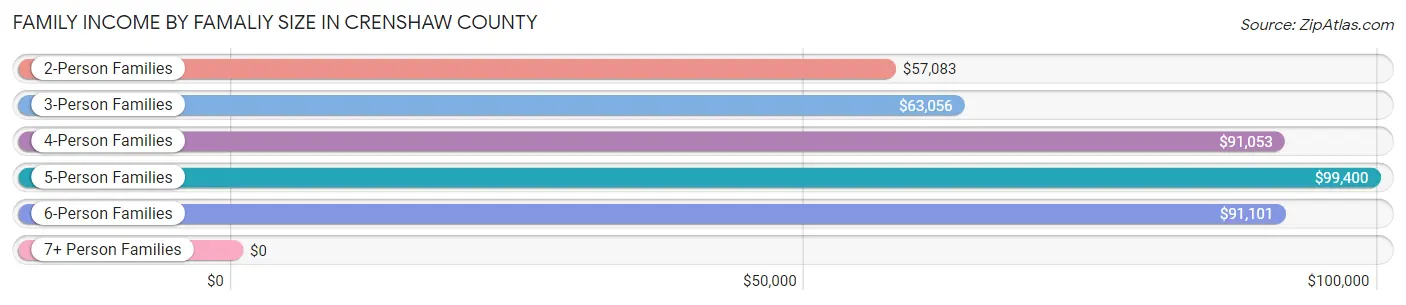
| Income Bracket | # Families | Median Income |
| 2-Person Families | 1,601 (53.1%) | $57,083 |
| 3-Person Families | 628 (20.8%) | $63,056 |
| 4-Person Families | 492 (16.3%) | $91,053 |
| 5-Person Families | 198 (6.6%) | $99,400 |
| 6-Person Families | 85 (2.8%) | $91,101 |
| 7+ Person Families | 8 (0.3%) | $0 |
| Total | 3,012 (100.0%) | $69,602 |
Family Income by Number of Earners in Crenshaw County
The median family income in Crenshaw County is $69,602, with families comprising 3+ earners (206) having the highest median family income of $99,000, while families with no earners (589) have the lowest median family income of $31,925, accounting for 6.8% and 19.6% of families, respectively.
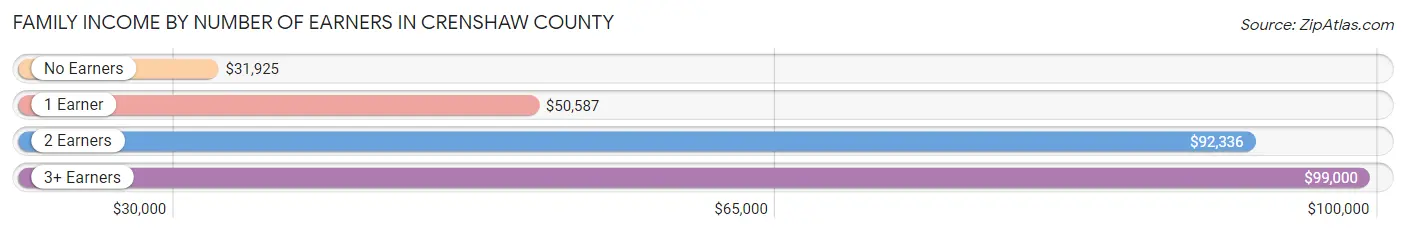
| Number of Earners | # Families | Median Income |
| No Earners | 589 (19.6%) | $31,925 |
| 1 Earner | 935 (31.0%) | $50,587 |
| 2 Earners | 1,282 (42.6%) | $92,336 |
| 3+ Earners | 206 (6.8%) | $99,000 |
| Total | 3,012 (100.0%) | $69,602 |
Household Income in Crenshaw County
Household Income Brackets in Crenshaw County
With 740 households falling in the category, the $50,000 to $74,999 income range is the most frequent in Crenshaw County, accounting for 15.3% of all households. In contrast, only 208 households (4.3%) fall into the $200,000+ income bracket, making it the least populous group.
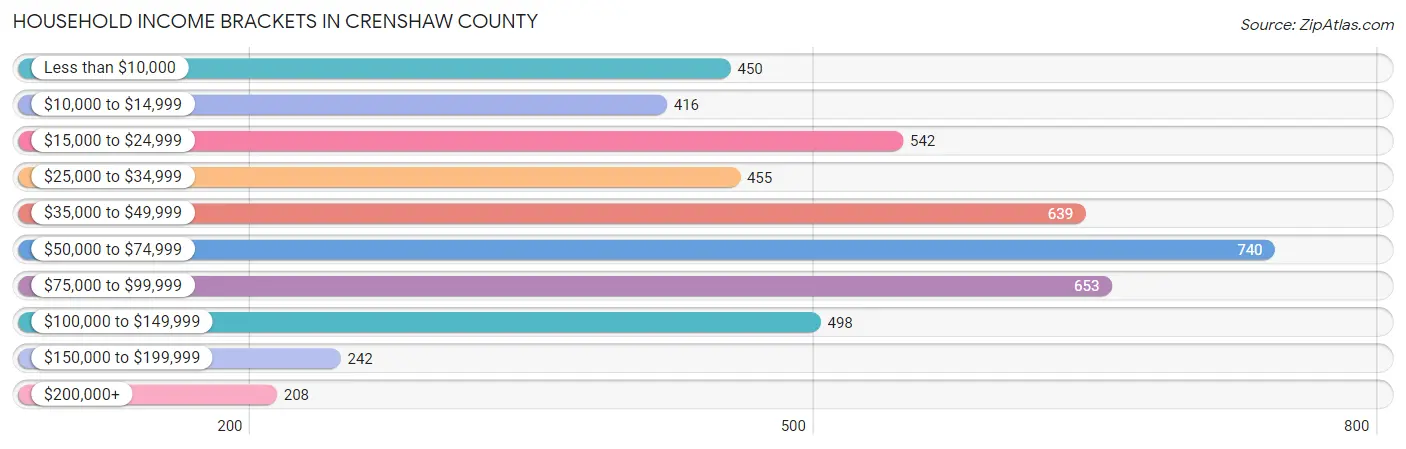
| Income Bracket | # Households | % Households |
| Less than $10,000 | 450 | 9.3% |
| $10,000 to $14,999 | 416 | 8.6% |
| $15,000 to $24,999 | 542 | 11.2% |
| $25,000 to $34,999 | 455 | 9.4% |
| $35,000 to $49,999 | 639 | 13.2% |
| $50,000 to $74,999 | 740 | 15.3% |
| $75,000 to $99,999 | 653 | 13.5% |
| $100,000 to $149,999 | 498 | 10.3% |
| $150,000 to $199,999 | 242 | 5.0% |
| $200,000+ | 208 | 4.3% |
Household Income by Householder Age in Crenshaw County
The median household income in Crenshaw County is $48,557, with the highest median household income of $64,485 found in the 25 to 44 years age bracket for the primary householder. A total of 1,158 households (23.9%) fall into this category. Meanwhile, the 15 to 24 years age bracket for the primary householder has the lowest median household income of $0, with 217 households (4.5%) in this group.
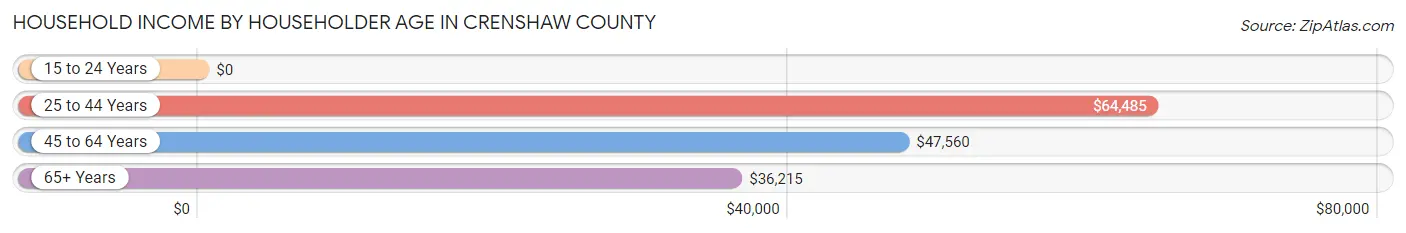
| Income Bracket | # Households | Median Income |
| 15 to 24 Years | 217 (4.5%) | $0 |
| 25 to 44 Years | 1,158 (23.9%) | $64,485 |
| 45 to 64 Years | 1,924 (39.8%) | $47,560 |
| 65+ Years | 1,540 (31.8%) | $36,215 |
| Total | 4,839 (100.0%) | $48,557 |
Poverty in Crenshaw County
Income Below Poverty by Sex and Age in Crenshaw County
With 14.4% poverty level for males and 15.2% for females among the residents of Crenshaw County, 15 year old males and 15 year old females are the most vulnerable to poverty, with 44 males (40.0%) and 24 females (57.1%) in their respective age groups living below the poverty level.
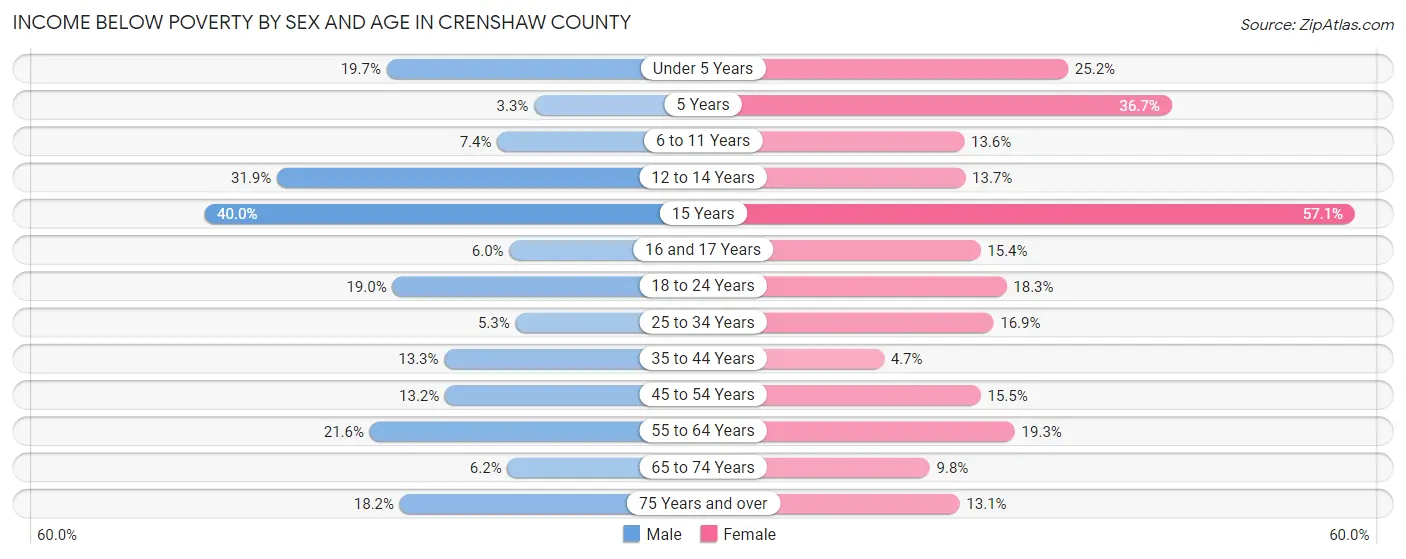
| Age Bracket | Male | Female |
| Under 5 Years | 48 (19.7%) | 103 (25.2%) |
| 5 Years | 4 (3.3%) | 36 (36.7%) |
| 6 to 11 Years | 34 (7.4%) | 61 (13.6%) |
| 12 to 14 Years | 117 (31.9%) | 39 (13.7%) |
| 15 Years | 44 (40.0%) | 24 (57.1%) |
| 16 and 17 Years | 11 (6.0%) | 29 (15.4%) |
| 18 to 24 Years | 106 (19.0%) | 88 (18.3%) |
| 25 to 34 Years | 43 (5.3%) | 125 (16.9%) |
| 35 to 44 Years | 99 (13.3%) | 33 (4.7%) |
| 45 to 54 Years | 93 (13.2%) | 144 (15.4%) |
| 55 to 64 Years | 199 (21.6%) | 174 (19.3%) |
| 65 to 74 Years | 43 (6.2%) | 84 (9.8%) |
| 75 Years and over | 69 (18.2%) | 66 (13.1%) |
| Total | 910 (14.4%) | 1,006 (15.2%) |
Income Above Poverty by Sex and Age in Crenshaw County
According to the poverty statistics in Crenshaw County, males aged 5 years and females aged 35 to 44 years are the age groups that are most secure financially, with 96.8% of males and 95.3% of females in these age groups living above the poverty line.
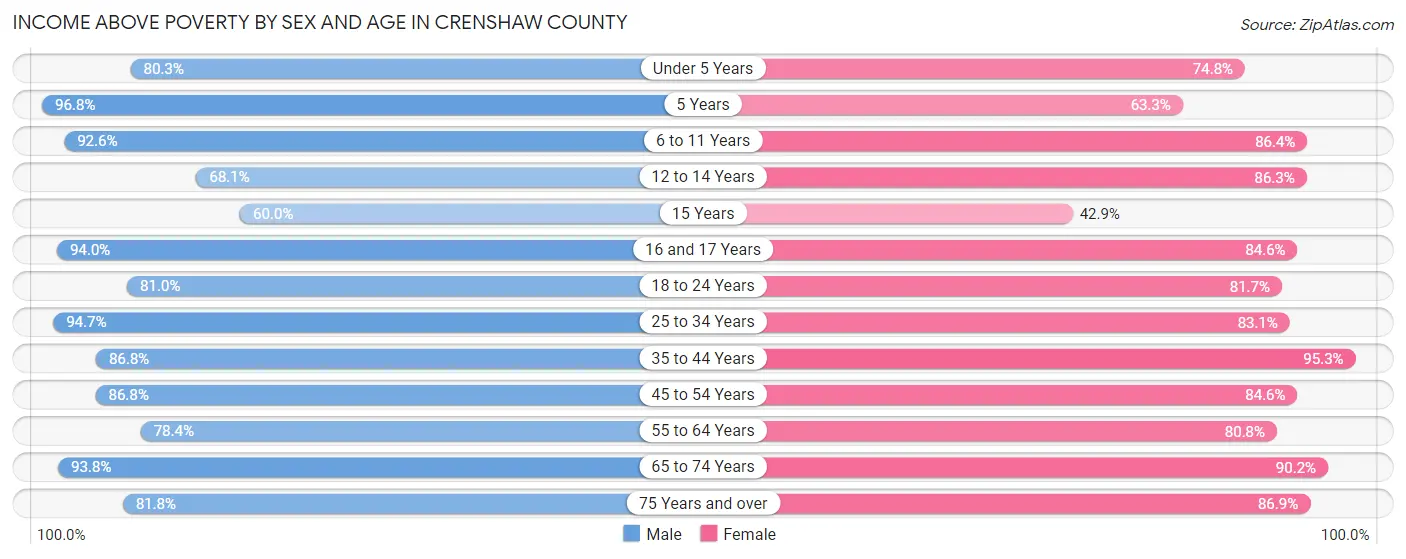
| Age Bracket | Male | Female |
| Under 5 Years | 196 (80.3%) | 306 (74.8%) |
| 5 Years | 119 (96.8%) | 62 (63.3%) |
| 6 to 11 Years | 428 (92.6%) | 387 (86.4%) |
| 12 to 14 Years | 250 (68.1%) | 245 (86.3%) |
| 15 Years | 66 (60.0%) | 18 (42.9%) |
| 16 and 17 Years | 172 (94.0%) | 159 (84.6%) |
| 18 to 24 Years | 451 (81.0%) | 392 (81.7%) |
| 25 to 34 Years | 765 (94.7%) | 616 (83.1%) |
| 35 to 44 Years | 648 (86.8%) | 673 (95.3%) |
| 45 to 54 Years | 613 (86.8%) | 788 (84.6%) |
| 55 to 64 Years | 724 (78.4%) | 730 (80.7%) |
| 65 to 74 Years | 648 (93.8%) | 775 (90.2%) |
| 75 Years and over | 310 (81.8%) | 438 (86.9%) |
| Total | 5,390 (85.6%) | 5,589 (84.8%) |
Income Below Poverty Among Married-Couple Families in Crenshaw County
The poverty statistics for married-couple families in Crenshaw County show that 3.8% or 82 of the total 2,129 families live below the poverty line. Families with 3 or 4 children have the highest poverty rate of 20.0%, comprising of 33 families. On the other hand, families with 1 or 2 children have the lowest poverty rate of 1.7%, which includes 11 families.
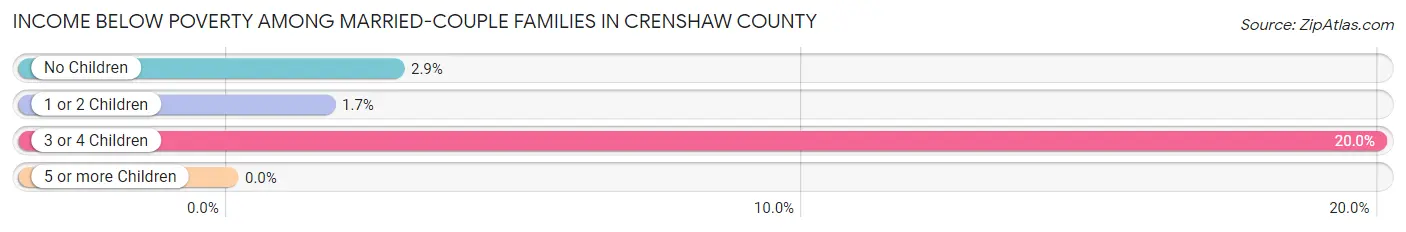
| Children | Above Poverty | Below Poverty |
| No Children | 1,275 (97.1%) | 38 (2.9%) |
| 1 or 2 Children | 640 (98.3%) | 11 (1.7%) |
| 3 or 4 Children | 132 (80.0%) | 33 (20.0%) |
| 5 or more Children | 0 (0.0%) | 0 (0.0%) |
| Total | 2,047 (96.2%) | 82 (3.8%) |
Income Below Poverty Among Single-Parent Households in Crenshaw County
According to the poverty data in Crenshaw County, 5.9% or 17 single-father households and 22.0% or 131 single-mother households are living below the poverty line. Among single-father households, those with 1 or 2 children have the highest poverty rate, with 10 households (8.1%) experiencing poverty. Likewise, among single-mother households, those with 3 or 4 children have the highest poverty rate, with 14 households (31.8%) falling below the poverty line.
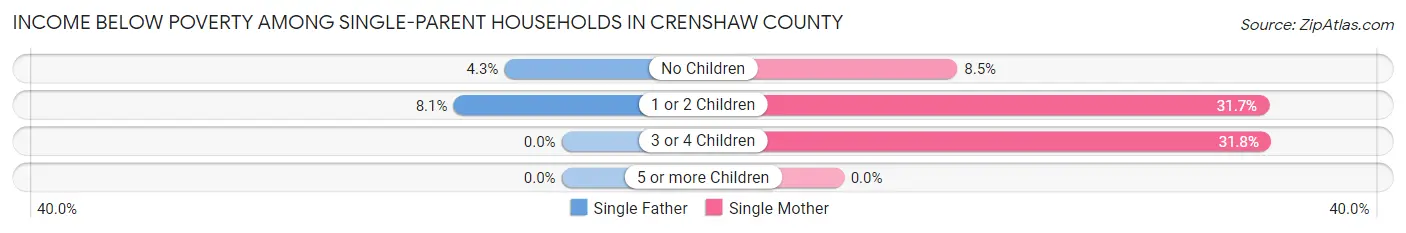
| Children | Single Father | Single Mother |
| No Children | 7 (4.3%) | 21 (8.5%) |
| 1 or 2 Children | 10 (8.1%) | 96 (31.7%) |
| 3 or 4 Children | 0 (0.0%) | 14 (31.8%) |
| 5 or more Children | 0 (0.0%) | 0 (0.0%) |
| Total | 17 (5.9%) | 131 (22.0%) |
Income Below Poverty Among Married-Couple vs Single-Parent Households in Crenshaw County
The poverty data for Crenshaw County shows that 82 of the married-couple family households (3.8%) and 148 of the single-parent households (16.8%) are living below the poverty level. Within the married-couple family households, those with 3 or 4 children have the highest poverty rate, with 33 households (20.0%) falling below the poverty line. Among the single-parent households, those with 3 or 4 children have the highest poverty rate, with 14 household (31.8%) living below poverty.
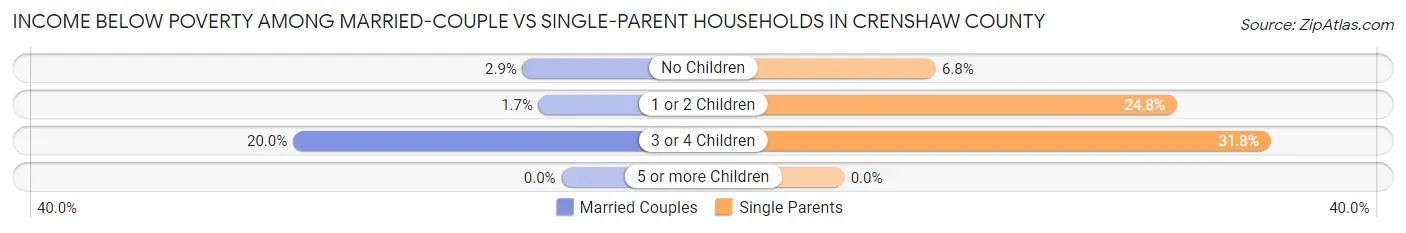
| Children | Married-Couple Families | Single-Parent Households |
| No Children | 38 (2.9%) | 28 (6.8%) |
| 1 or 2 Children | 11 (1.7%) | 106 (24.8%) |
| 3 or 4 Children | 33 (20.0%) | 14 (31.8%) |
| 5 or more Children | 0 (0.0%) | 0 (0.0%) |
| Total | 82 (3.8%) | 148 (16.8%) |
Race in Crenshaw County
The most populous races in Crenshaw County are White / Caucasian (9,386 | 71.1%), Black / African American (3,059 | 23.2%), and Two or more Races (448 | 3.4%).
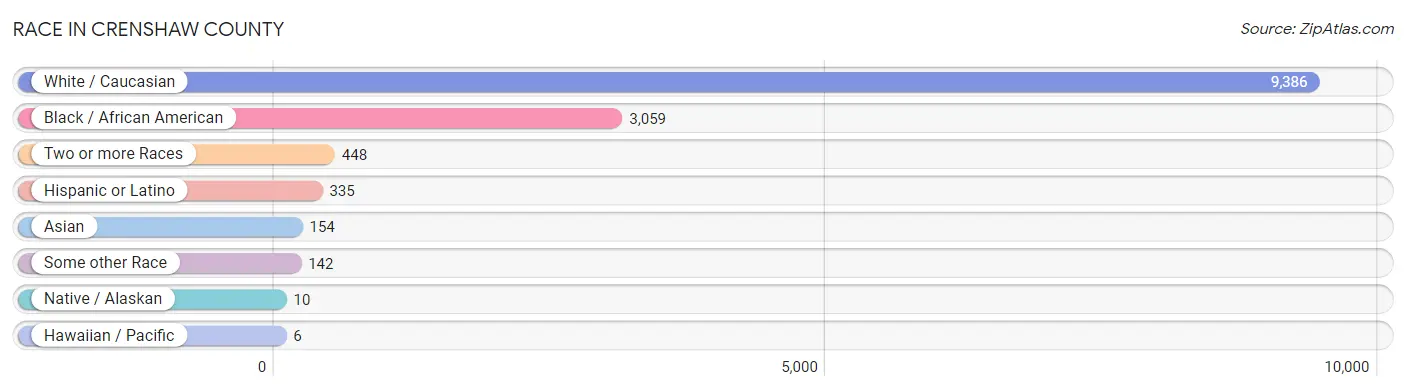
| Race | # Population | % Population |
| Asian | 154 | 1.2% |
| Black / African American | 3,059 | 23.2% |
| Hawaiian / Pacific | 6 | 0.1% |
| Hispanic or Latino | 335 | 2.5% |
| Native / Alaskan | 10 | 0.1% |
| White / Caucasian | 9,386 | 71.1% |
| Two or more Races | 448 | 3.4% |
| Some other Race | 142 | 1.1% |
| Total | 13,205 | 100.0% |
Ancestry in Crenshaw County
The most populous ancestries reported in Crenshaw County are American (2,996 | 22.7%), English (1,034 | 7.8%), Irish (698 | 5.3%), German (292 | 2.2%), and Mexican (235 | 1.8%), together accounting for 39.8% of all Crenshaw County residents.
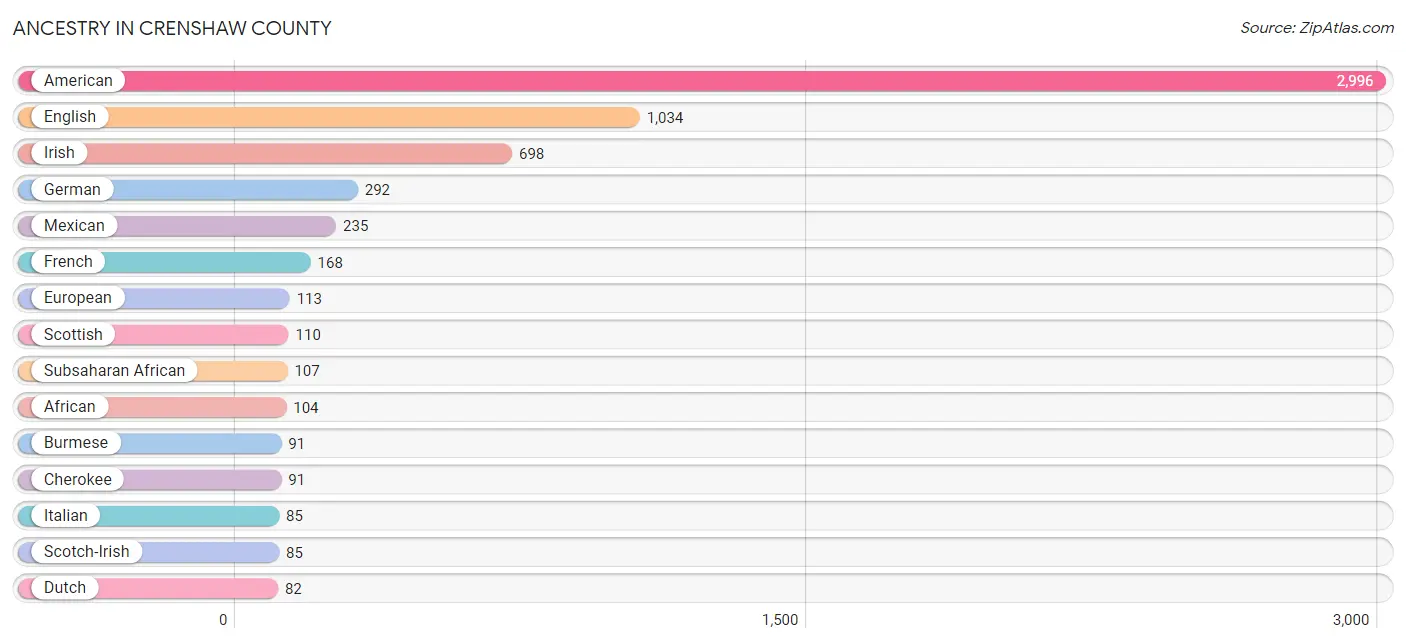
| Ancestry | # Population | % Population |
| African | 104 | 0.8% |
| American | 2,996 | 22.7% |
| Belgian | 8 | 0.1% |
| British | 8 | 0.1% |
| Burmese | 91 | 0.7% |
| Canadian | 8 | 0.1% |
| Celtic | 27 | 0.2% |
| Cherokee | 91 | 0.7% |
| Choctaw | 4 | 0.0% |
| Creek | 31 | 0.2% |
| Danish | 25 | 0.2% |
| Dutch | 82 | 0.6% |
| English | 1,034 | 7.8% |
| European | 113 | 0.9% |
| French | 168 | 1.3% |
| German | 292 | 2.2% |
| Greek | 10 | 0.1% |
| Guamanian / Chamorro | 6 | 0.1% |
| Irish | 698 | 5.3% |
| Italian | 85 | 0.6% |
| Korean | 43 | 0.3% |
| Mexican | 235 | 1.8% |
| Northern European | 5 | 0.0% |
| Norwegian | 24 | 0.2% |
| Polish | 17 | 0.1% |
| Portuguese | 12 | 0.1% |
| Puerto Rican | 9 | 0.1% |
| Russian | 5 | 0.0% |
| Scotch-Irish | 85 | 0.6% |
| Scottish | 110 | 0.8% |
| Spanish | 27 | 0.2% |
| Subsaharan African | 107 | 0.8% |
| Swedish | 67 | 0.5% |
| Swiss | 7 | 0.1% |
| Thai | 62 | 0.5% |
| Ukrainian | 4 | 0.0% |
| Welsh | 41 | 0.3% |
| Zimbabwean | 3 | 0.0% | View All 38 Rows |
Immigrants in Crenshaw County
The most numerous immigrant groups reported in Crenshaw County came from Central America (158 | 1.2%), Latin America (158 | 1.2%), Mexico (158 | 1.2%), Asia (147 | 1.1%), and India (62 | 0.5%), together accounting for 5.2% of all Crenshaw County residents.
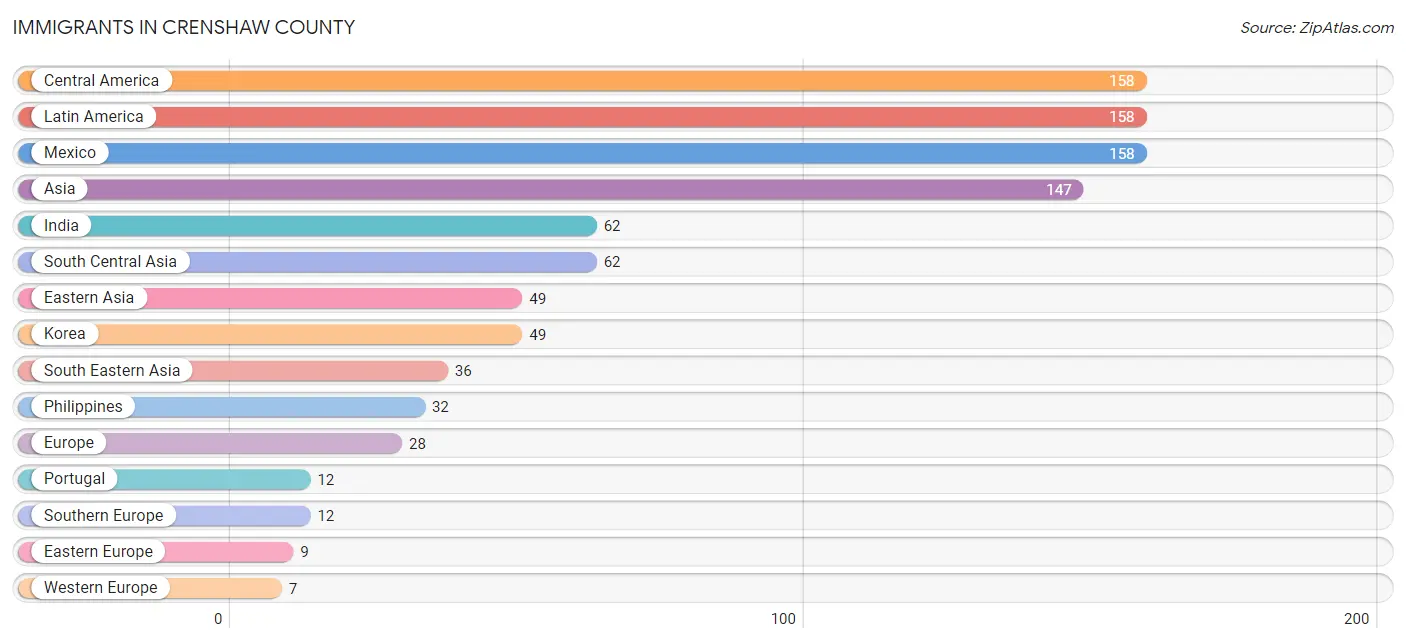
| Immigration Origin | # Population | % Population |
| Africa | 6 | 0.1% |
| Asia | 147 | 1.1% |
| Belgium | 5 | 0.0% |
| Canada | 4 | 0.0% |
| Central America | 158 | 1.2% |
| Congo | 3 | 0.0% |
| Eastern Africa | 3 | 0.0% |
| Eastern Asia | 49 | 0.4% |
| Eastern Europe | 9 | 0.1% |
| Europe | 28 | 0.2% |
| France | 2 | 0.0% |
| India | 62 | 0.5% |
| Korea | 49 | 0.4% |
| Latin America | 158 | 1.2% |
| Mexico | 158 | 1.2% |
| Middle Africa | 3 | 0.0% |
| Philippines | 32 | 0.2% |
| Portugal | 12 | 0.1% |
| Russia | 5 | 0.0% |
| South Central Asia | 62 | 0.5% |
| South Eastern Asia | 36 | 0.3% |
| Southern Europe | 12 | 0.1% |
| Ukraine | 4 | 0.0% |
| Vietnam | 4 | 0.0% |
| Western Europe | 7 | 0.1% |
| Zimbabwe | 3 | 0.0% | View All 26 Rows |
Sex and Age in Crenshaw County
Sex and Age in Crenshaw County
The most populous age groups in Crenshaw County are 10 to 14 Years (525 | 8.1%) for men and 60 to 64 Years (568 | 8.4%) for women.
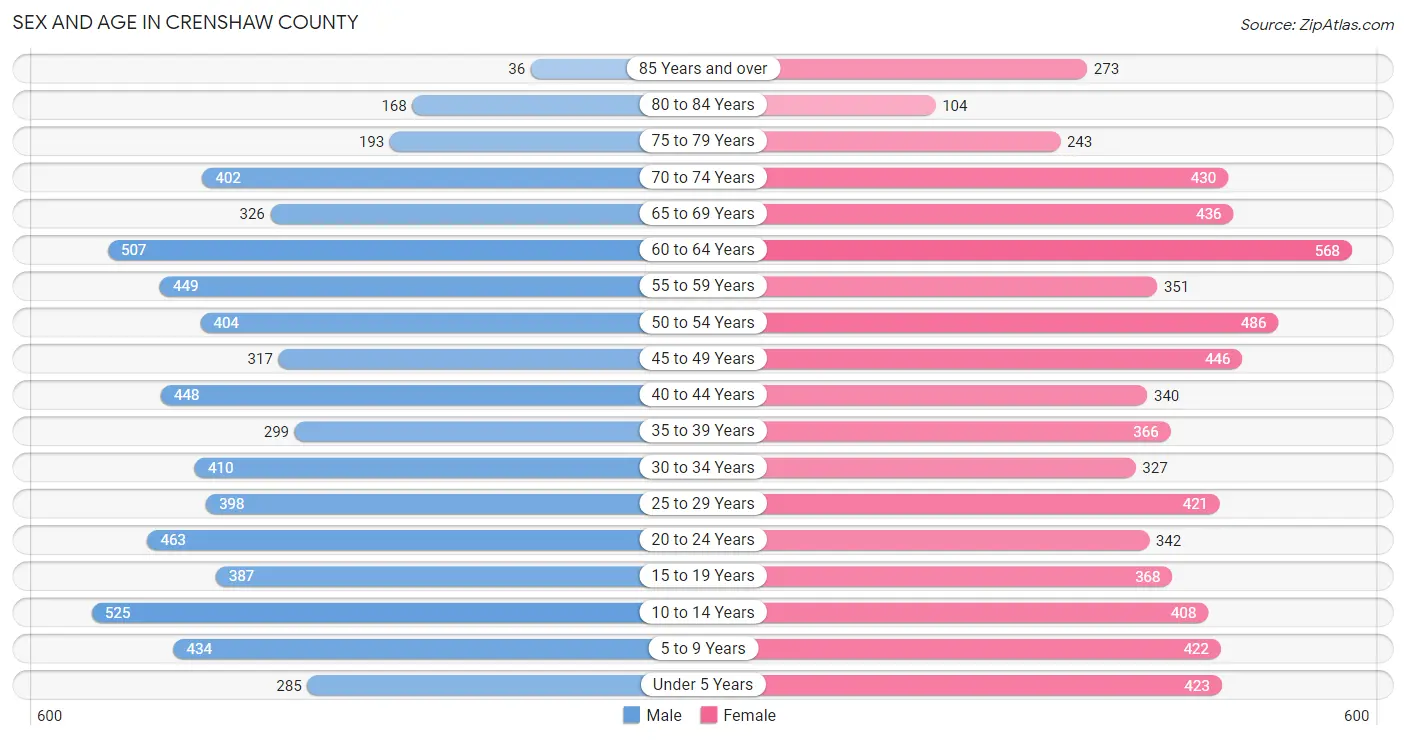
| Age Bracket | Male | Female |
| Under 5 Years | 285 (4.4%) | 423 (6.3%) |
| 5 to 9 Years | 434 (6.7%) | 422 (6.2%) |
| 10 to 14 Years | 525 (8.1%) | 408 (6.0%) |
| 15 to 19 Years | 387 (6.0%) | 368 (5.4%) |
| 20 to 24 Years | 463 (7.2%) | 342 (5.1%) |
| 25 to 29 Years | 398 (6.2%) | 421 (6.2%) |
| 30 to 34 Years | 410 (6.4%) | 327 (4.8%) |
| 35 to 39 Years | 299 (4.6%) | 366 (5.4%) |
| 40 to 44 Years | 448 (6.9%) | 340 (5.0%) |
| 45 to 49 Years | 317 (4.9%) | 446 (6.6%) |
| 50 to 54 Years | 404 (6.3%) | 486 (7.2%) |
| 55 to 59 Years | 449 (7.0%) | 351 (5.2%) |
| 60 to 64 Years | 507 (7.9%) | 568 (8.4%) |
| 65 to 69 Years | 326 (5.1%) | 436 (6.5%) |
| 70 to 74 Years | 402 (6.2%) | 430 (6.4%) |
| 75 to 79 Years | 193 (3.0%) | 243 (3.6%) |
| 80 to 84 Years | 168 (2.6%) | 104 (1.5%) |
| 85 Years and over | 36 (0.6%) | 273 (4.0%) |
| Total | 6,451 (100.0%) | 6,754 (100.0%) |
Families and Households in Crenshaw County
Median Family Size in Crenshaw County
The median family size in Crenshaw County is 3.49 persons per family, with single male/father families (288 | 9.6%) accounting for the largest median family size of 4.03 persons per family. On the other hand, married-couple families (2,129 | 70.7%) represent the smallest median family size with 3.32 persons per family.
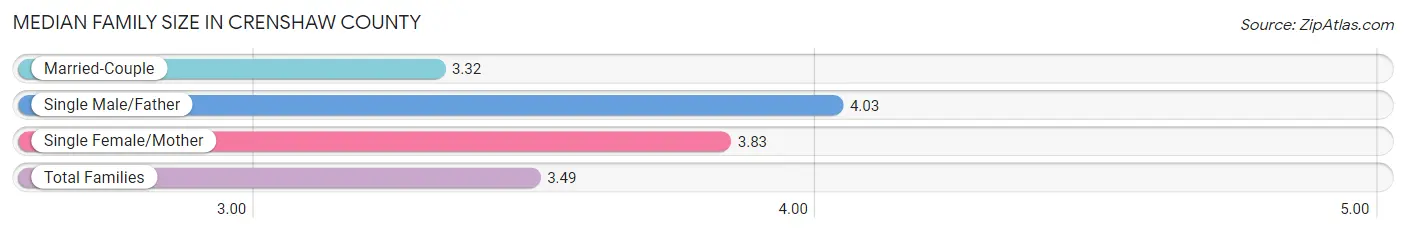
| Family Type | # Families | Family Size |
| Married-Couple | 2,129 (70.7%) | 3.32 |
| Single Male/Father | 288 (9.6%) | 4.03 |
| Single Female/Mother | 595 (19.8%) | 3.83 |
| Total Families | 3,012 (100.0%) | 3.49 |
Median Household Size in Crenshaw County
The median household size in Crenshaw County is 2.68 persons per household, with single male/father households (288 | 5.9%) accounting for the largest median household size of 4.38 persons per household. non-family households (1,827 | 37.8%) represent the smallest median household size with 1.24 persons per household.
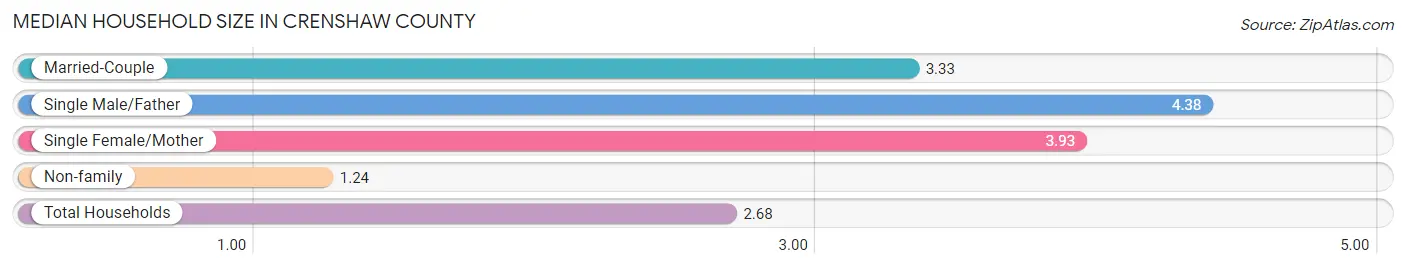
| Household Type | # Households | Household Size |
| Married-Couple | 2,129 (44.0%) | 3.33 |
| Single Male/Father | 288 (5.9%) | 4.38 |
| Single Female/Mother | 595 (12.3%) | 3.93 |
| Non-family | 1,827 (37.8%) | 1.24 |
| Total Households | 4,839 (100.0%) | 2.68 |
Household Size by Marriage Status in Crenshaw County
Out of a total of 4,839 households in Crenshaw County, 3,012 (62.2%) are family households, while 1,827 (37.8%) are nonfamily households. The most numerous type of family households are 2-person households, comprising 1,515, and the most common type of nonfamily households are 1-person households, comprising 1,645.
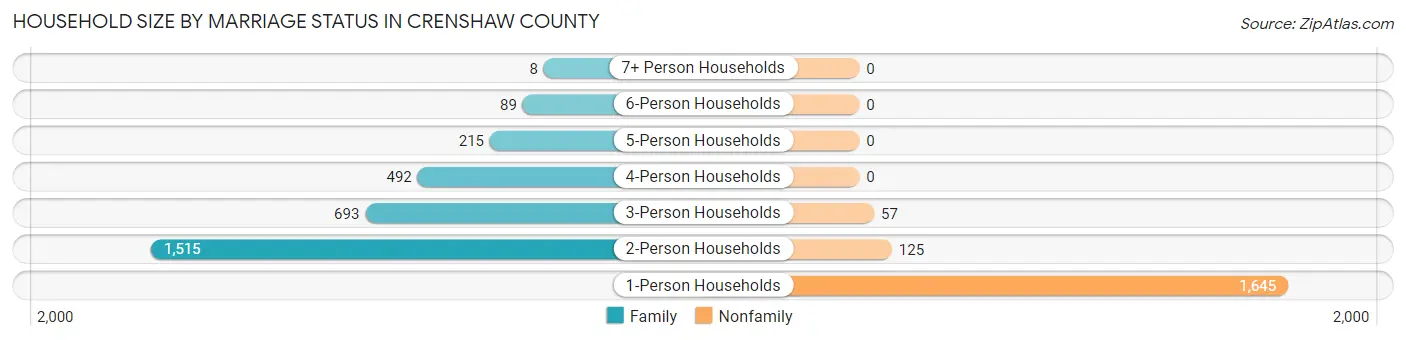
| Household Size | Family Households | Nonfamily Households |
| 1-Person Households | - | 1,645 (34.0%) |
| 2-Person Households | 1,515 (31.3%) | 125 (2.6%) |
| 3-Person Households | 693 (14.3%) | 57 (1.2%) |
| 4-Person Households | 492 (10.2%) | 0 (0.0%) |
| 5-Person Households | 215 (4.4%) | 0 (0.0%) |
| 6-Person Households | 89 (1.8%) | 0 (0.0%) |
| 7+ Person Households | 8 (0.2%) | 0 (0.0%) |
| Total | 3,012 (62.2%) | 1,827 (37.8%) |
Female Fertility in Crenshaw County
Fertility by Age in Crenshaw County
Average fertility rate in Crenshaw County is 49.0 births per 1,000 women. Women in the age bracket of 20 to 34 years have the highest fertility rate with 102.0 births per 1,000 women. Women in the age bracket of 20 to 34 years acount for 84.1% of all women with births.
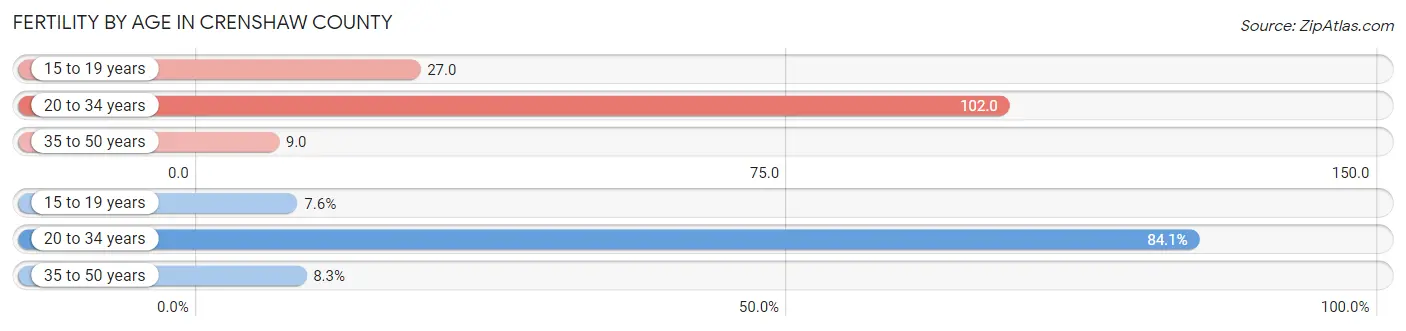
| Age Bracket | Women with Births | Births / 1,000 Women |
| 15 to 19 years | 10 (7.6%) | 27.0 |
| 20 to 34 years | 111 (84.1%) | 102.0 |
| 35 to 50 years | 11 (8.3%) | 9.0 |
| Total | 132 (100.0%) | 49.0 |
Fertility by Age by Marriage Status in Crenshaw County
50.8% of women with births (132) in Crenshaw County are married. The highest percentage of unmarried women with births falls into 15 to 19 years age bracket with 100.0% of them unmarried at the time of birth, while the lowest percentage of unmarried women with births belong to 35 to 50 years age bracket with 0.0% of them unmarried.
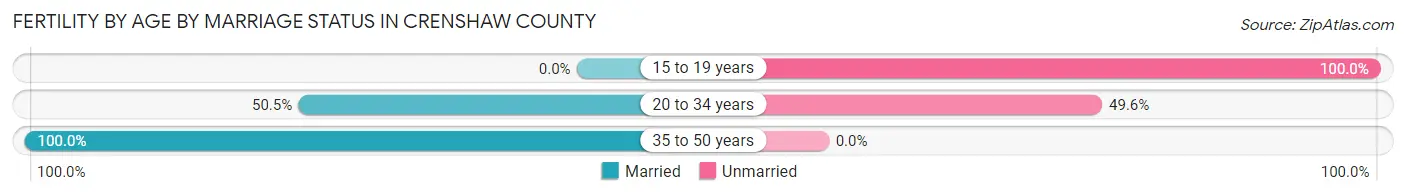
| Age Bracket | Married | Unmarried |
| 15 to 19 years | 0 (0.0%) | 10 (100.0%) |
| 20 to 34 years | 56 (50.4%) | 55 (49.5%) |
| 35 to 50 years | 11 (100.0%) | 0 (0.0%) |
| Total | 67 (50.8%) | 65 (49.2%) |
Fertility by Education in Crenshaw County
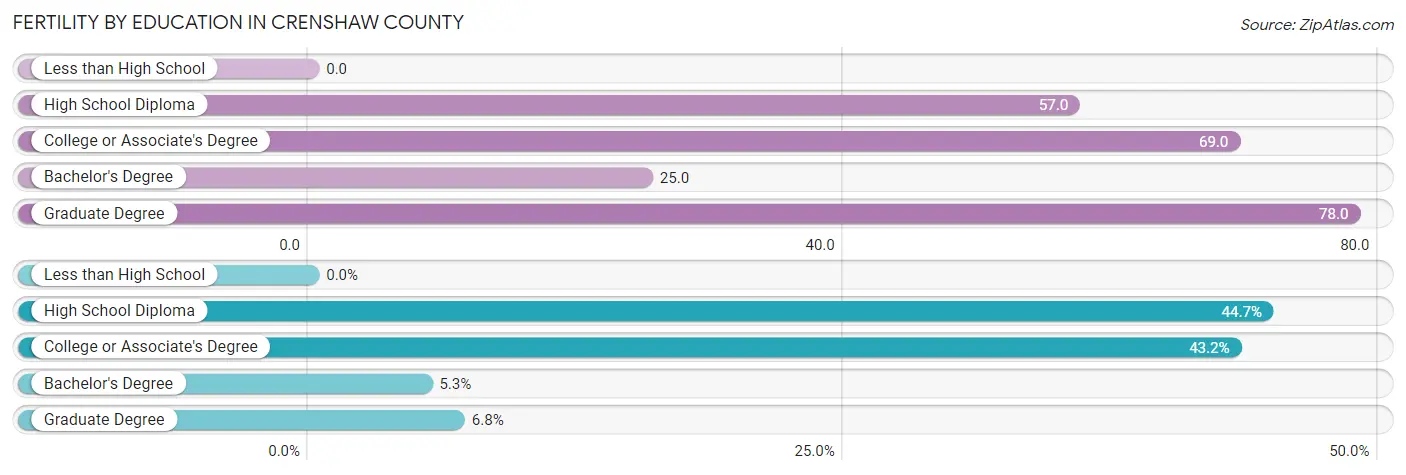
| Educational Attainment | Women with Births | Births / 1,000 Women |
| Less than High School | 0 (0.0%) | 0.0 |
| High School Diploma | 59 (44.7%) | 57.0 |
| College or Associate's Degree | 57 (43.2%) | 69.0 |
| Bachelor's Degree | 7 (5.3%) | 25.0 |
| Graduate Degree | 9 (6.8%) | 78.0 |
| Total | 132 (100.0%) | 49.0 |
Fertility by Education by Marriage Status in Crenshaw County
49.2% of women with births in Crenshaw County are unmarried. Women with the educational attainment of bachelor's degree are most likely to be married with 100.0% of them married at childbirth, while women with the educational attainment of college or associate's degree are least likely to be married with 70.2% of them unmarried at childbirth.
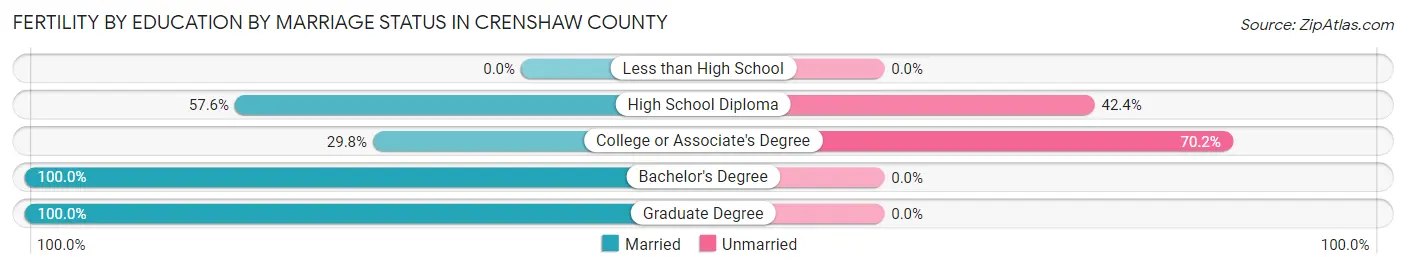
| Educational Attainment | Married | Unmarried |
| Less than High School | 0 (0.0%) | 0 (0.0%) |
| High School Diploma | 34 (57.6%) | 25 (42.4%) |
| College or Associate's Degree | 17 (29.8%) | 40 (70.2%) |
| Bachelor's Degree | 7 (100.0%) | 0 (0.0%) |
| Graduate Degree | 9 (100.0%) | 0 (0.0%) |
| Total | 67 (50.8%) | 65 (49.2%) |
Employment Characteristics in Crenshaw County
Employment by Class of Employer in Crenshaw County
Among the 5,128 employed individuals in Crenshaw County, private company employees (3,549 | 69.2%), self-employed (not incorporated) (487 | 9.5%), and local government employees (367 | 7.2%) make up the most common classes of employment.
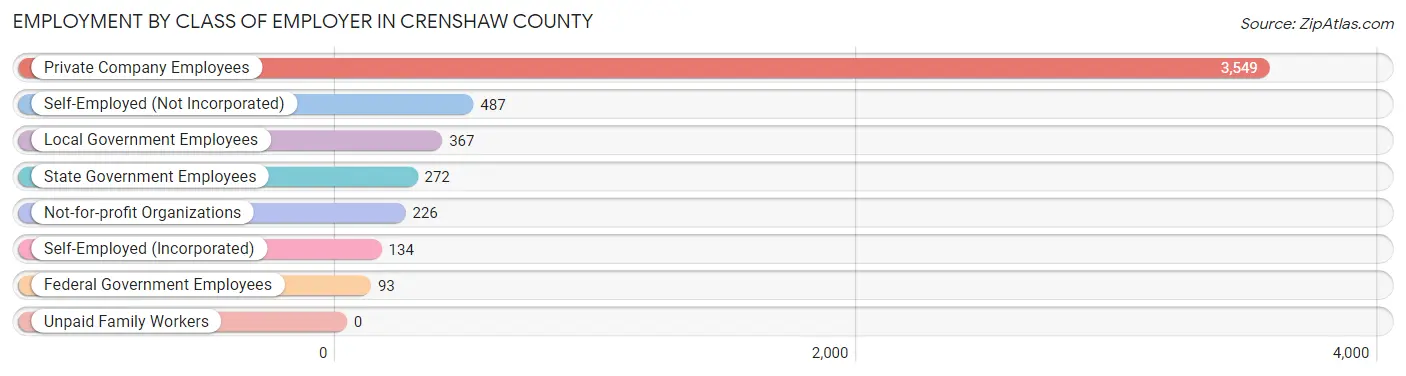
| Employer Class | # Employees | % Employees |
| Private Company Employees | 3,549 | 69.2% |
| Self-Employed (Incorporated) | 134 | 2.6% |
| Self-Employed (Not Incorporated) | 487 | 9.5% |
| Not-for-profit Organizations | 226 | 4.4% |
| Local Government Employees | 367 | 7.2% |
| State Government Employees | 272 | 5.3% |
| Federal Government Employees | 93 | 1.8% |
| Unpaid Family Workers | 0 | 0.0% |
| Total | 5,128 | 100.0% |
Employment Status by Age in Crenshaw County
According to the labor force statistics for Crenshaw County, out of the total population over 16 years of age (10,556), 52.0% or 5,489 individuals are in the labor force, with 6.1% or 335 of them unemployed. The age group with the highest labor force participation rate is 35 to 44 years, with 80.3% or 1,167 individuals in the labor force. Within the labor force, the 16 to 19 years age range has the highest percentage of unemployed individuals, with 29.8% or 37 of them being unemployed.
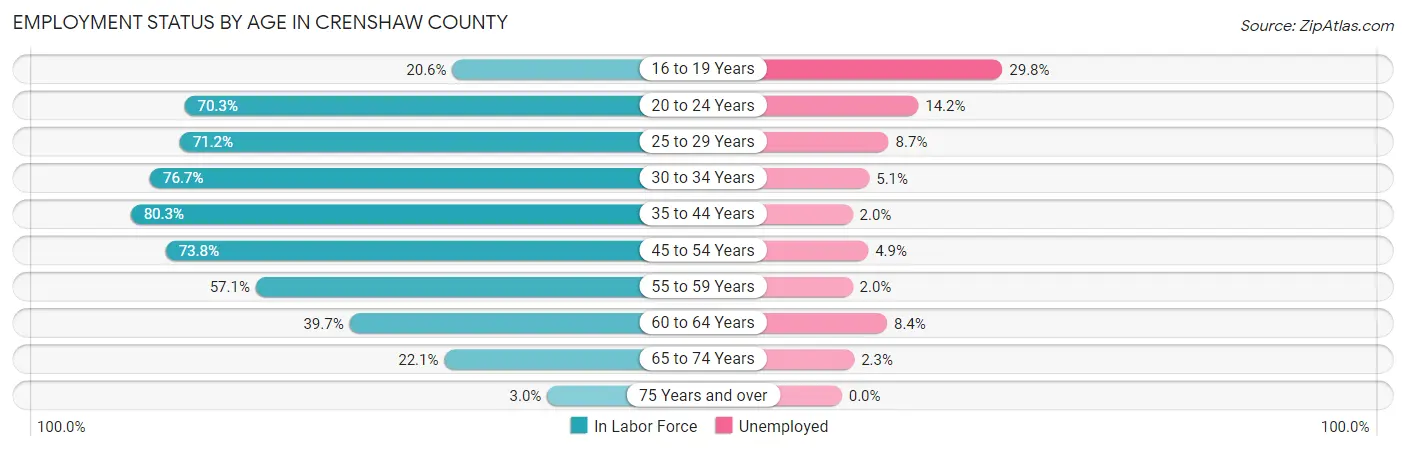
| Age Bracket | In Labor Force | Unemployed |
| 16 to 19 Years | 124 (20.6%) | 37 (29.8%) |
| 20 to 24 Years | 566 (70.3%) | 80 (14.2%) |
| 25 to 29 Years | 583 (71.2%) | 51 (8.7%) |
| 30 to 34 Years | 565 (76.7%) | 29 (5.1%) |
| 35 to 44 Years | 1,167 (80.3%) | 23 (2.0%) |
| 45 to 54 Years | 1,220 (73.8%) | 60 (4.9%) |
| 55 to 59 Years | 457 (57.1%) | 9 (2.0%) |
| 60 to 64 Years | 427 (39.7%) | 36 (8.4%) |
| 65 to 74 Years | 352 (22.1%) | 8 (2.3%) |
| 75 Years and over | 31 (3.0%) | 0 (0.0%) |
| Total | 5,489 (52.0%) | 335 (6.1%) |
Employment Status by Educational Attainment in Crenshaw County
According to labor force statistics for Crenshaw County, 67.6% of individuals (4,419) out of the total population between 25 and 64 years of age (6,537) are in the labor force, with 4.7% or 208 of them being unemployed. The group with the highest labor force participation rate are those with the educational attainment of bachelor's degree or higher, with 77.5% or 839 individuals in the labor force. Within the labor force, individuals with less than high school education have the highest percentage of unemployment, with 15.7% or 70 of them being unemployed.
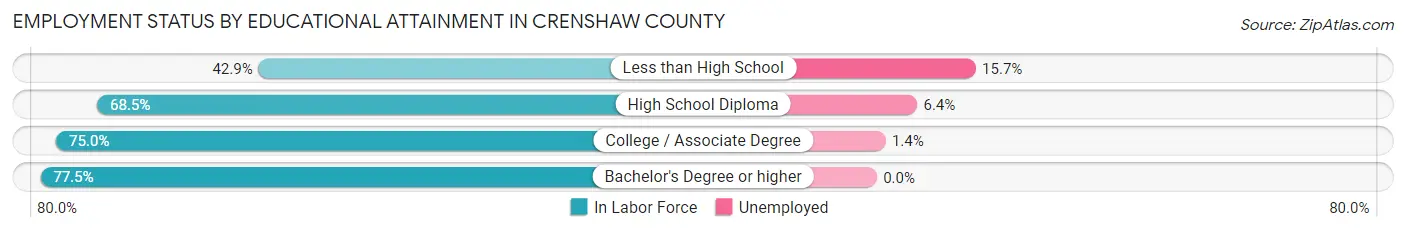
| Educational Attainment | In Labor Force | Unemployed |
| Less than High School | 446 (42.9%) | 163 (15.7%) |
| High School Diploma | 1,882 (68.5%) | 176 (6.4%) |
| College / Associate Degree | 1,251 (75.0%) | 23 (1.4%) |
| Bachelor's Degree or higher | 839 (77.5%) | 0 (0.0%) |
| Total | 4,419 (67.6%) | 307 (4.7%) |
Employment Occupations by Sex in Crenshaw County
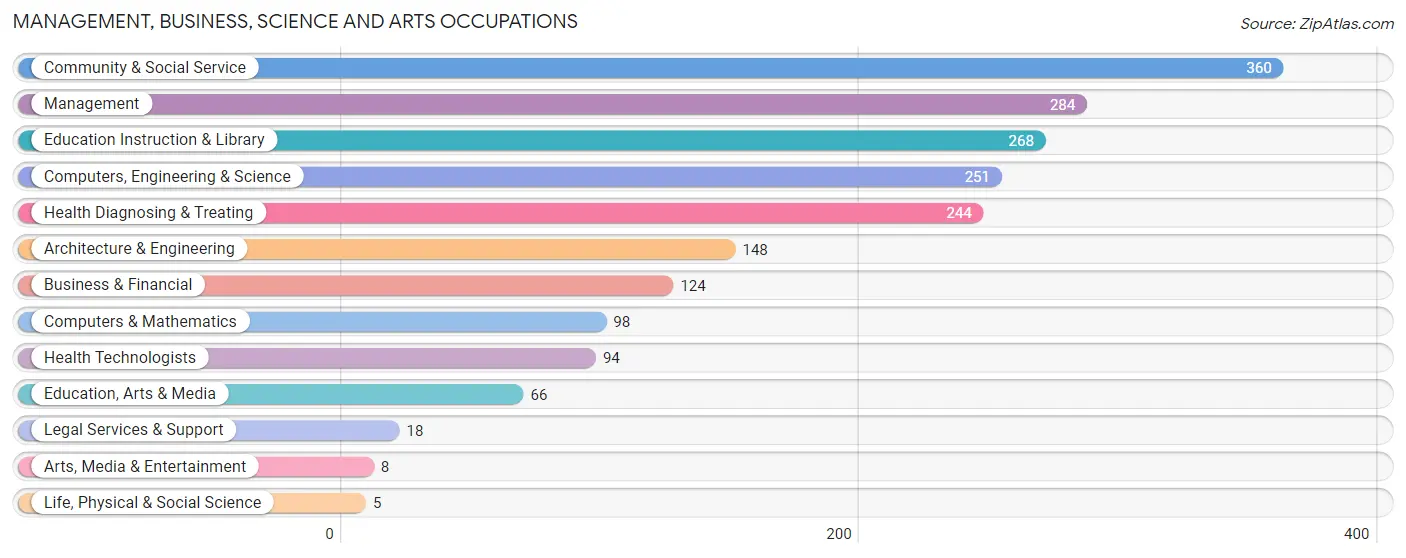
Management, Business, Science and Arts Occupations
The most common Management, Business, Science and Arts occupations in Crenshaw County are Community & Social Service (360 | 7.0%), Management (284 | 5.5%), Education Instruction & Library (268 | 5.2%), Computers, Engineering & Science (251 | 4.9%), and Health Diagnosing & Treating (244 | 4.8%).
Management, Business, Science and Arts Occupations by Sex
Within the Management, Business, Science and Arts occupations in Crenshaw County, the most male-oriented occupations are Architecture & Engineering (98.7%), Computers, Engineering & Science (89.2%), and Computers & Mathematics (79.6%), while the most female-oriented occupations are Life, Physical & Social Science (100.0%), Arts, Media & Entertainment (100.0%), and Health Diagnosing & Treating (95.5%).
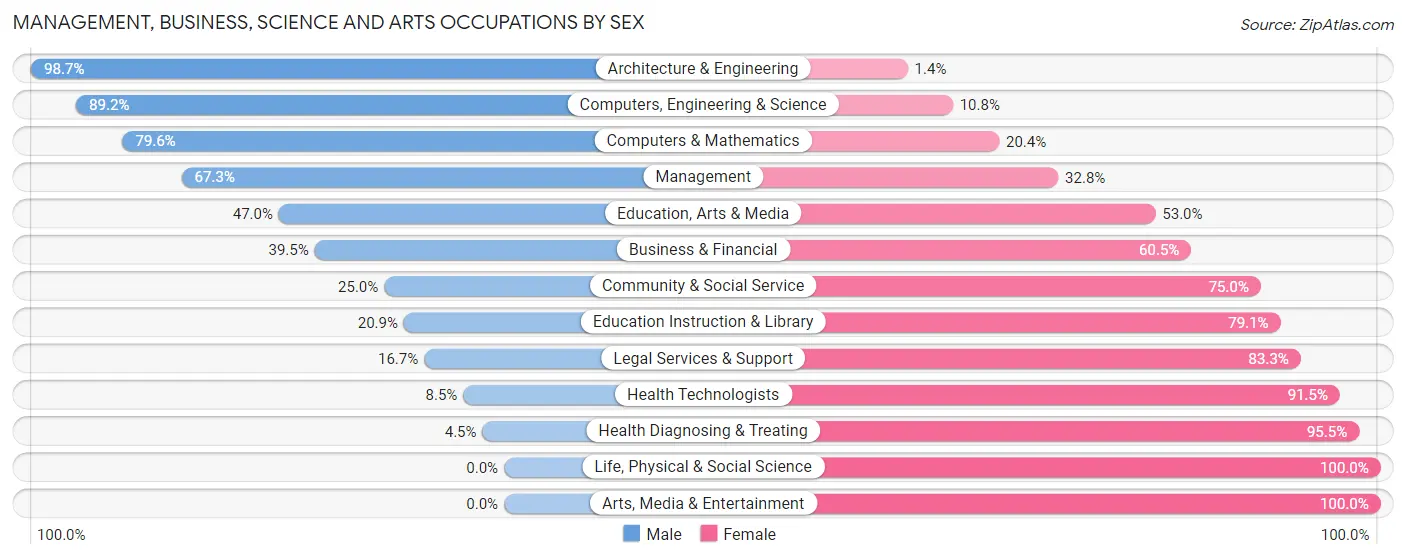
| Occupation | Male | Female |
| Management | 191 (67.2%) | 93 (32.8%) |
| Business & Financial | 49 (39.5%) | 75 (60.5%) |
| Computers, Engineering & Science | 224 (89.2%) | 27 (10.8%) |
| Computers & Mathematics | 78 (79.6%) | 20 (20.4%) |
| Architecture & Engineering | 146 (98.7%) | 2 (1.3%) |
| Life, Physical & Social Science | 0 (0.0%) | 5 (100.0%) |
| Community & Social Service | 90 (25.0%) | 270 (75.0%) |
| Education, Arts & Media | 31 (47.0%) | 35 (53.0%) |
| Legal Services & Support | 3 (16.7%) | 15 (83.3%) |
| Education Instruction & Library | 56 (20.9%) | 212 (79.1%) |
| Arts, Media & Entertainment | 0 (0.0%) | 8 (100.0%) |
| Health Diagnosing & Treating | 11 (4.5%) | 233 (95.5%) |
| Health Technologists | 8 (8.5%) | 86 (91.5%) |
| Total (Category) | 565 (44.7%) | 698 (55.3%) |
| Total (Overall) | 2,678 (52.2%) | 2,454 (47.8%) |
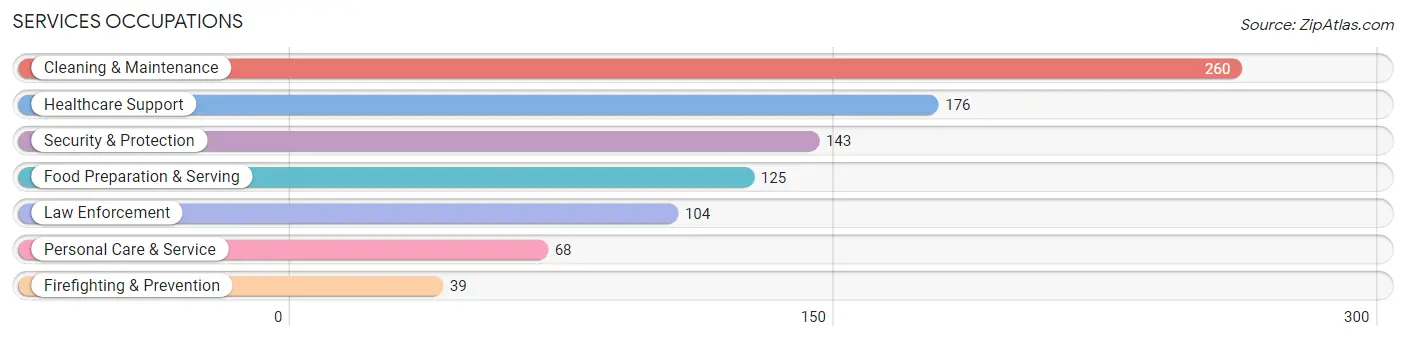
Services Occupations
The most common Services occupations in Crenshaw County are Cleaning & Maintenance (260 | 5.1%), Healthcare Support (176 | 3.4%), Security & Protection (143 | 2.8%), Food Preparation & Serving (125 | 2.4%), and Law Enforcement (104 | 2.0%).
Services Occupations by Sex
Within the Services occupations in Crenshaw County, the most male-oriented occupations are Law Enforcement (100.0%), Security & Protection (96.5%), and Firefighting & Prevention (87.2%), while the most female-oriented occupations are Healthcare Support (99.4%), Personal Care & Service (85.3%), and Food Preparation & Serving (65.6%).
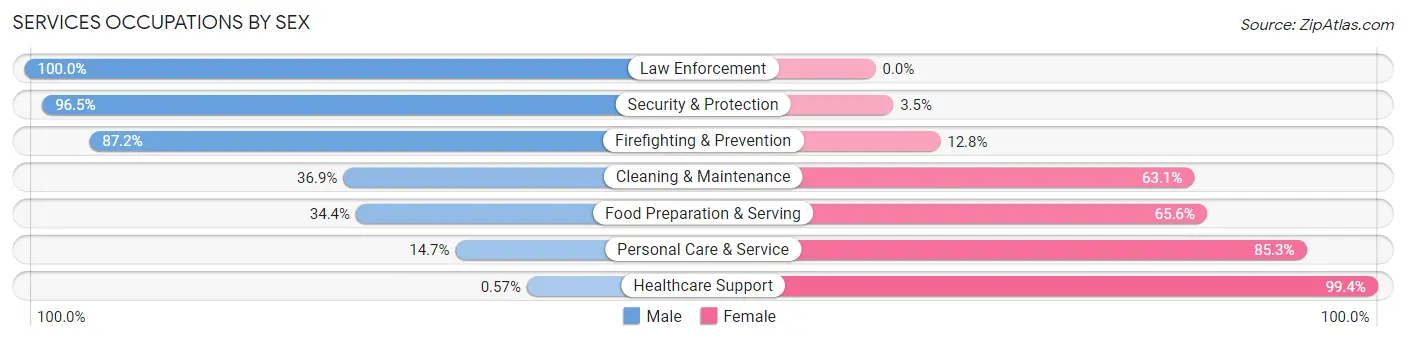
| Occupation | Male | Female |
| Healthcare Support | 1 (0.6%) | 175 (99.4%) |
| Security & Protection | 138 (96.5%) | 5 (3.5%) |
| Firefighting & Prevention | 34 (87.2%) | 5 (12.8%) |
| Law Enforcement | 104 (100.0%) | 0 (0.0%) |
| Food Preparation & Serving | 43 (34.4%) | 82 (65.6%) |
| Cleaning & Maintenance | 96 (36.9%) | 164 (63.1%) |
| Personal Care & Service | 10 (14.7%) | 58 (85.3%) |
| Total (Category) | 288 (37.3%) | 484 (62.7%) |
| Total (Overall) | 2,678 (52.2%) | 2,454 (47.8%) |
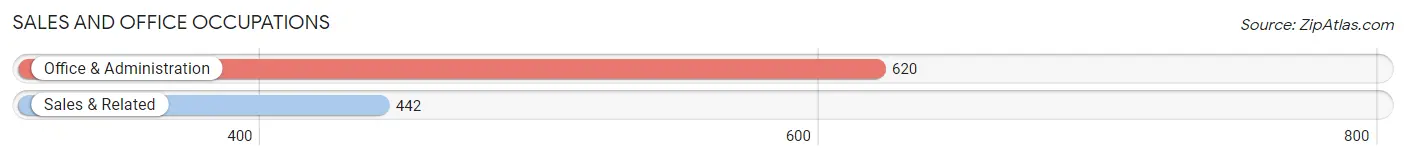
Sales and Office Occupations
The most common Sales and Office occupations in Crenshaw County are Office & Administration (620 | 12.1%), and Sales & Related (442 | 8.6%).
Sales and Office Occupations by Sex
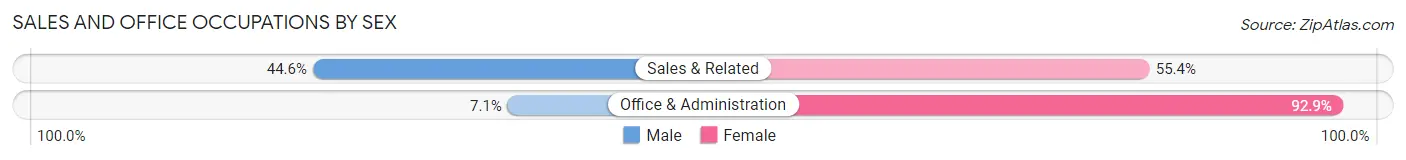
| Occupation | Male | Female |
| Sales & Related | 197 (44.6%) | 245 (55.4%) |
| Office & Administration | 44 (7.1%) | 576 (92.9%) |
| Total (Category) | 241 (22.7%) | 821 (77.3%) |
| Total (Overall) | 2,678 (52.2%) | 2,454 (47.8%) |
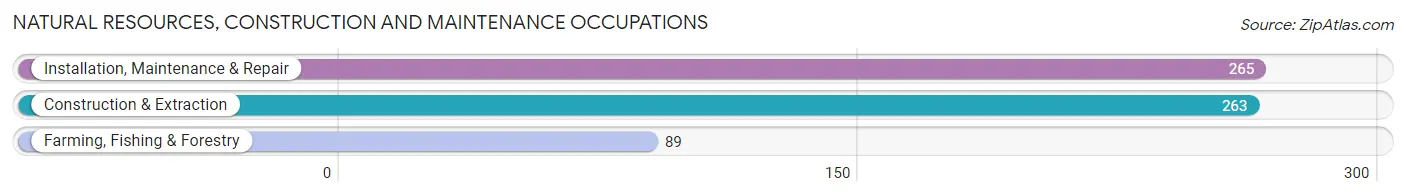
Natural Resources, Construction and Maintenance Occupations
The most common Natural Resources, Construction and Maintenance occupations in Crenshaw County are Installation, Maintenance & Repair (265 | 5.2%), Construction & Extraction (263 | 5.1%), and Farming, Fishing & Forestry (89 | 1.7%).
Natural Resources, Construction and Maintenance Occupations by Sex
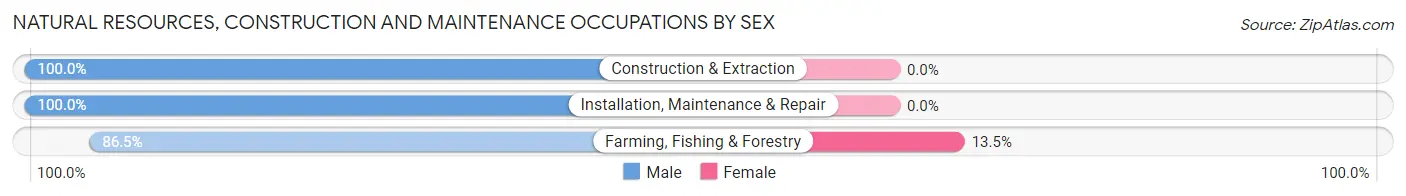
| Occupation | Male | Female |
| Farming, Fishing & Forestry | 77 (86.5%) | 12 (13.5%) |
| Construction & Extraction | 263 (100.0%) | 0 (0.0%) |
| Installation, Maintenance & Repair | 265 (100.0%) | 0 (0.0%) |
| Total (Category) | 605 (98.1%) | 12 (1.9%) |
| Total (Overall) | 2,678 (52.2%) | 2,454 (47.8%) |
Production, Transportation and Moving Occupations
The most common Production, Transportation and Moving occupations in Crenshaw County are Production (857 | 16.7%), Transportation (370 | 7.2%), and Material Moving (191 | 3.7%).
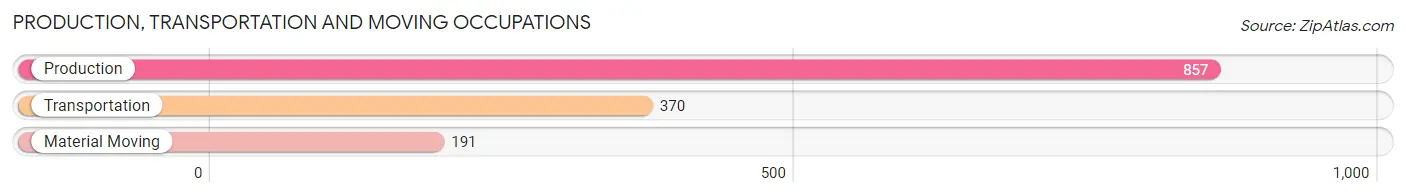
Production, Transportation and Moving Occupations by Sex
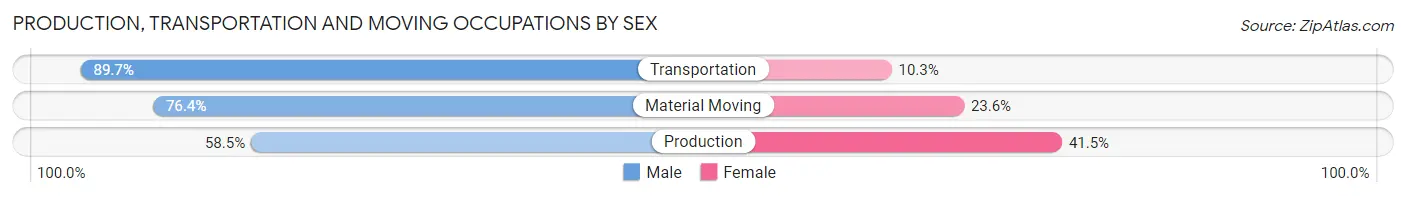
| Occupation | Male | Female |
| Production | 501 (58.5%) | 356 (41.5%) |
| Transportation | 332 (89.7%) | 38 (10.3%) |
| Material Moving | 146 (76.4%) | 45 (23.6%) |
| Total (Category) | 979 (69.0%) | 439 (31.0%) |
| Total (Overall) | 2,678 (52.2%) | 2,454 (47.8%) |
Employment Industries by Sex in Crenshaw County
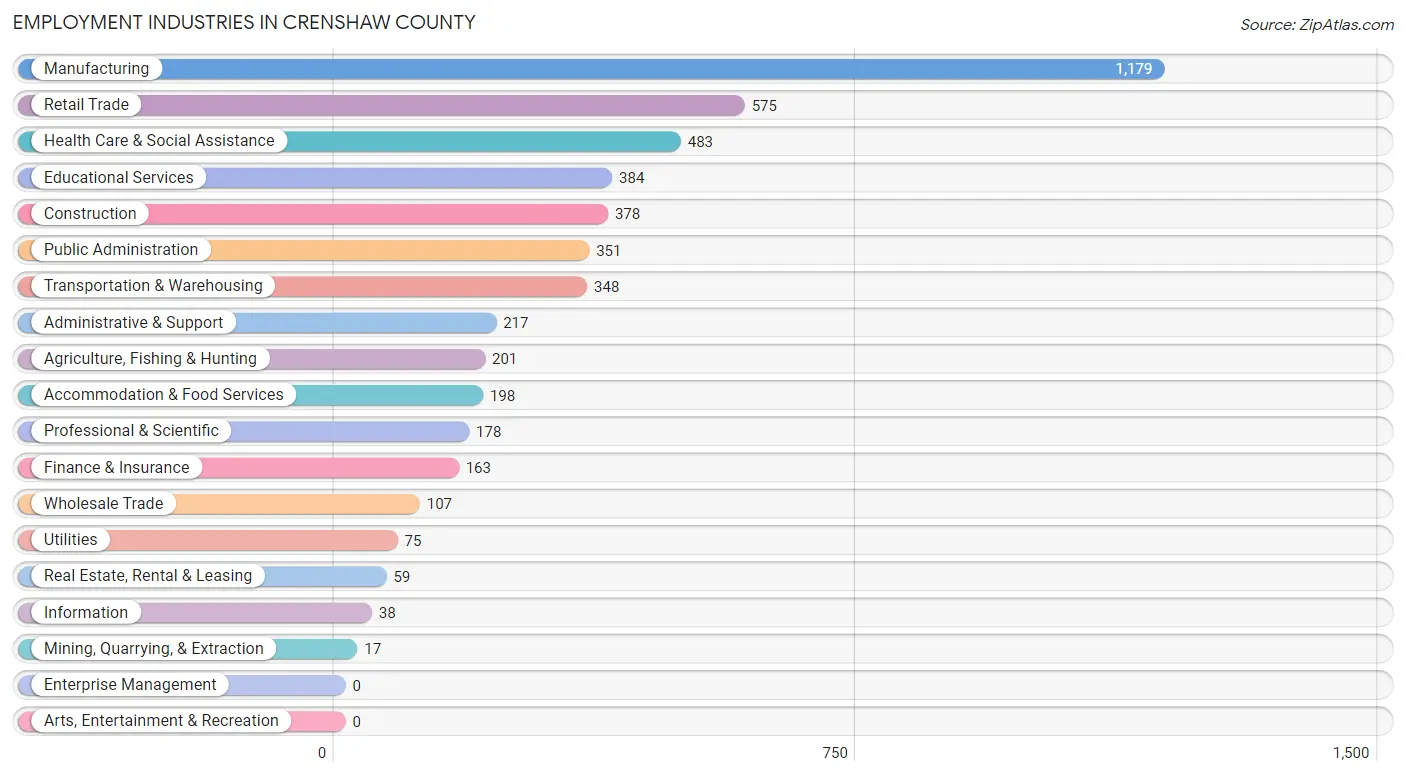
Employment Industries in Crenshaw County
The major employment industries in Crenshaw County include Manufacturing (1,179 | 23.0%), Retail Trade (575 | 11.2%), Health Care & Social Assistance (483 | 9.4%), Educational Services (384 | 7.5%), and Construction (378 | 7.4%).
Employment Industries by Sex in Crenshaw County
The Crenshaw County industries that see more men than women are Mining, Quarrying, & Extraction (100.0%), Construction (97.1%), and Agriculture, Fishing & Hunting (88.6%), whereas the industries that tend to have a higher number of women are Health Care & Social Assistance (93.8%), Educational Services (80.7%), and Information (78.9%).
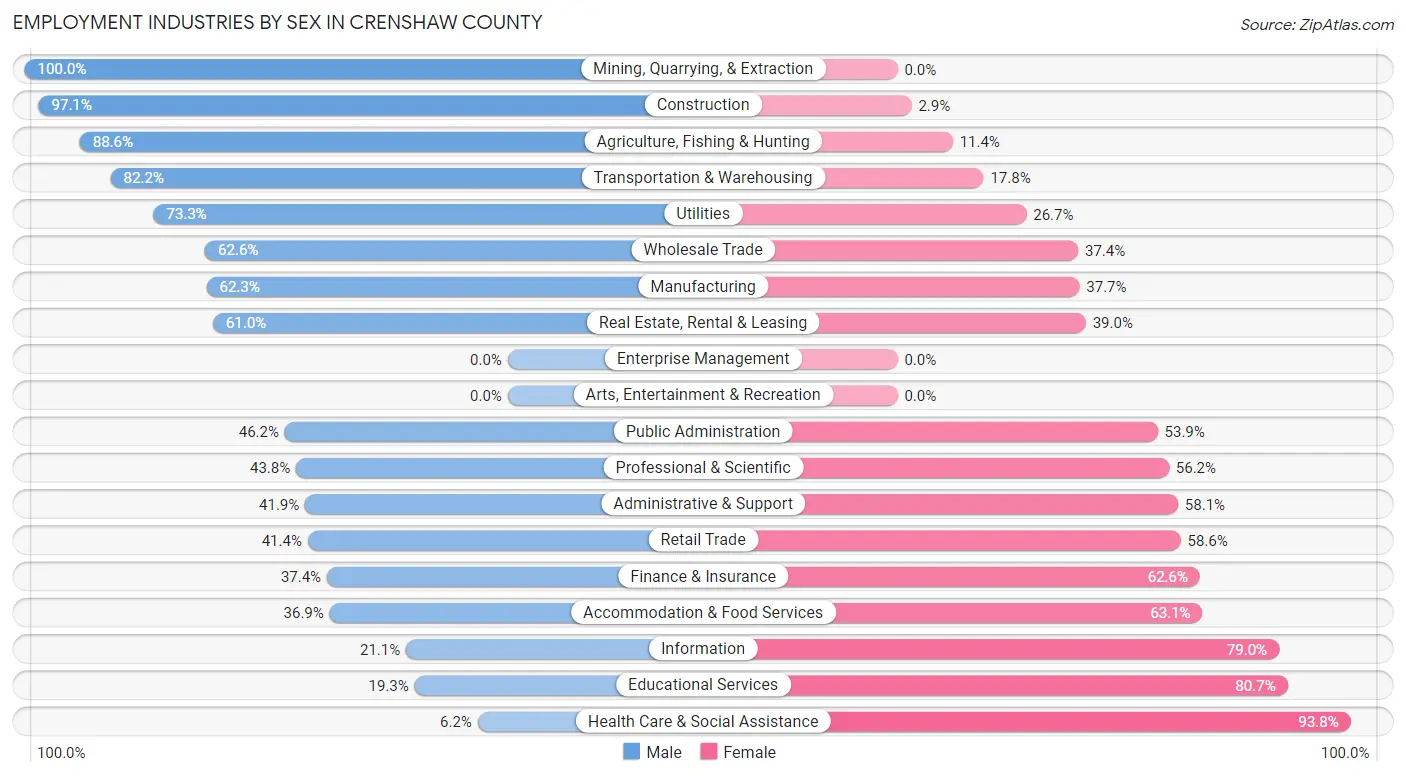
| Industry | Male | Female |
| Agriculture, Fishing & Hunting | 178 (88.6%) | 23 (11.4%) |
| Mining, Quarrying, & Extraction | 17 (100.0%) | 0 (0.0%) |
| Construction | 367 (97.1%) | 11 (2.9%) |
| Manufacturing | 735 (62.3%) | 444 (37.7%) |
| Wholesale Trade | 67 (62.6%) | 40 (37.4%) |
| Retail Trade | 238 (41.4%) | 337 (58.6%) |
| Transportation & Warehousing | 286 (82.2%) | 62 (17.8%) |
| Utilities | 55 (73.3%) | 20 (26.7%) |
| Information | 8 (21.0%) | 30 (78.9%) |
| Finance & Insurance | 61 (37.4%) | 102 (62.6%) |
| Real Estate, Rental & Leasing | 36 (61.0%) | 23 (39.0%) |
| Professional & Scientific | 78 (43.8%) | 100 (56.2%) |
| Enterprise Management | 0 (0.0%) | 0 (0.0%) |
| Administrative & Support | 91 (41.9%) | 126 (58.1%) |
| Educational Services | 74 (19.3%) | 310 (80.7%) |
| Health Care & Social Assistance | 30 (6.2%) | 453 (93.8%) |
| Arts, Entertainment & Recreation | 0 (0.0%) | 0 (0.0%) |
| Accommodation & Food Services | 73 (36.9%) | 125 (63.1%) |
| Public Administration | 162 (46.2%) | 189 (53.8%) |
| Total | 2,678 (52.2%) | 2,454 (47.8%) |
Education in Crenshaw County
School Enrollment in Crenshaw County
The most common levels of schooling among the 2,705 students in Crenshaw County are middle school (742 | 27.4%), elementary school (720 | 26.6%), and high school (596 | 22.0%).
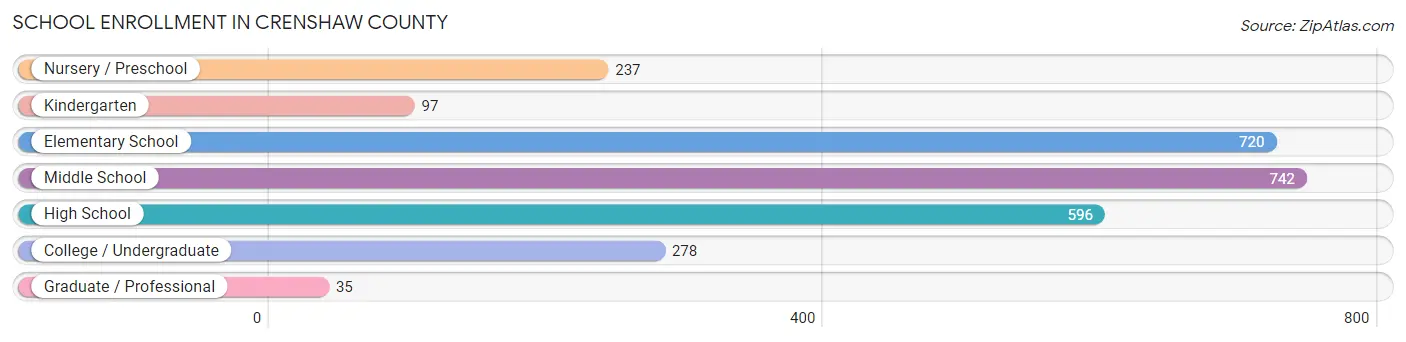
| School Level | # Students | % Students |
| Nursery / Preschool | 237 | 8.8% |
| Kindergarten | 97 | 3.6% |
| Elementary School | 720 | 26.6% |
| Middle School | 742 | 27.4% |
| High School | 596 | 22.0% |
| College / Undergraduate | 278 | 10.3% |
| Graduate / Professional | 35 | 1.3% |
| Total | 2,705 | 100.0% |
School Enrollment by Age by Funding Source in Crenshaw County
Out of a total of 2,705 students who are enrolled in schools in Crenshaw County, 249 (9.2%) attend a private institution, while the remaining 2,456 (90.8%) are enrolled in public schools. The age group of 15 to 17 year olds has the highest likelihood of being enrolled in private schools, with 108 (21.9% in the age bracket) enrolled. Conversely, the age group of 18 to 19 year olds has the lowest likelihood of being enrolled in a private school, with 116 (100.0% in the age bracket) attending a public institution.
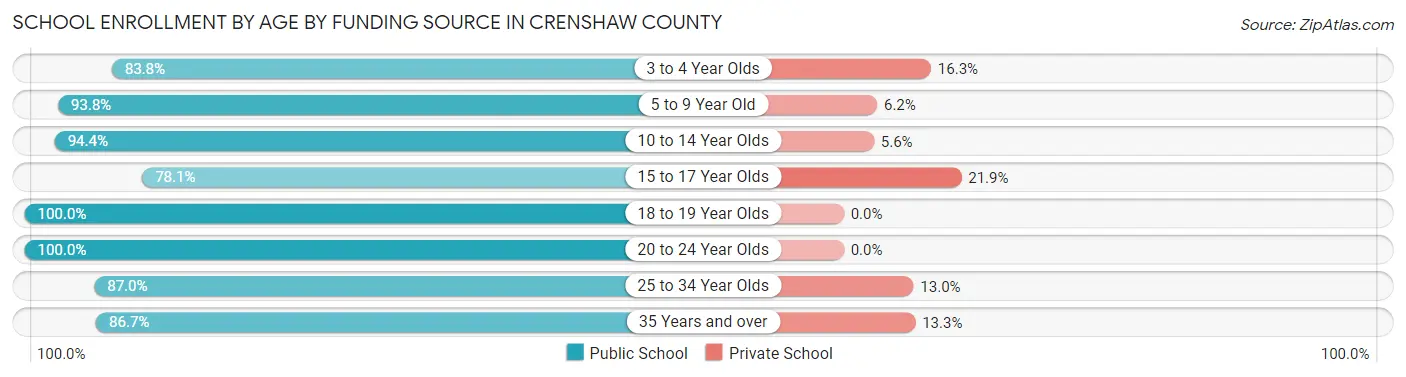
| Age Bracket | Public School | Private School |
| 3 to 4 Year Olds | 134 (83.8%) | 26 (16.3%) |
| 5 to 9 Year Old | 755 (93.8%) | 50 (6.2%) |
| 10 to 14 Year Olds | 823 (94.4%) | 49 (5.6%) |
| 15 to 17 Year Olds | 385 (78.1%) | 108 (21.9%) |
| 18 to 19 Year Olds | 116 (100.0%) | 0 (0.0%) |
| 20 to 24 Year Olds | 137 (100.0%) | 0 (0.0%) |
| 25 to 34 Year Olds | 67 (87.0%) | 10 (13.0%) |
| 35 Years and over | 39 (86.7%) | 6 (13.3%) |
| Total | 2,456 (90.8%) | 249 (9.2%) |
Educational Attainment by Field of Study in Crenshaw County
Business (457 | 27.9%), education (376 | 23.0%), science & technology (148 | 9.0%), engineering (127 | 7.8%), and social sciences (117 | 7.1%) are the most common fields of study among 1,637 individuals in Crenshaw County who have obtained a bachelor's degree or higher.
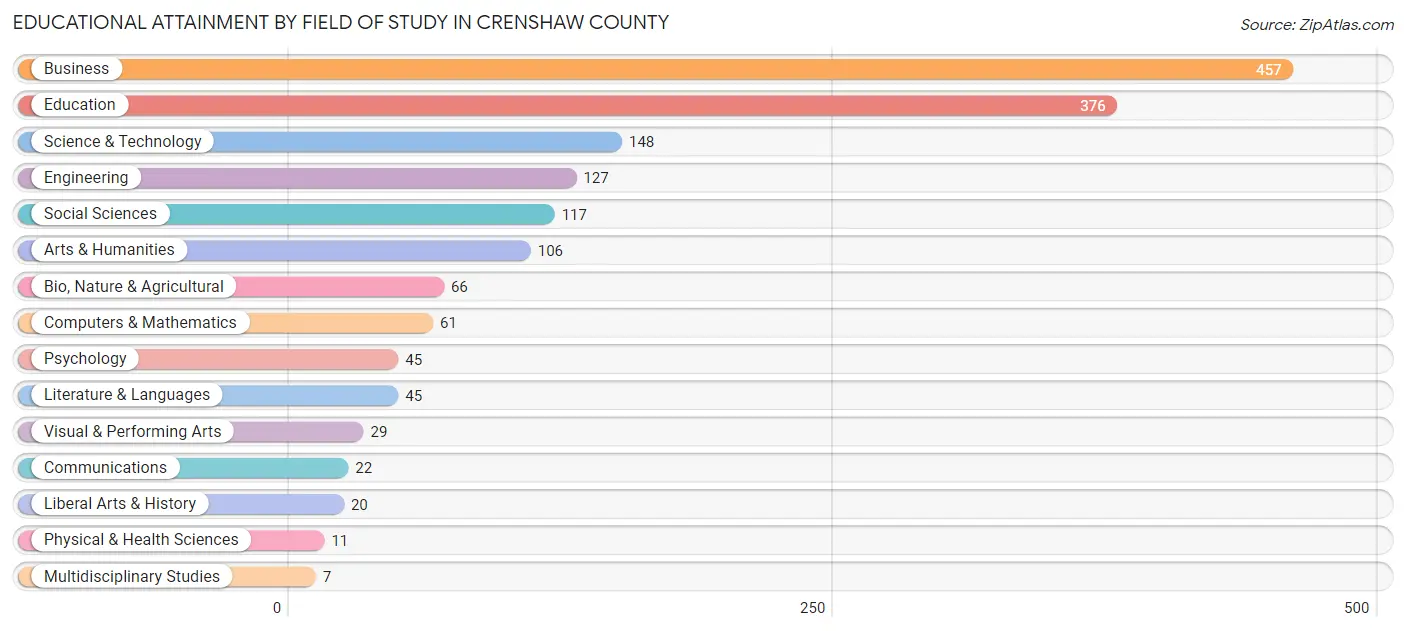
| Field of Study | # Graduates | % Graduates |
| Computers & Mathematics | 61 | 3.7% |
| Bio, Nature & Agricultural | 66 | 4.0% |
| Physical & Health Sciences | 11 | 0.7% |
| Psychology | 45 | 2.8% |
| Social Sciences | 117 | 7.1% |
| Engineering | 127 | 7.8% |
| Multidisciplinary Studies | 7 | 0.4% |
| Science & Technology | 148 | 9.0% |
| Business | 457 | 27.9% |
| Education | 376 | 23.0% |
| Literature & Languages | 45 | 2.8% |
| Liberal Arts & History | 20 | 1.2% |
| Visual & Performing Arts | 29 | 1.8% |
| Communications | 22 | 1.3% |
| Arts & Humanities | 106 | 6.5% |
| Total | 1,637 | 100.0% |
Transportation & Commute in Crenshaw County
Vehicle Availability by Sex in Crenshaw County
The most prevalent vehicle ownership categories in Crenshaw County are males with 2 vehicles (1,230, accounting for 46.0%) and females with 2 vehicles (1,009, making up 50.1%).
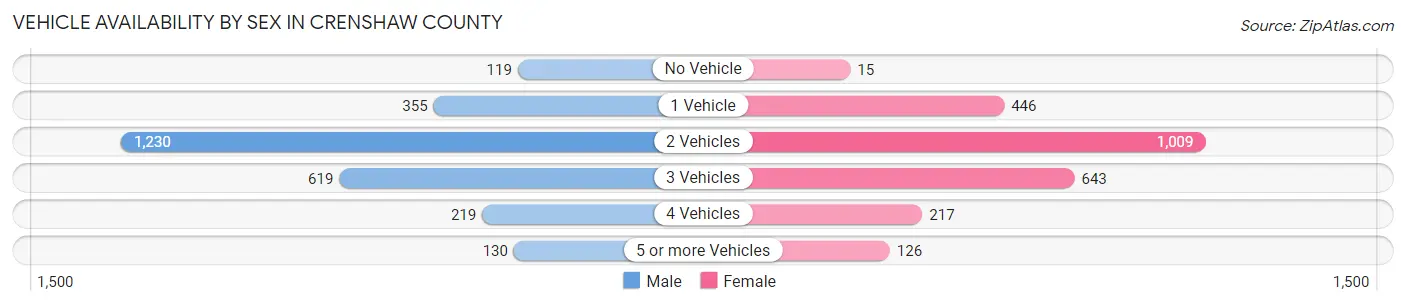
| Vehicles Available | Male | Female |
| No Vehicle | 119 (4.4%) | 15 (0.6%) |
| 1 Vehicle | 355 (13.3%) | 446 (18.2%) |
| 2 Vehicles | 1,230 (46.0%) | 1,009 (41.1%) |
| 3 Vehicles | 619 (23.2%) | 643 (26.2%) |
| 4 Vehicles | 219 (8.2%) | 217 (8.8%) |
| 5 or more Vehicles | 130 (4.9%) | 126 (5.1%) |
| Total | 2,672 (100.0%) | 2,456 (100.0%) |
Commute Time in Crenshaw County
The most frequently occuring commute durations in Crenshaw County are 15 to 19 minutes (913 commuters, 18.8%), 45 to 59 minutes (678 commuters, 14.0%), and 10 to 14 minutes (583 commuters, 12.0%).
| Commute Time | # Commuters | % Commuters |
| Less than 5 Minutes | 205 | 4.2% |
| 5 to 9 Minutes | 424 | 8.7% |
| 10 to 14 Minutes | 583 | 12.0% |
| 15 to 19 Minutes | 913 | 18.8% |
| 20 to 24 Minutes | 420 | 8.7% |
| 25 to 29 Minutes | 98 | 2.0% |
| 30 to 34 Minutes | 534 | 11.0% |
| 35 to 39 Minutes | 229 | 4.7% |
| 40 to 44 Minutes | 202 | 4.2% |
| 45 to 59 Minutes | 678 | 14.0% |
| 60 to 89 Minutes | 310 | 6.4% |
| 90 or more Minutes | 250 | 5.2% |
Commute Time by Sex in Crenshaw County
The most common commute times in Crenshaw County are 15 to 19 minutes (492 commuters, 19.1%) for males and 15 to 19 minutes (421 commuters, 18.5%) for females.
| Commute Time | Male | Female |
| Less than 5 Minutes | 144 (5.6%) | 61 (2.7%) |
| 5 to 9 Minutes | 295 (11.5%) | 129 (5.7%) |
| 10 to 14 Minutes | 228 (8.9%) | 355 (15.6%) |
| 15 to 19 Minutes | 492 (19.1%) | 421 (18.5%) |
| 20 to 24 Minutes | 263 (10.2%) | 157 (6.9%) |
| 25 to 29 Minutes | 42 (1.6%) | 56 (2.5%) |
| 30 to 34 Minutes | 207 (8.1%) | 327 (14.4%) |
| 35 to 39 Minutes | 80 (3.1%) | 149 (6.6%) |
| 40 to 44 Minutes | 146 (5.7%) | 56 (2.5%) |
| 45 to 59 Minutes | 392 (15.2%) | 286 (12.6%) |
| 60 to 89 Minutes | 160 (6.2%) | 150 (6.6%) |
| 90 or more Minutes | 123 (4.8%) | 127 (5.6%) |
Time of Departure to Work by Sex in Crenshaw County
The most frequent times of departure to work in Crenshaw County are 7:00 AM to 7:29 AM (452, 17.6%) for males and 7:00 AM to 7:29 AM (517, 22.7%) for females.
| Time of Departure | Male | Female |
| 12:00 AM to 4:59 AM | 296 (11.5%) | 106 (4.7%) |
| 5:00 AM to 5:29 AM | 103 (4.0%) | 76 (3.3%) |
| 5:30 AM to 5:59 AM | 245 (9.5%) | 232 (10.2%) |
| 6:00 AM to 6:29 AM | 292 (11.4%) | 146 (6.4%) |
| 6:30 AM to 6:59 AM | 347 (13.5%) | 390 (17.2%) |
| 7:00 AM to 7:29 AM | 452 (17.6%) | 517 (22.7%) |
| 7:30 AM to 7:59 AM | 204 (7.9%) | 282 (12.4%) |
| 8:00 AM to 8:29 AM | 150 (5.8%) | 194 (8.5%) |
| 8:30 AM to 8:59 AM | 33 (1.3%) | 41 (1.8%) |
| 9:00 AM to 9:59 AM | 39 (1.5%) | 29 (1.3%) |
| 10:00 AM to 10:59 AM | 15 (0.6%) | 7 (0.3%) |
| 11:00 AM to 11:59 AM | 24 (0.9%) | 45 (2.0%) |
| 12:00 PM to 3:59 PM | 100 (3.9%) | 89 (3.9%) |
| 4:00 PM to 11:59 PM | 272 (10.6%) | 120 (5.3%) |
| Total | 2,572 (100.0%) | 2,274 (100.0%) |
Housing Occupancy in Crenshaw County
Occupancy by Ownership in Crenshaw County
Of the total 4,839 dwellings in Crenshaw County, owner-occupied units account for 3,609 (74.6%), while renter-occupied units make up 1,230 (25.4%).
| Occupancy | # Housing Units | % Housing Units |
| Owner Occupied Housing Units | 3,609 | 74.6% |
| Renter-Occupied Housing Units | 1,230 | 25.4% |
| Total Occupied Housing Units | 4,839 | 100.0% |
Occupancy by Household Size in Crenshaw County
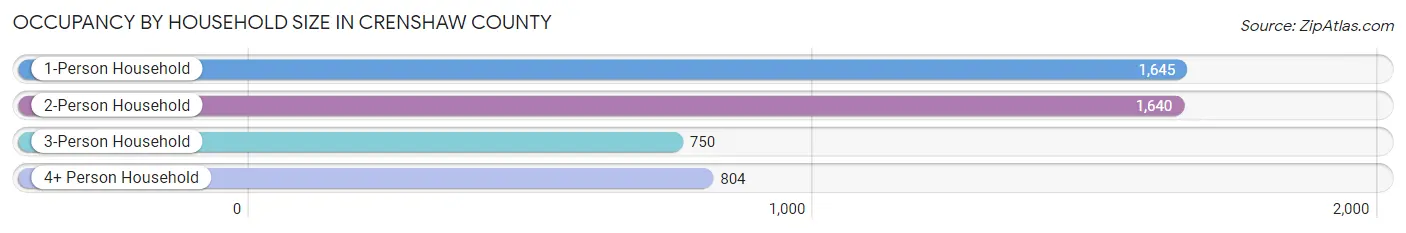
| Household Size | # Housing Units | % Housing Units |
| 1-Person Household | 1,645 | 34.0% |
| 2-Person Household | 1,640 | 33.9% |
| 3-Person Household | 750 | 15.5% |
| 4+ Person Household | 804 | 16.6% |
| Total Housing Units | 4,839 | 100.0% |
Occupancy by Ownership by Household Size in Crenshaw County
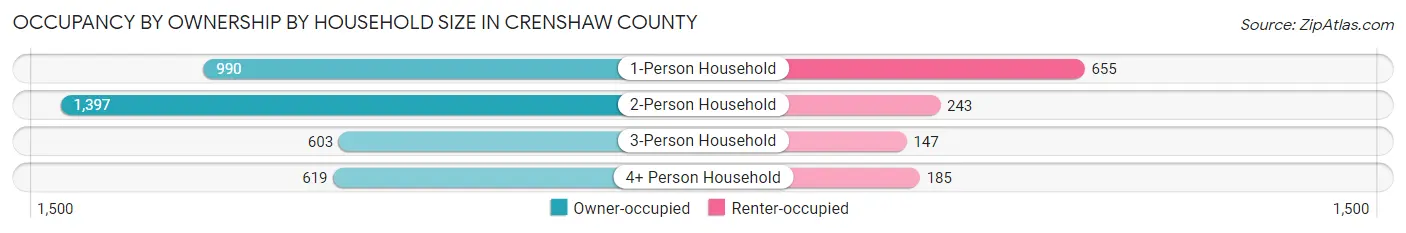
| Household Size | Owner-occupied | Renter-occupied |
| 1-Person Household | 990 (60.2%) | 655 (39.8%) |
| 2-Person Household | 1,397 (85.2%) | 243 (14.8%) |
| 3-Person Household | 603 (80.4%) | 147 (19.6%) |
| 4+ Person Household | 619 (77.0%) | 185 (23.0%) |
| Total Housing Units | 3,609 (74.6%) | 1,230 (25.4%) |
Occupancy by Educational Attainment in Crenshaw County
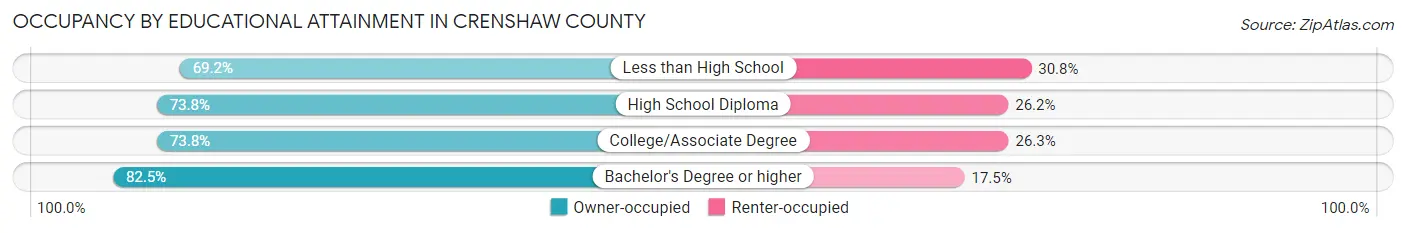
| Household Size | Owner-occupied | Renter-occupied |
| Less than High School | 619 (69.2%) | 275 (30.8%) |
| High School Diploma | 1,456 (73.8%) | 517 (26.2%) |
| College/Associate Degree | 781 (73.8%) | 278 (26.3%) |
| Bachelor's Degree or higher | 753 (82.5%) | 160 (17.5%) |
Occupancy by Age of Householder in Crenshaw County
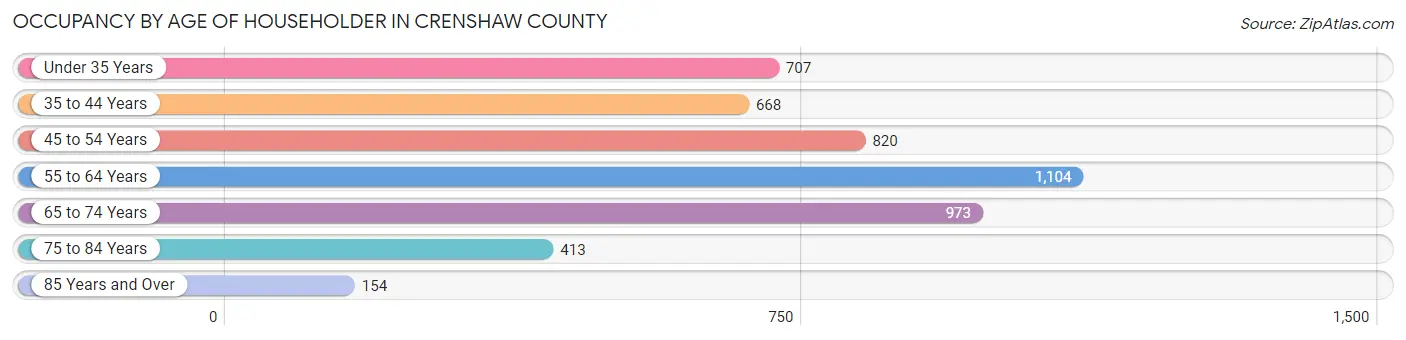
| Age Bracket | # Households | % Households |
| Under 35 Years | 707 | 14.6% |
| 35 to 44 Years | 668 | 13.8% |
| 45 to 54 Years | 820 | 17.0% |
| 55 to 64 Years | 1,104 | 22.8% |
| 65 to 74 Years | 973 | 20.1% |
| 75 to 84 Years | 413 | 8.5% |
| 85 Years and Over | 154 | 3.2% |
| Total | 4,839 | 100.0% |
Housing Finances in Crenshaw County
Median Income by Occupancy in Crenshaw County
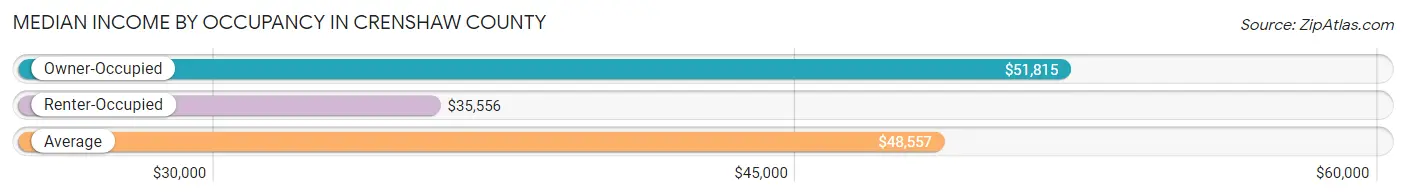
| Occupancy Type | # Households | Median Income |
| Owner-Occupied | 3,609 (74.6%) | $51,815 |
| Renter-Occupied | 1,230 (25.4%) | $35,556 |
| Average | 4,839 (100.0%) | $48,557 |
Occupancy by Householder Income Bracket in Crenshaw County
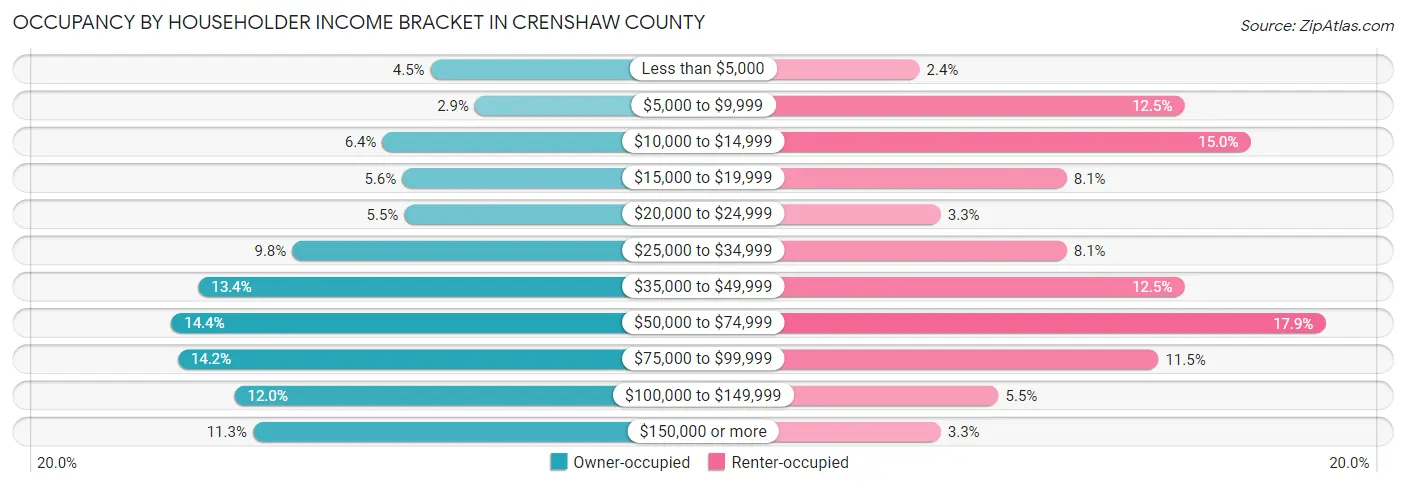
| Income Bracket | Owner-occupied | Renter-occupied |
| Less than $5,000 | 164 (4.5%) | 30 (2.4%) |
| $5,000 to $9,999 | 103 (2.9%) | 154 (12.5%) |
| $10,000 to $14,999 | 230 (6.4%) | 185 (15.0%) |
| $15,000 to $19,999 | 203 (5.6%) | 99 (8.1%) |
| $20,000 to $24,999 | 200 (5.5%) | 40 (3.3%) |
| $25,000 to $34,999 | 354 (9.8%) | 99 (8.1%) |
| $35,000 to $49,999 | 483 (13.4%) | 154 (12.5%) |
| $50,000 to $74,999 | 520 (14.4%) | 220 (17.9%) |
| $75,000 to $99,999 | 511 (14.2%) | 142 (11.5%) |
| $100,000 to $149,999 | 433 (12.0%) | 67 (5.4%) |
| $150,000 or more | 408 (11.3%) | 40 (3.3%) |
| Total | 3,609 (100.0%) | 1,230 (100.0%) |
Monthly Housing Cost Tiers in Crenshaw County
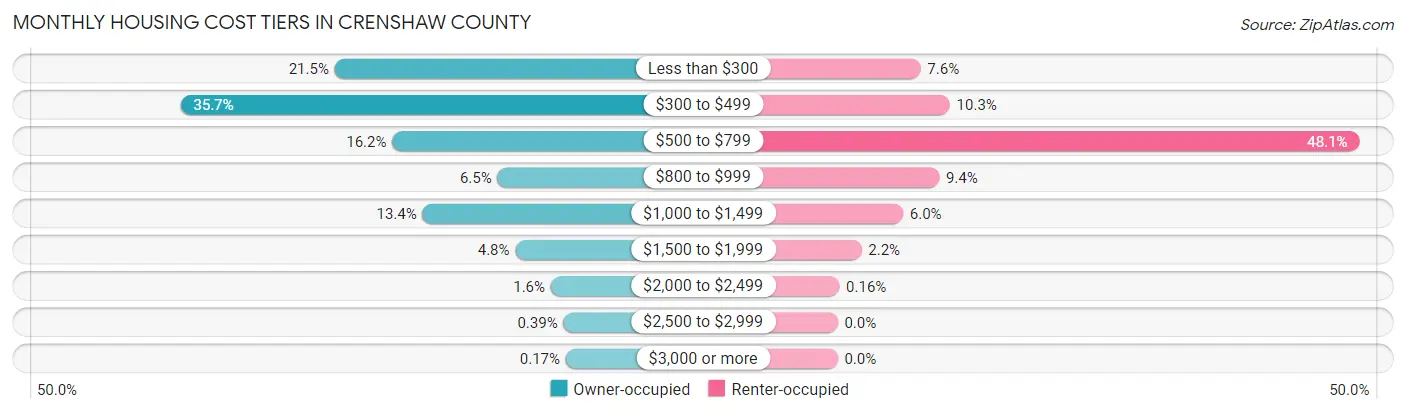
| Monthly Cost | Owner-occupied | Renter-occupied |
| Less than $300 | 774 (21.4%) | 94 (7.6%) |
| $300 to $499 | 1,287 (35.7%) | 127 (10.3%) |
| $500 to $799 | 583 (16.2%) | 591 (48.0%) |
| $800 to $999 | 233 (6.5%) | 115 (9.3%) |
| $1,000 to $1,499 | 482 (13.4%) | 74 (6.0%) |
| $1,500 to $1,999 | 174 (4.8%) | 27 (2.2%) |
| $2,000 to $2,499 | 56 (1.5%) | 2 (0.2%) |
| $2,500 to $2,999 | 14 (0.4%) | 0 (0.0%) |
| $3,000 or more | 6 (0.2%) | 0 (0.0%) |
| Total | 3,609 (100.0%) | 1,230 (100.0%) |
Physical Housing Characteristics in Crenshaw County
Housing Structures in Crenshaw County
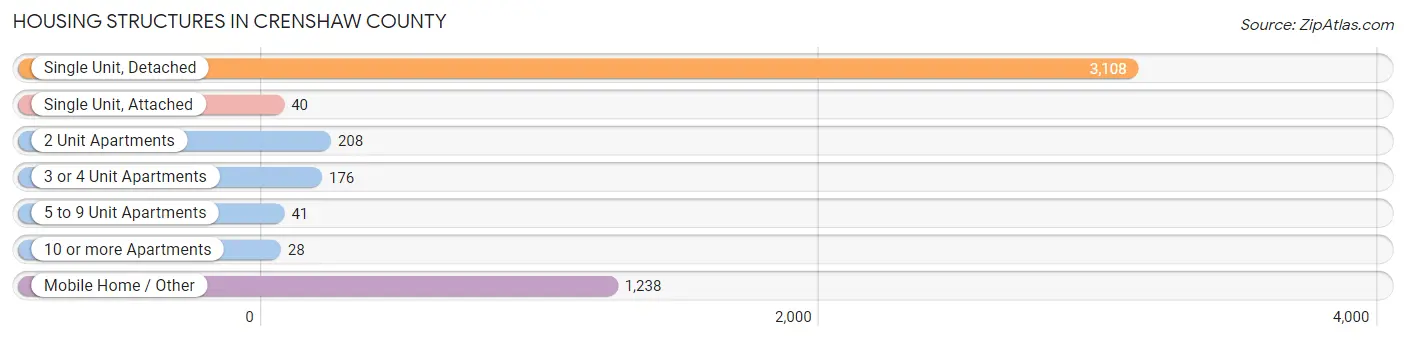
| Structure Type | # Housing Units | % Housing Units |
| Single Unit, Detached | 3,108 | 64.2% |
| Single Unit, Attached | 40 | 0.8% |
| 2 Unit Apartments | 208 | 4.3% |
| 3 or 4 Unit Apartments | 176 | 3.6% |
| 5 to 9 Unit Apartments | 41 | 0.9% |
| 10 or more Apartments | 28 | 0.6% |
| Mobile Home / Other | 1,238 | 25.6% |
| Total | 4,839 | 100.0% |
Housing Structures by Occupancy in Crenshaw County
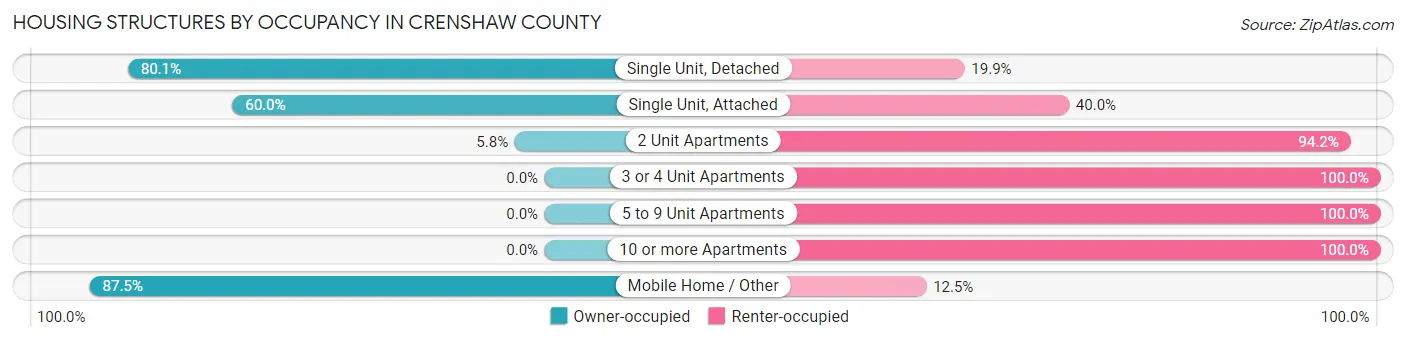
| Structure Type | Owner-occupied | Renter-occupied |
| Single Unit, Detached | 2,490 (80.1%) | 618 (19.9%) |
| Single Unit, Attached | 24 (60.0%) | 16 (40.0%) |
| 2 Unit Apartments | 12 (5.8%) | 196 (94.2%) |
| 3 or 4 Unit Apartments | 0 (0.0%) | 176 (100.0%) |
| 5 to 9 Unit Apartments | 0 (0.0%) | 41 (100.0%) |
| 10 or more Apartments | 0 (0.0%) | 28 (100.0%) |
| Mobile Home / Other | 1,083 (87.5%) | 155 (12.5%) |
| Total | 3,609 (74.6%) | 1,230 (25.4%) |
Housing Structures by Number of Rooms in Crenshaw County
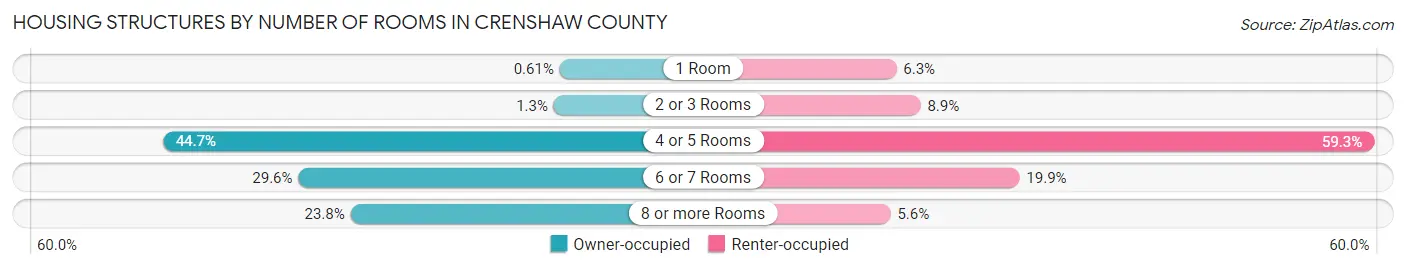
| Number of Rooms | Owner-occupied | Renter-occupied |
| 1 Room | 22 (0.6%) | 77 (6.3%) |
| 2 or 3 Rooms | 46 (1.3%) | 110 (8.9%) |
| 4 or 5 Rooms | 1,612 (44.7%) | 729 (59.3%) |
| 6 or 7 Rooms | 1,069 (29.6%) | 245 (19.9%) |
| 8 or more Rooms | 860 (23.8%) | 69 (5.6%) |
| Total | 3,609 (100.0%) | 1,230 (100.0%) |
Housing Structure by Heating Type in Crenshaw County
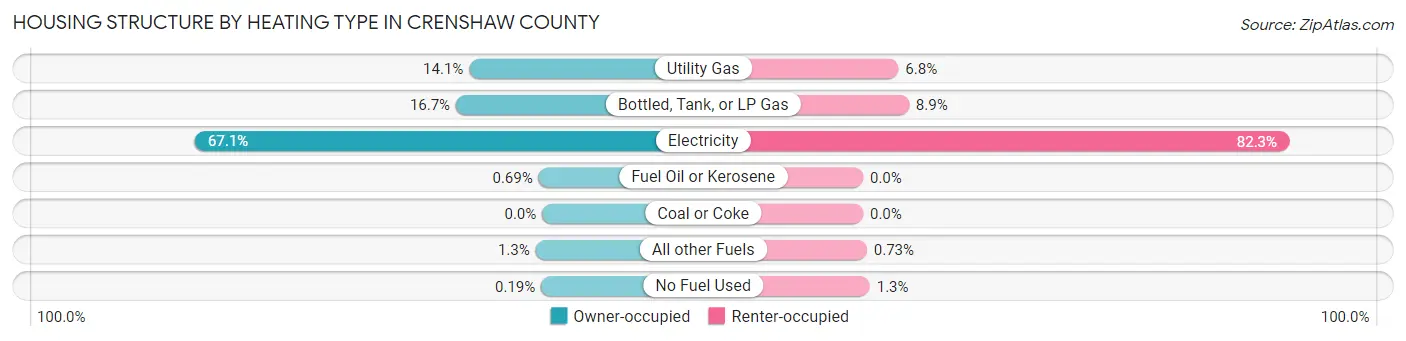
| Heating Type | Owner-occupied | Renter-occupied |
| Utility Gas | 509 (14.1%) | 84 (6.8%) |
| Bottled, Tank, or LP Gas | 601 (16.7%) | 109 (8.9%) |
| Electricity | 2,421 (67.1%) | 1,012 (82.3%) |
| Fuel Oil or Kerosene | 25 (0.7%) | 0 (0.0%) |
| Coal or Coke | 0 (0.0%) | 0 (0.0%) |
| All other Fuels | 46 (1.3%) | 9 (0.7%) |
| No Fuel Used | 7 (0.2%) | 16 (1.3%) |
| Total | 3,609 (100.0%) | 1,230 (100.0%) |
Household Vehicle Usage in Crenshaw County
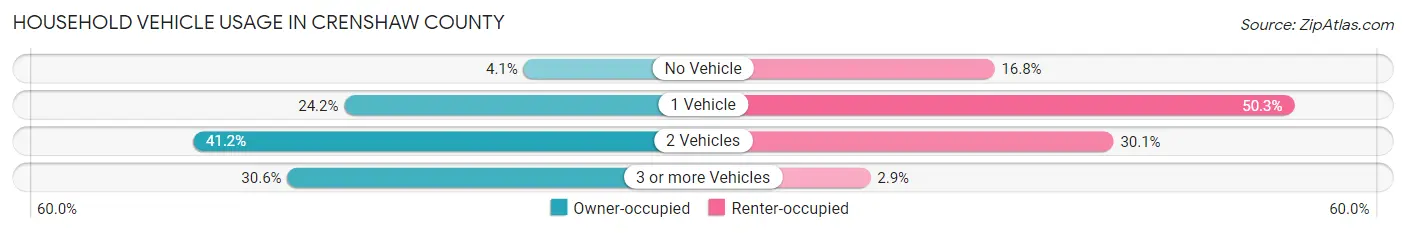
| Vehicles per Household | Owner-occupied | Renter-occupied |
| No Vehicle | 148 (4.1%) | 206 (16.8%) |
| 1 Vehicle | 873 (24.2%) | 619 (50.3%) |
| 2 Vehicles | 1,485 (41.1%) | 370 (30.1%) |
| 3 or more Vehicles | 1,103 (30.6%) | 35 (2.9%) |
| Total | 3,609 (100.0%) | 1,230 (100.0%) |
Real Estate & Mortgages in Crenshaw County
Real Estate and Mortgage Overview in Crenshaw County
| Characteristic | Without Mortgage | With Mortgage |
| Housing Units | 2,512 | 1,097 |
| Median Property Value | $82,700 | $138,200 |
| Median Household Income | $44,125 | $112 |
| Monthly Housing Costs | $366 | $6 |
| Real Estate Taxes | $268 | $114 |
Property Value by Mortgage Status in Crenshaw County
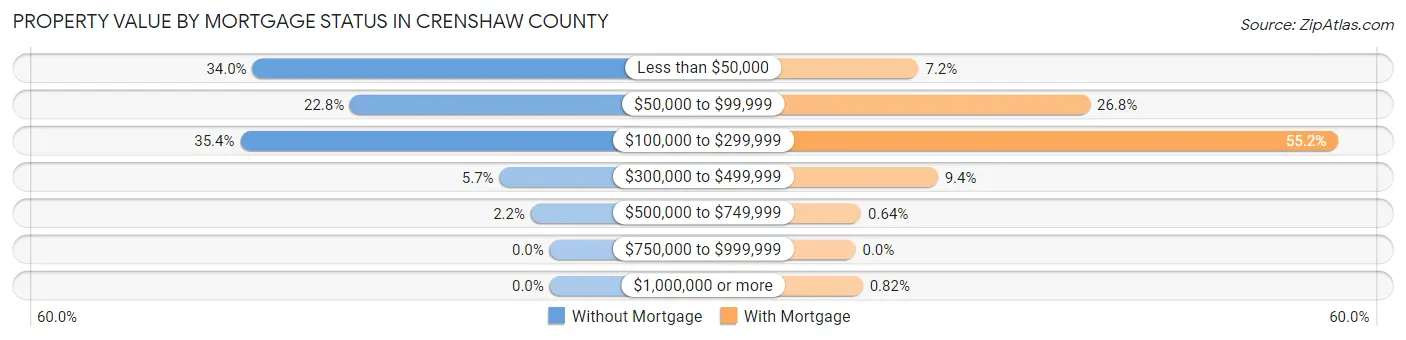
| Property Value | Without Mortgage | With Mortgage |
| Less than $50,000 | 853 (34.0%) | 79 (7.2%) |
| $50,000 to $99,999 | 573 (22.8%) | 294 (26.8%) |
| $100,000 to $299,999 | 888 (35.3%) | 605 (55.1%) |
| $300,000 to $499,999 | 144 (5.7%) | 103 (9.4%) |
| $500,000 to $749,999 | 54 (2.1%) | 7 (0.6%) |
| $750,000 to $999,999 | 0 (0.0%) | 0 (0.0%) |
| $1,000,000 or more | 0 (0.0%) | 9 (0.8%) |
| Total | 2,512 (100.0%) | 1,097 (100.0%) |
Household Income by Mortgage Status in Crenshaw County
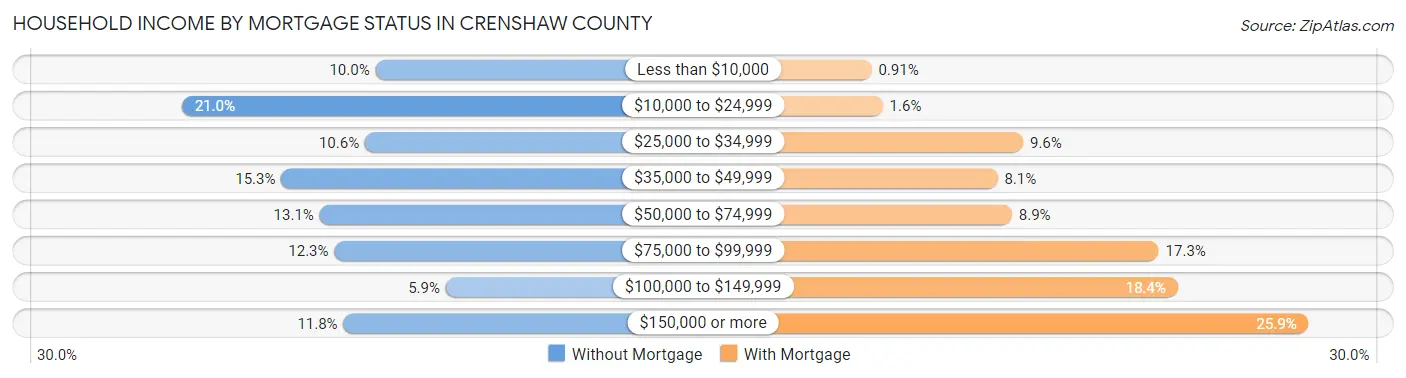
| Household Income | Without Mortgage | With Mortgage |
| Less than $10,000 | 250 (10.0%) | 10 (0.9%) |
| $10,000 to $24,999 | 528 (21.0%) | 17 (1.5%) |
| $25,000 to $34,999 | 265 (10.5%) | 105 (9.6%) |
| $35,000 to $49,999 | 385 (15.3%) | 89 (8.1%) |
| $50,000 to $74,999 | 330 (13.1%) | 98 (8.9%) |
| $75,000 to $99,999 | 309 (12.3%) | 190 (17.3%) |
| $100,000 to $149,999 | 149 (5.9%) | 202 (18.4%) |
| $150,000 or more | 296 (11.8%) | 284 (25.9%) |
| Total | 2,512 (100.0%) | 1,097 (100.0%) |
Property Value to Household Income Ratio in Crenshaw County
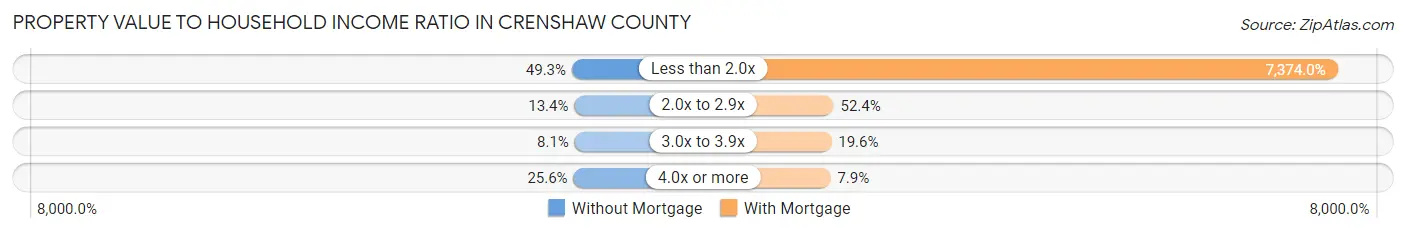
| Value-to-Income Ratio | Without Mortgage | With Mortgage |
| Less than 2.0x | 1,239 (49.3%) | 80,893 (7,374.0%) |
| 2.0x to 2.9x | 337 (13.4%) | 575 (52.4%) |
| 3.0x to 3.9x | 204 (8.1%) | 215 (19.6%) |
| 4.0x or more | 643 (25.6%) | 87 (7.9%) |
| Total | 2,512 (100.0%) | 1,097 (100.0%) |
Real Estate Taxes by Mortgage Status in Crenshaw County
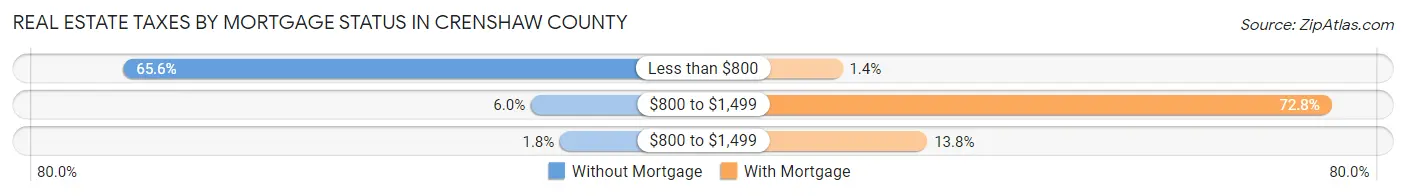
| Property Taxes | Without Mortgage | With Mortgage |
| Less than $800 | 1,647 (65.6%) | 15 (1.4%) |
| $800 to $1,499 | 151 (6.0%) | 799 (72.8%) |
| $800 to $1,499 | 44 (1.8%) | 151 (13.8%) |
| Total | 2,512 (100.0%) | 1,097 (100.0%) |
Health & Disability in Crenshaw County
Health Insurance Coverage by Age in Crenshaw County
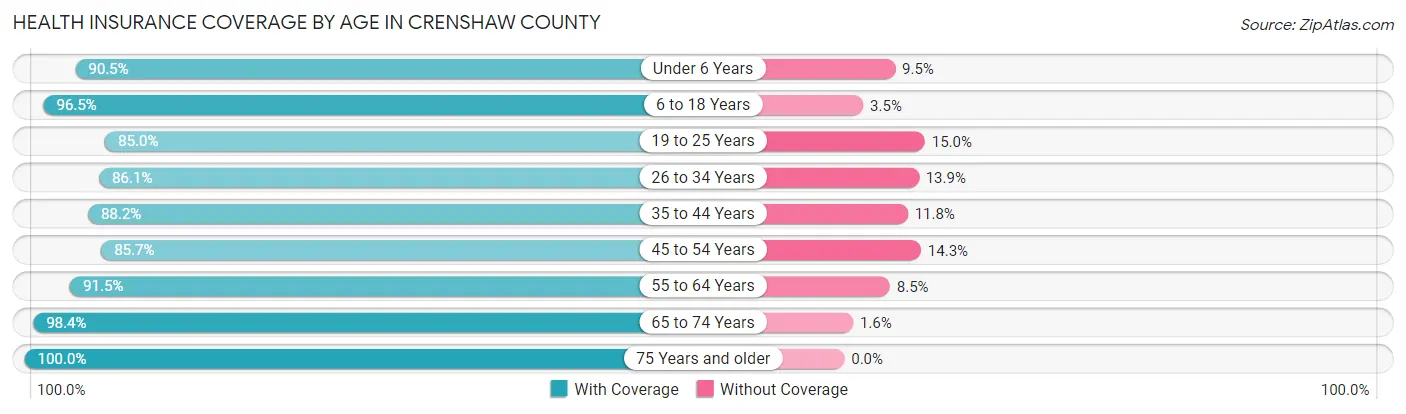
| Age Bracket | With Coverage | Without Coverage |
| Under 6 Years | 841 (90.5%) | 88 (9.5%) |
| 6 to 18 Years | 2,140 (96.5%) | 78 (3.5%) |
| 19 to 25 Years | 815 (85.0%) | 144 (15.0%) |
| 26 to 34 Years | 1,284 (86.1%) | 207 (13.9%) |
| 35 to 44 Years | 1,268 (88.2%) | 170 (11.8%) |
| 45 to 54 Years | 1,404 (85.7%) | 234 (14.3%) |
| 55 to 64 Years | 1,668 (91.5%) | 155 (8.5%) |
| 65 to 74 Years | 1,525 (98.4%) | 25 (1.6%) |
| 75 Years and older | 883 (100.0%) | 0 (0.0%) |
| Total | 11,828 (91.5%) | 1,101 (8.5%) |
Health Insurance Coverage by Citizenship Status in Crenshaw County
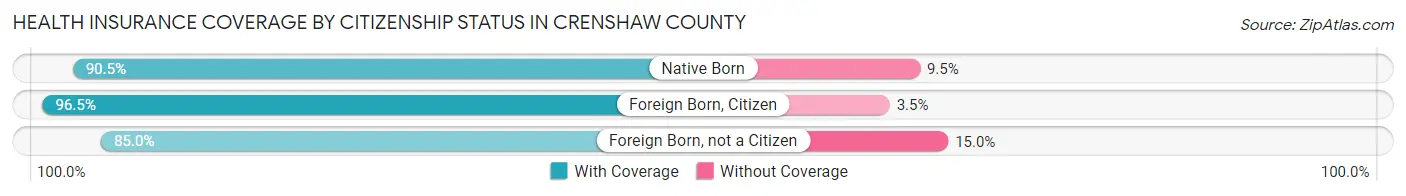
| Citizenship Status | With Coverage | Without Coverage |
| Native Born | 841 (90.5%) | 88 (9.5%) |
| Foreign Born, Citizen | 2,140 (96.5%) | 78 (3.5%) |
| Foreign Born, not a Citizen | 815 (85.0%) | 144 (15.0%) |
Health Insurance Coverage by Household Income in Crenshaw County
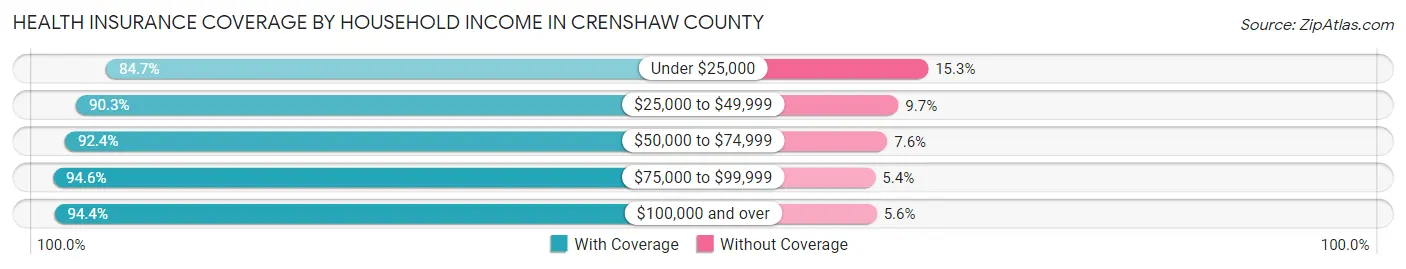
| Household Income | With Coverage | Without Coverage |
| Under $25,000 | 1,938 (84.7%) | 349 (15.3%) |
| $25,000 to $49,999 | 2,607 (90.3%) | 279 (9.7%) |
| $50,000 to $74,999 | 2,008 (92.4%) | 165 (7.6%) |
| $75,000 to $99,999 | 1,995 (94.6%) | 113 (5.4%) |
| $100,000 and over | 3,280 (94.4%) | 195 (5.6%) |
Public vs Private Health Insurance Coverage by Age in Crenshaw County
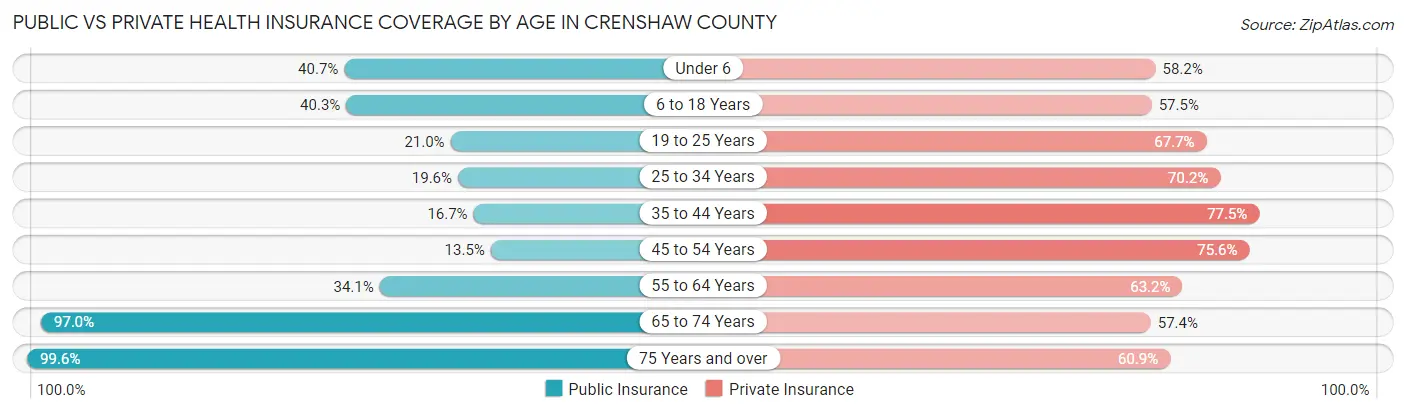
| Age Bracket | Public Insurance | Private Insurance |
| Under 6 | 378 (40.7%) | 541 (58.2%) |
| 6 to 18 Years | 894 (40.3%) | 1,276 (57.5%) |
| 19 to 25 Years | 201 (21.0%) | 649 (67.7%) |
| 25 to 34 Years | 292 (19.6%) | 1,047 (70.2%) |
| 35 to 44 Years | 240 (16.7%) | 1,114 (77.5%) |
| 45 to 54 Years | 221 (13.5%) | 1,239 (75.6%) |
| 55 to 64 Years | 622 (34.1%) | 1,152 (63.2%) |
| 65 to 74 Years | 1,503 (97.0%) | 889 (57.4%) |
| 75 Years and over | 879 (99.6%) | 538 (60.9%) |
| Total | 5,230 (40.5%) | 8,445 (65.3%) |
Disability Status by Sex by Age in Crenshaw County
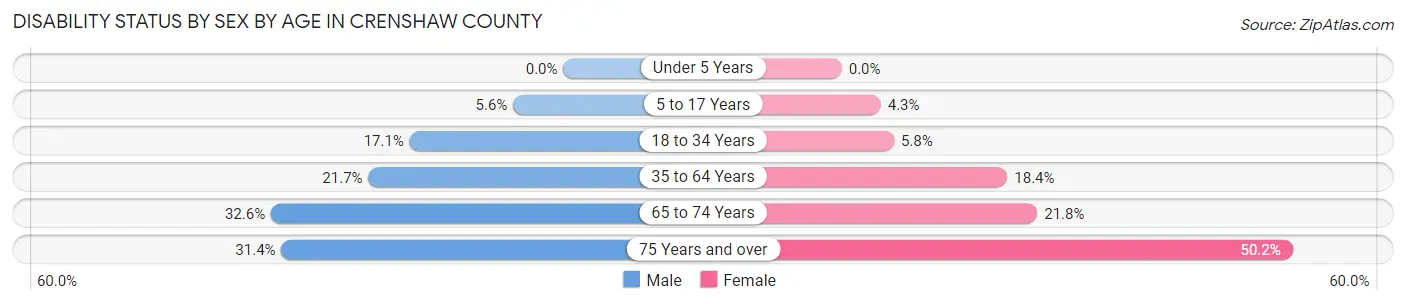
| Age Bracket | Male | Female |
| Under 5 Years | 0 (0.0%) | 0 (0.0%) |
| 5 to 17 Years | 70 (5.6%) | 46 (4.3%) |
| 18 to 34 Years | 232 (17.1%) | 71 (5.8%) |
| 35 to 64 Years | 515 (21.7%) | 466 (18.4%) |
| 65 to 74 Years | 225 (32.6%) | 187 (21.8%) |
| 75 Years and over | 119 (31.4%) | 253 (50.2%) |
Disability Class by Sex by Age in Crenshaw County
Disability Class: Hearing Difficulty
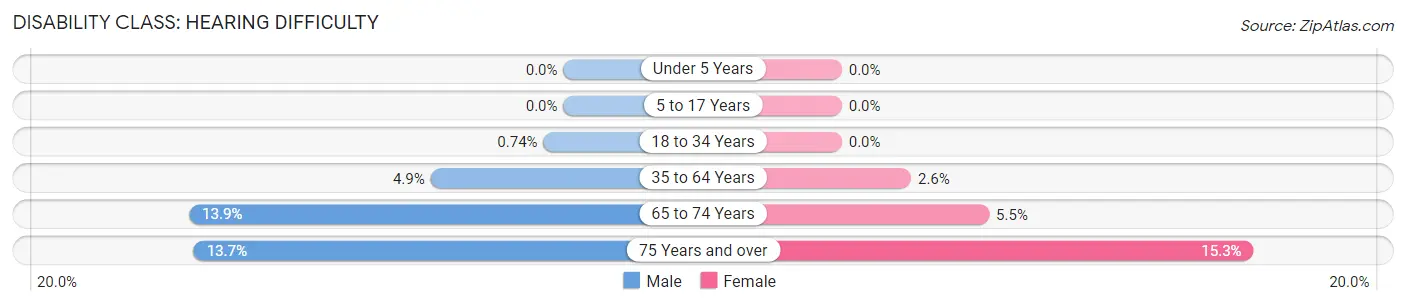
| Age Bracket | Male | Female |
| Under 5 Years | 0 (0.0%) | 0 (0.0%) |
| 5 to 17 Years | 0 (0.0%) | 0 (0.0%) |
| 18 to 34 Years | 10 (0.7%) | 0 (0.0%) |
| 35 to 64 Years | 117 (4.9%) | 65 (2.6%) |
| 65 to 74 Years | 96 (13.9%) | 47 (5.5%) |
| 75 Years and over | 52 (13.7%) | 77 (15.3%) |
Disability Class: Vision Difficulty
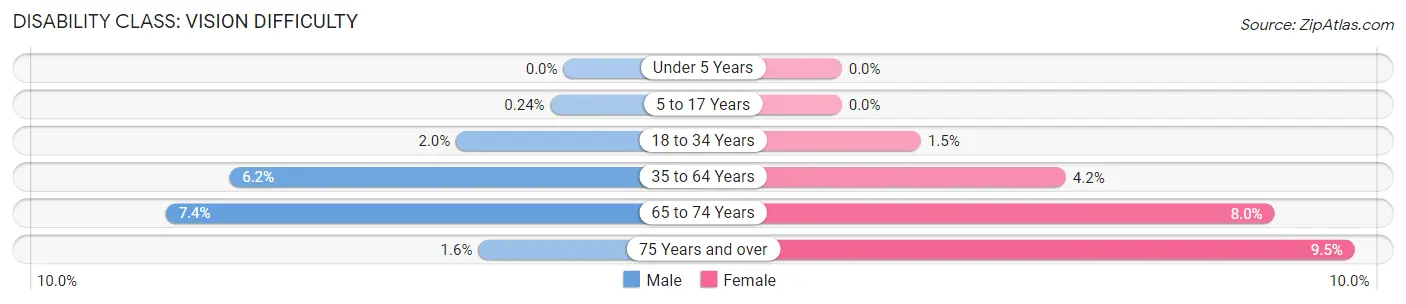
| Age Bracket | Male | Female |
| Under 5 Years | 0 (0.0%) | 0 (0.0%) |
| 5 to 17 Years | 3 (0.2%) | 0 (0.0%) |
| 18 to 34 Years | 27 (2.0%) | 18 (1.5%) |
| 35 to 64 Years | 147 (6.2%) | 105 (4.2%) |
| 65 to 74 Years | 51 (7.4%) | 69 (8.0%) |
| 75 Years and over | 6 (1.6%) | 48 (9.5%) |
Disability Class: Cognitive Difficulty
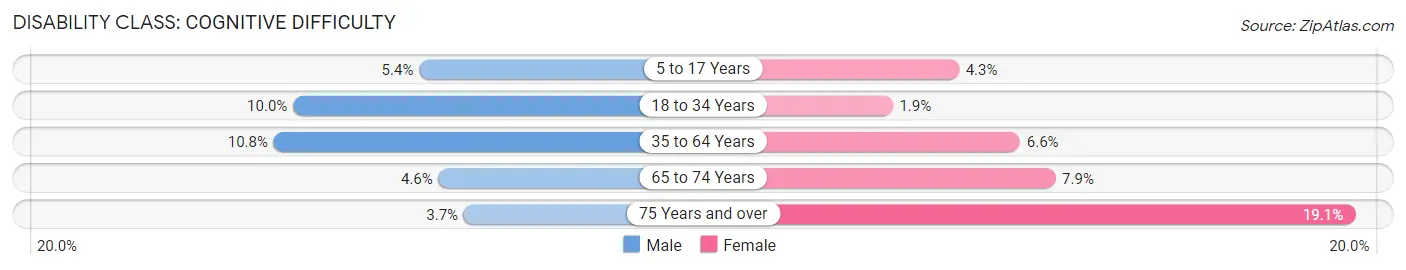
| Age Bracket | Male | Female |
| 5 to 17 Years | 67 (5.3%) | 46 (4.3%) |
| 18 to 34 Years | 136 (10.0%) | 23 (1.9%) |
| 35 to 64 Years | 255 (10.7%) | 167 (6.6%) |
| 65 to 74 Years | 32 (4.6%) | 68 (7.9%) |
| 75 Years and over | 14 (3.7%) | 96 (19.1%) |
Disability Class: Ambulatory Difficulty
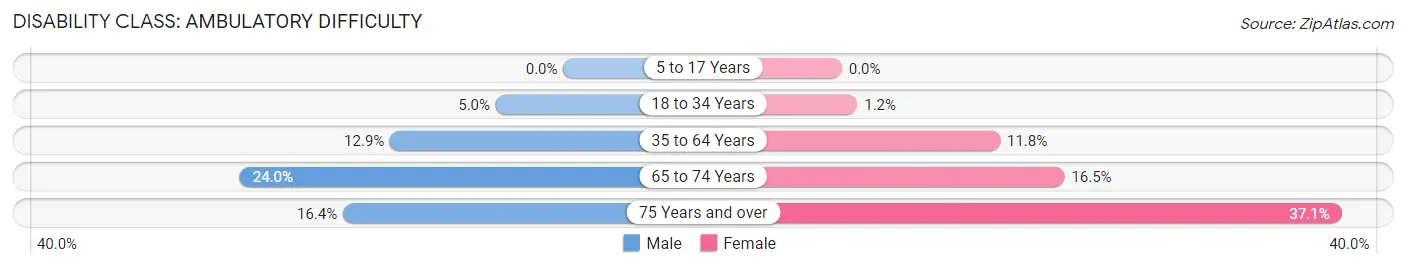
| Age Bracket | Male | Female |
| 5 to 17 Years | 0 (0.0%) | 0 (0.0%) |
| 18 to 34 Years | 68 (5.0%) | 14 (1.1%) |
| 35 to 64 Years | 305 (12.9%) | 297 (11.7%) |
| 65 to 74 Years | 166 (24.0%) | 142 (16.5%) |
| 75 Years and over | 62 (16.4%) | 187 (37.1%) |
Disability Class: Self-Care Difficulty
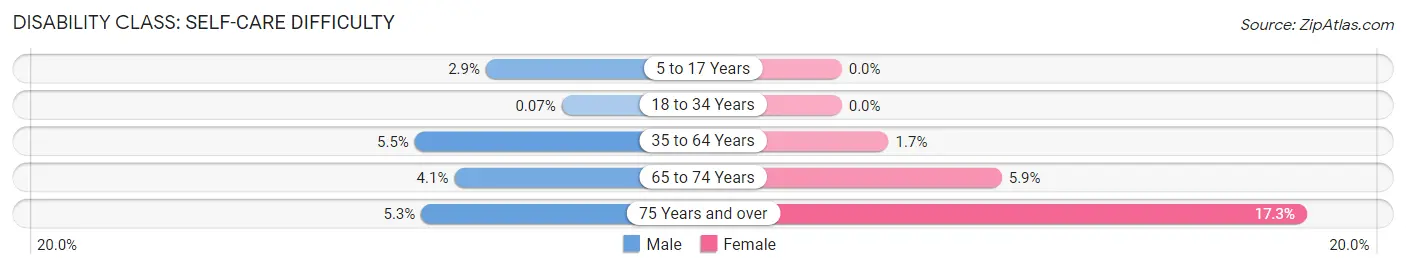
| Age Bracket | Male | Female |
| 5 to 17 Years | 36 (2.9%) | 0 (0.0%) |
| 18 to 34 Years | 1 (0.1%) | 0 (0.0%) |
| 35 to 64 Years | 131 (5.5%) | 44 (1.7%) |
| 65 to 74 Years | 28 (4.1%) | 51 (5.9%) |
| 75 Years and over | 20 (5.3%) | 87 (17.3%) |
Technology Access in Crenshaw County
Computing Device Access in Crenshaw County
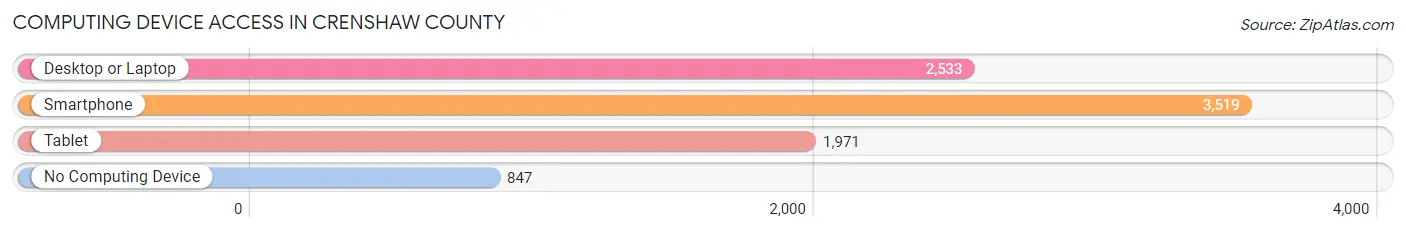
| Device Type | # Households | % Households |
| Desktop or Laptop | 2,533 | 52.3% |
| Smartphone | 3,519 | 72.7% |
| Tablet | 1,971 | 40.7% |
| No Computing Device | 847 | 17.5% |
| Total | 4,839 | 100.0% |
Internet Access in Crenshaw County
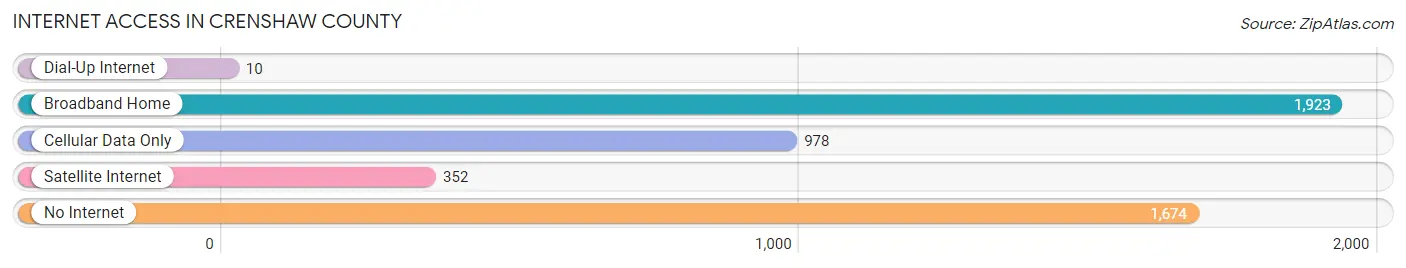
| Internet Type | # Households | % Households |
| Dial-Up Internet | 10 | 0.2% |
| Broadband Home | 1,923 | 39.7% |
| Cellular Data Only | 978 | 20.2% |
| Satellite Internet | 352 | 7.3% |
| No Internet | 1,674 | 34.6% |
| Total | 4,839 | 100.0% |
Crenshaw County Summary
Crenshaw County is located in the southeastern corner of Alabama, and is part of the Montgomery Metropolitan Statistical Area. The county was created in 1866 from parts of Butler, Covington, and Pike counties. The county seat is Luverne, and the county is named for William Crenshaw, a prominent local politician.
Geography
Crenshaw County covers an area of 590 square miles, and is located in the southeastern corner of Alabama. The county is bordered by Butler County to the north, Covington County to the east, Pike County to the south, and Montgomery County to the west. The county is mostly flat, with some rolling hills in the northern part of the county. The county is drained by the Conecuh River, which flows through the county from north to south. The county is also home to several small lakes, including Lake Jackson, Lake Martin, and Lake Tallassee.
Demographics
As of the 2010 census, Crenshaw County had a population of 13,906. The racial makeup of the county was 68.3% White, 29.3% Black or African American, 0.3% Native American, 0.3% Asian, 0.2% from other races, and 1.8% from two or more races. Hispanic or Latino of any race were 1.2% of the population.
The median income for a household in the county was $30,945, and the median income for a family was $37,945. The per capita income for the county was $15,945. About 19.3% of families and 23.3% of the population were below the poverty line, including 33.3% of those under age 18 and 18.3% of those age 65 or over.
Economy
Crenshaw County is largely rural, and the economy is largely based on agriculture. The county is home to several large farms, and the main crops grown in the county are cotton, corn, soybeans, and peanuts. The county is also home to several timber companies, and the timber industry is an important part of the local economy.
In addition to agriculture, the county is home to several manufacturing companies, including a paper mill, a furniture factory, and a plastics plant. The county is also home to several retail stores, restaurants, and other businesses.
The county is served by the Crenshaw County Airport, which is located in Luverne. The airport is used primarily for general aviation, and is home to several small aircraft.
Conclusion
Crenshaw County is a rural county located in the southeastern corner of Alabama. The county is home to a population of 13,906, and the economy is largely based on agriculture. The county is also home to several manufacturing companies, and the timber industry is an important part of the local economy. The county is served by the Crenshaw County Airport, which is used primarily for general aviation.
Common Questions
What is Per Capita Income in Crenshaw County?
Per Capita income in Crenshaw County is $32,396.
What is the Median Family Income in Crenshaw County?
Median Family Income in Crenshaw County is $69,602.
What is the Median Household income in Crenshaw County?
Median Household Income in Crenshaw County is $48,557.
What is Income or Wage Gap in Crenshaw County?
Income or Wage Gap in Crenshaw County is 35.7%.
Women in Crenshaw County earn 64.3 cents for every dollar earned by a man.
What is Family Income Deficit in Crenshaw County?
Family Income Deficit in Crenshaw County is $12,042.
Families that are below poverty line in Crenshaw County earn $12,042 less on average than the poverty threshold level.
What is Inequality or Gini Index in Crenshaw County?
Inequality or Gini Index in Crenshaw County is 0.56.
What is the Total Population of Crenshaw County?
Total Population of Crenshaw County is 13,205.
What is the Total Male Population of Crenshaw County?
Total Male Population of Crenshaw County is 6,451.
What is the Total Female Population of Crenshaw County?
Total Female Population of Crenshaw County is 6,754.
What is the Ratio of Males per 100 Females in Crenshaw County?
There are 95.51 Males per 100 Females in Crenshaw County.
What is the Ratio of Females per 100 Males in Crenshaw County?
There are 104.70 Females per 100 Males in Crenshaw County.
What is the Median Population Age in Crenshaw County?
Median Population Age in Crenshaw County is 42.3 Years.
What is the Average Family Size in Crenshaw County
Average Family Size in Crenshaw County is 3.5 People.
What is the Average Household Size in Crenshaw County
Average Household Size in Crenshaw County is 2.7 People.
How Large is the Labor Force in Crenshaw County?
There are 5,489 People in the Labor Forcein in Crenshaw County.
What is the Percentage of People in the Labor Force in Crenshaw County?
52.0% of People are in the Labor Force in Crenshaw County.
What is the Unemployment Rate in Crenshaw County?
Unemployment Rate in Crenshaw County is 6.1%.