Coosa County, AL Map & Demographics
Coosa County Map
Coosa County Overview
$28,998
PER CAPITA INCOME
$64,482
AVG FAMILY INCOME
$52,279
AVG HOUSEHOLD INCOME
32.7%
WAGE / INCOME GAP [ % ]
67.3¢/ $1
WAGE / INCOME GAP [ $ ]
0.42
INEQUALITY / GINI INDEX
10,329
TOTAL POPULATION
5,306
MALE POPULATION
5,023
FEMALE POPULATION
105.63
MALES / 100 FEMALES
94.67
FEMALES / 100 MALES
50.2
MEDIAN AGE
3.1
AVG FAMILY SIZE
2.5
AVG HOUSEHOLD SIZE
4,095
LABOR FORCE [ PEOPLE ]
46.4%
PERCENT IN LABOR FORCE
4.4%
UNEMPLOYMENT RATE
Income in Coosa County
Income Overview in Coosa County
Per Capita Income in Coosa County is $28,998, while median incomes of families and households are $64,482 and $52,279 respectively.
| Characteristic | Number | Measure |
| Per Capita Income | 10,329 | $28,998 |
| Median Family Income | 2,761 | $64,482 |
| Mean Family Income | 2,761 | $81,045 |
| Median Household Income | 3,999 | $52,279 |
| Mean Household Income | 3,999 | $69,810 |
| Income Deficit | 2,761 | $0 |
| Wage / Income Gap (%) | 10,329 | 32.68% |
| Wage / Income Gap ($) | 10,329 | 67.32¢ per $1 |
| Gini / Inequality Index | 10,329 | 0.42 |
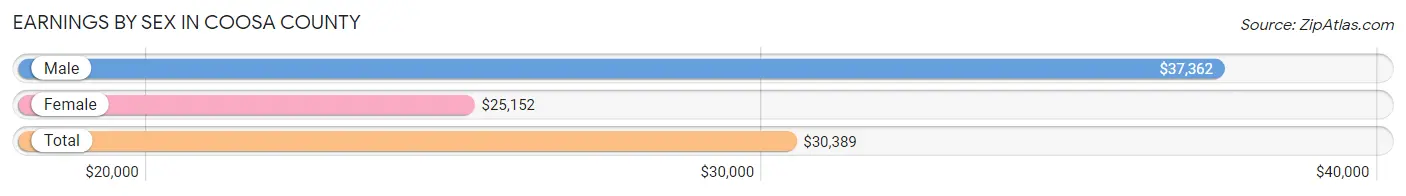
Earnings by Sex in Coosa County
Average Earnings in Coosa County are $30,389, $37,362 for men and $25,152 for women, a difference of 32.7%.
| Sex | Number | Average Earnings |
| Male | 2,560 (56.2%) | $37,362 |
| Female | 1,991 (43.8%) | $25,152 |
| Total | 4,551 (100.0%) | $30,389 |
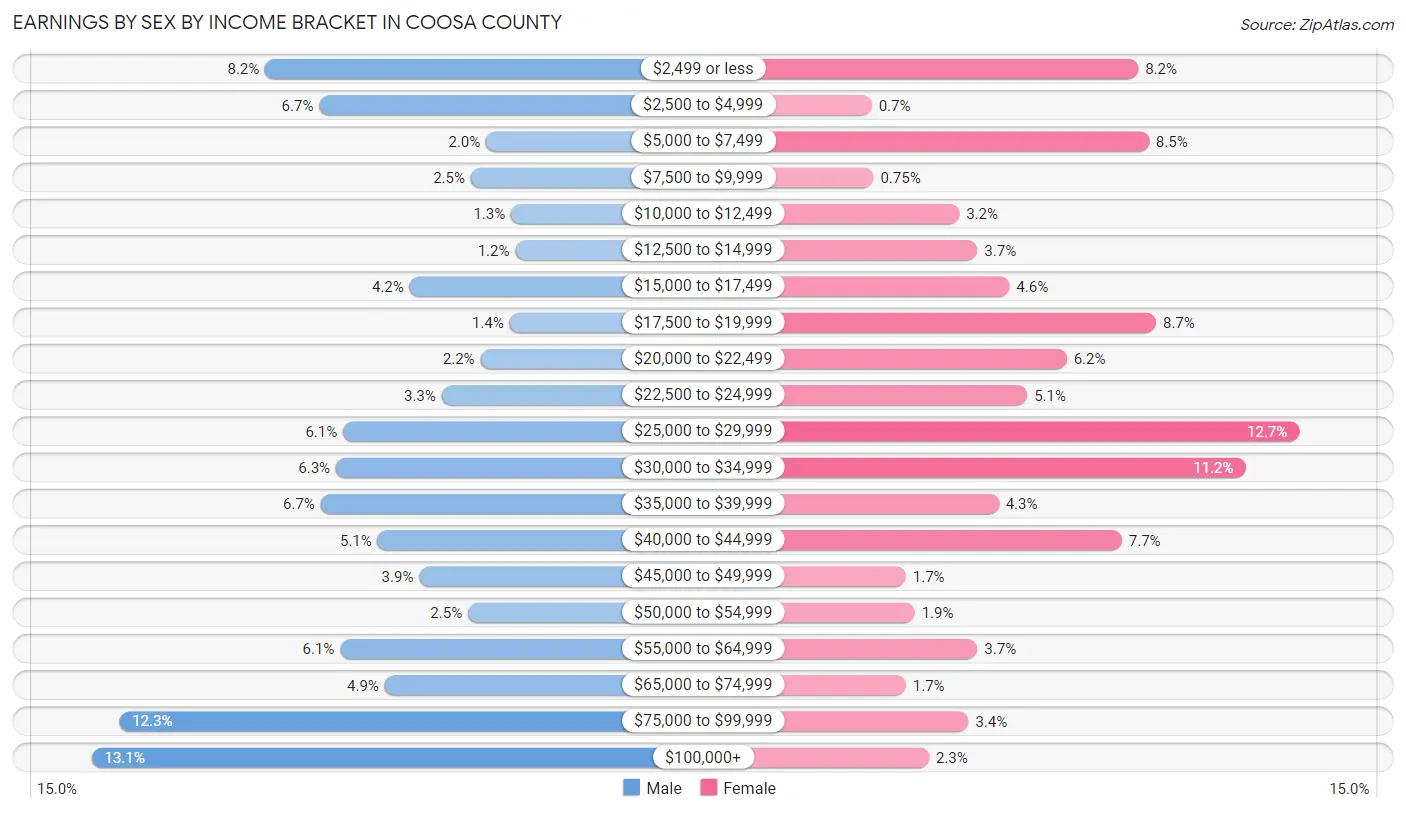
Earnings by Sex by Income Bracket in Coosa County
The most common earnings brackets in Coosa County are $100,000+ for men (336 | 13.1%) and $25,000 to $29,999 for women (253 | 12.7%).
| Income | Male | Female |
| $2,499 or less | 211 (8.2%) | 163 (8.2%) |
| $2,500 to $4,999 | 172 (6.7%) | 14 (0.7%) |
| $5,000 to $7,499 | 52 (2.0%) | 169 (8.5%) |
| $7,500 to $9,999 | 63 (2.5%) | 15 (0.7%) |
| $10,000 to $12,499 | 34 (1.3%) | 63 (3.2%) |
| $12,500 to $14,999 | 31 (1.2%) | 73 (3.7%) |
| $15,000 to $17,499 | 107 (4.2%) | 91 (4.6%) |
| $17,500 to $19,999 | 35 (1.4%) | 173 (8.7%) |
| $20,000 to $22,499 | 56 (2.2%) | 123 (6.2%) |
| $22,500 to $24,999 | 84 (3.3%) | 101 (5.1%) |
| $25,000 to $29,999 | 155 (6.0%) | 253 (12.7%) |
| $30,000 to $34,999 | 160 (6.2%) | 223 (11.2%) |
| $35,000 to $39,999 | 171 (6.7%) | 85 (4.3%) |
| $40,000 to $44,999 | 130 (5.1%) | 154 (7.7%) |
| $45,000 to $49,999 | 100 (3.9%) | 33 (1.7%) |
| $50,000 to $54,999 | 65 (2.5%) | 38 (1.9%) |
| $55,000 to $64,999 | 157 (6.1%) | 73 (3.7%) |
| $65,000 to $74,999 | 125 (4.9%) | 33 (1.7%) |
| $75,000 to $99,999 | 316 (12.3%) | 68 (3.4%) |
| $100,000+ | 336 (13.1%) | 46 (2.3%) |
| Total | 2,560 (100.0%) | 1,991 (100.0%) |
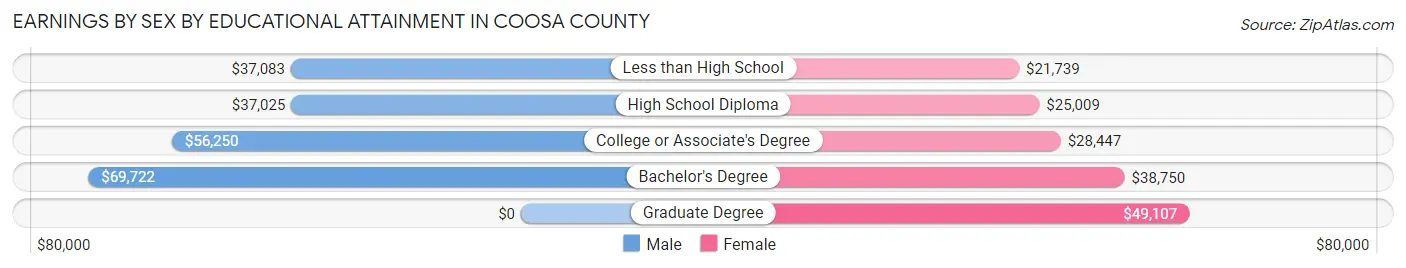
Earnings by Sex by Educational Attainment in Coosa County
Average earnings in Coosa County are $42,486 for men and $26,460 for women, a difference of 37.7%. Men with an educational attainment of bachelor's degree enjoy the highest average annual earnings of $69,722, while those with high school diploma education earn the least with $37,025. Women with an educational attainment of graduate degree earn the most with the average annual earnings of $49,107, while those with less than high school education have the smallest earnings of $21,739.
| Educational Attainment | Male Income | Female Income |
| Less than High School | $37,083 | $21,739 |
| High School Diploma | $37,025 | $25,009 |
| College or Associate's Degree | $56,250 | $28,447 |
| Bachelor's Degree | $69,722 | $38,750 |
| Graduate Degree | - | - |
| Total | $42,486 | $26,460 |
Family Income in Coosa County
Family Income Brackets in Coosa County
According to the Coosa County family income data, there are 635 families falling into the $50,000 to $74,999 income range, which is the most common income bracket and makes up 23.0% of all families. Conversely, the $10,000 to $14,999 income bracket is the least frequent group with only 66 families (2.4%) belonging to this category.
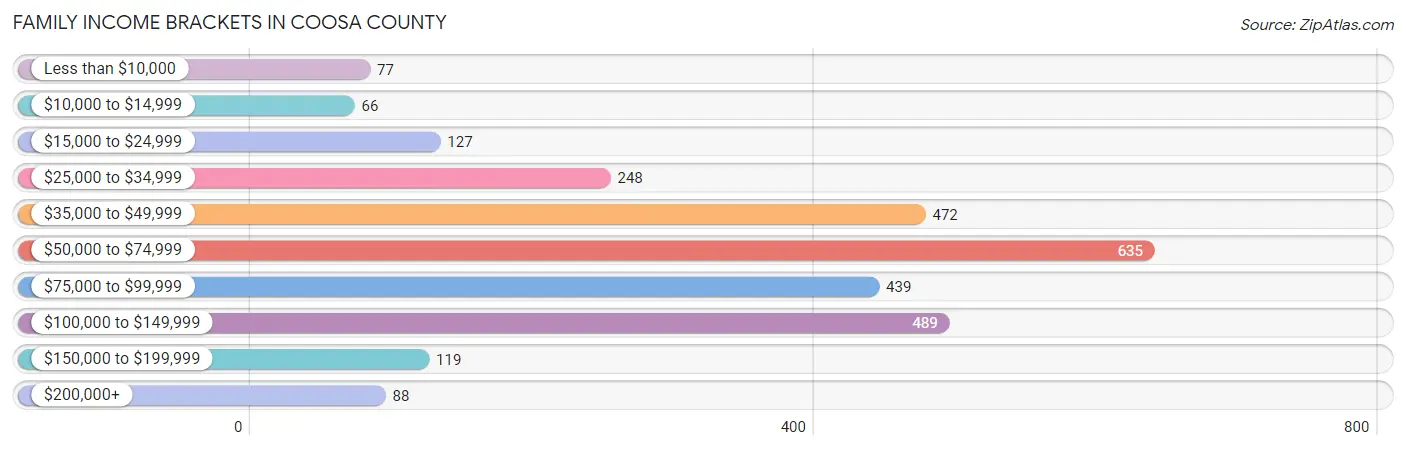
| Income Bracket | # Families | % Families |
| Less than $10,000 | 77 | 2.8% |
| $10,000 to $14,999 | 66 | 2.4% |
| $15,000 to $24,999 | 127 | 4.6% |
| $25,000 to $34,999 | 248 | 9.0% |
| $35,000 to $49,999 | 472 | 17.1% |
| $50,000 to $74,999 | 635 | 23.0% |
| $75,000 to $99,999 | 439 | 15.9% |
| $100,000 to $149,999 | 489 | 17.7% |
| $150,000 to $199,999 | 119 | 4.3% |
| $200,000+ | 88 | 3.2% |
Family Income by Famaliy Size in Coosa County
5-person families (121 | 4.4%) account for the highest median family income in Coosa County with $89,861 per family, while 2-person families (1,711 | 62.0%) have the highest median income of $29,658 per family member.
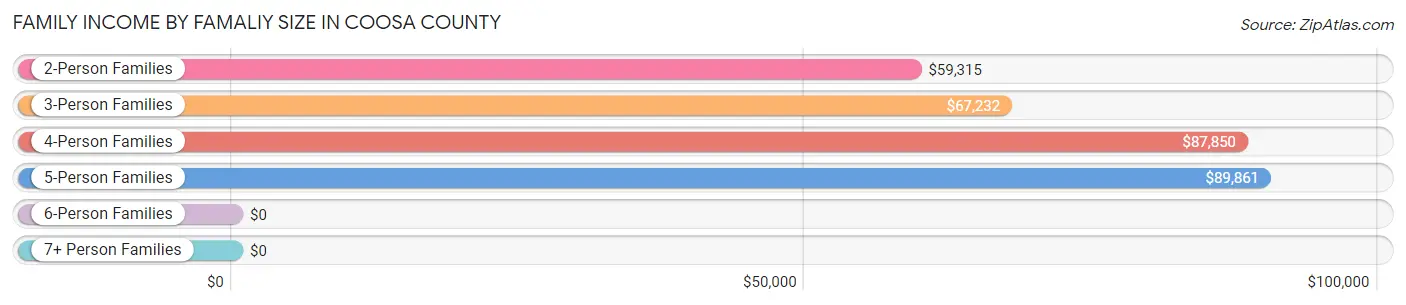
| Income Bracket | # Families | Median Income |
| 2-Person Families | 1,711 (62.0%) | $59,315 |
| 3-Person Families | 449 (16.3%) | $67,232 |
| 4-Person Families | 447 (16.2%) | $87,850 |
| 5-Person Families | 121 (4.4%) | $89,861 |
| 6-Person Families | 13 (0.5%) | $0 |
| 7+ Person Families | 20 (0.7%) | $0 |
| Total | 2,761 (100.0%) | $64,482 |
Family Income by Number of Earners in Coosa County
The median family income in Coosa County is $64,482, with families comprising 3+ earners (84) having the highest median family income of $99,886, while families with no earners (724) have the lowest median family income of $46,750, accounting for 3.0% and 26.2% of families, respectively.
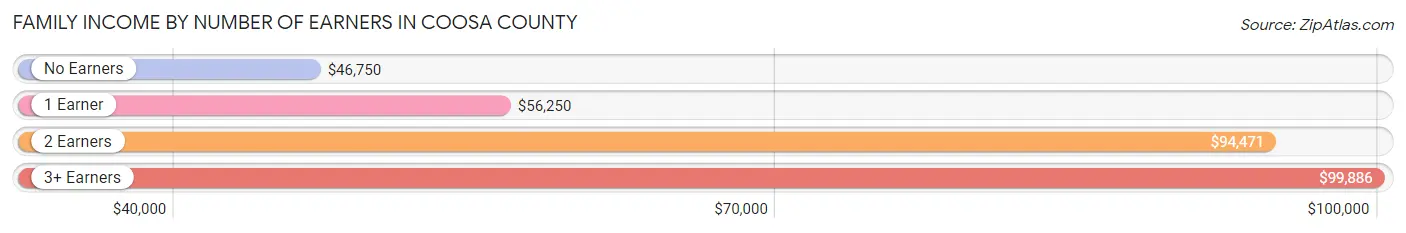
| Number of Earners | # Families | Median Income |
| No Earners | 724 (26.2%) | $46,750 |
| 1 Earner | 1,134 (41.1%) | $56,250 |
| 2 Earners | 819 (29.7%) | $94,471 |
| 3+ Earners | 84 (3.0%) | $99,886 |
| Total | 2,761 (100.0%) | $64,482 |
Household Income in Coosa County
Household Income Brackets in Coosa County
With 760 households falling in the category, the $50,000 to $74,999 income range is the most frequent in Coosa County, accounting for 19.0% of all households. In contrast, only 84 households (2.1%) fall into the less than $10,000 income bracket, making it the least populous group.
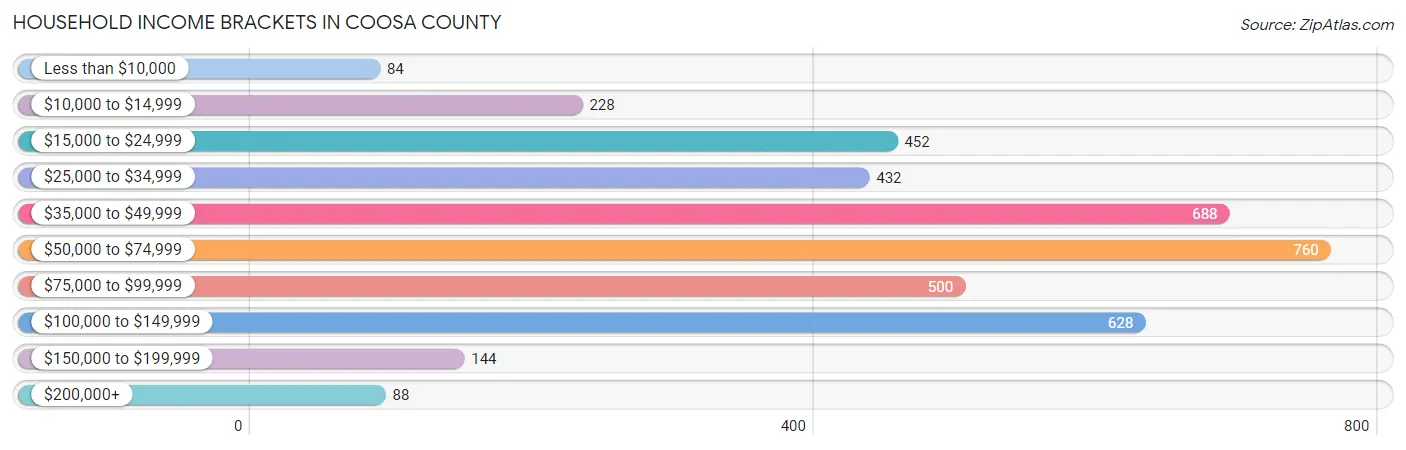
| Income Bracket | # Households | % Households |
| Less than $10,000 | 84 | 2.1% |
| $10,000 to $14,999 | 228 | 5.7% |
| $15,000 to $24,999 | 452 | 11.3% |
| $25,000 to $34,999 | 432 | 10.8% |
| $35,000 to $49,999 | 688 | 17.2% |
| $50,000 to $74,999 | 760 | 19.0% |
| $75,000 to $99,999 | 500 | 12.5% |
| $100,000 to $149,999 | 628 | 15.7% |
| $150,000 to $199,999 | 144 | 3.6% |
| $200,000+ | 88 | 2.2% |
Household Income by Householder Age in Coosa County
The median household income in Coosa County is $52,279, with the highest median household income of $61,855 found in the 45 to 64 years age bracket for the primary householder. A total of 1,848 households (46.2%) fall into this category. Meanwhile, the 25 to 44 years age bracket for the primary householder has the lowest median household income of $44,911, with 625 households (15.6%) in this group.
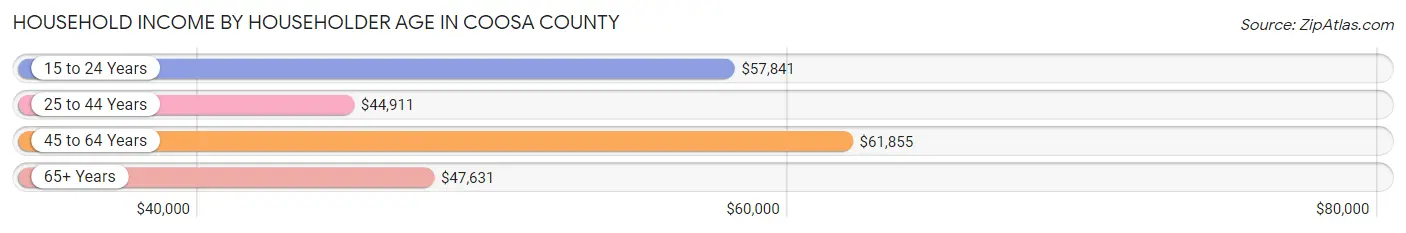
| Income Bracket | # Households | Median Income |
| 15 to 24 Years | 55 (1.4%) | $57,841 |
| 25 to 44 Years | 625 (15.6%) | $44,911 |
| 45 to 64 Years | 1,848 (46.2%) | $61,855 |
| 65+ Years | 1,471 (36.8%) | $47,631 |
| Total | 3,999 (100.0%) | $52,279 |
Poverty in Coosa County
Income Below Poverty by Sex and Age in Coosa County
With 10.9% poverty level for males and 11.2% for females among the residents of Coosa County, 15 year old males and 5 year old females are the most vulnerable to poverty, with 39 males (46.4%) and 11 females (50.0%) in their respective age groups living below the poverty level.
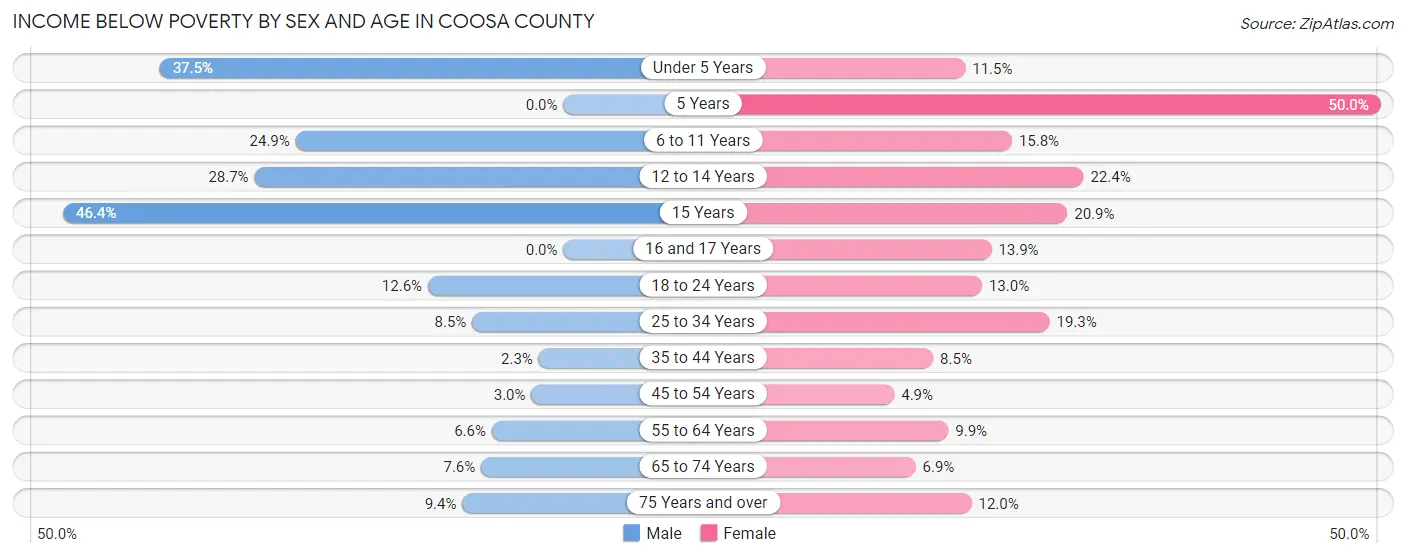
| Age Bracket | Male | Female |
| Under 5 Years | 115 (37.5%) | 18 (11.5%) |
| 5 Years | 0 (0.0%) | 11 (50.0%) |
| 6 to 11 Years | 81 (24.8%) | 24 (15.8%) |
| 12 to 14 Years | 43 (28.7%) | 48 (22.4%) |
| 15 Years | 39 (46.4%) | 18 (20.9%) |
| 16 and 17 Years | 0 (0.0%) | 10 (13.9%) |
| 18 to 24 Years | 42 (12.6%) | 35 (13.0%) |
| 25 to 34 Years | 34 (8.5%) | 102 (19.3%) |
| 35 to 44 Years | 12 (2.3%) | 44 (8.5%) |
| 45 to 54 Years | 21 (3.0%) | 32 (4.9%) |
| 55 to 64 Years | 61 (6.6%) | 96 (9.9%) |
| 65 to 74 Years | 56 (7.6%) | 51 (6.9%) |
| 75 Years and over | 41 (9.4%) | 68 (12.0%) |
| Total | 545 (10.9%) | 557 (11.2%) |
Income Above Poverty by Sex and Age in Coosa County
According to the poverty statistics in Coosa County, males aged 5 years and females aged 45 to 54 years are the age groups that are most secure financially, with 100.0% of males and 95.1% of females in these age groups living above the poverty line.
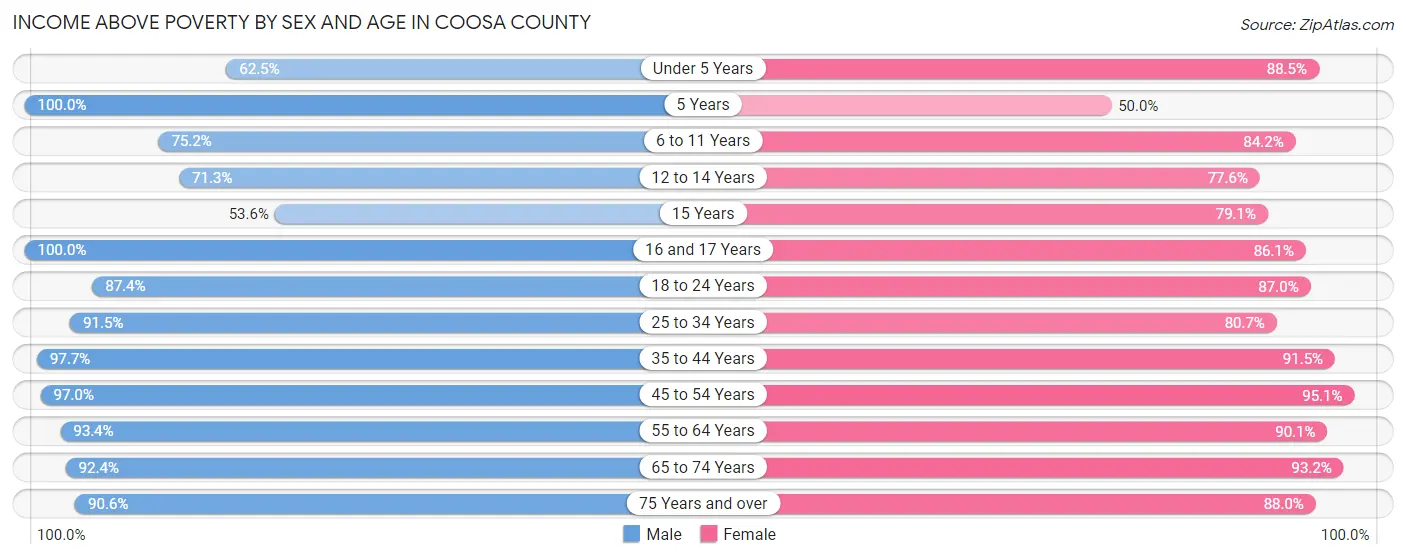
| Age Bracket | Male | Female |
| Under 5 Years | 192 (62.5%) | 139 (88.5%) |
| 5 Years | 6 (100.0%) | 11 (50.0%) |
| 6 to 11 Years | 245 (75.1%) | 128 (84.2%) |
| 12 to 14 Years | 107 (71.3%) | 166 (77.6%) |
| 15 Years | 45 (53.6%) | 68 (79.1%) |
| 16 and 17 Years | 82 (100.0%) | 62 (86.1%) |
| 18 to 24 Years | 292 (87.4%) | 234 (87.0%) |
| 25 to 34 Years | 368 (91.5%) | 427 (80.7%) |
| 35 to 44 Years | 511 (97.7%) | 475 (91.5%) |
| 45 to 54 Years | 687 (97.0%) | 625 (95.1%) |
| 55 to 64 Years | 857 (93.4%) | 875 (90.1%) |
| 65 to 74 Years | 678 (92.4%) | 694 (93.1%) |
| 75 Years and over | 396 (90.6%) | 497 (88.0%) |
| Total | 4,466 (89.1%) | 4,401 (88.8%) |
Income Below Poverty Among Married-Couple Families in Coosa County
The poverty statistics for married-couple families in Coosa County show that 3.8% or 75 of the total 1,980 families live below the poverty line. Families with 3 or 4 children have the highest poverty rate of 27.0%, comprising of 10 families. On the other hand, families with 5 or more children have the lowest poverty rate of 0.0%, which includes 0 families.
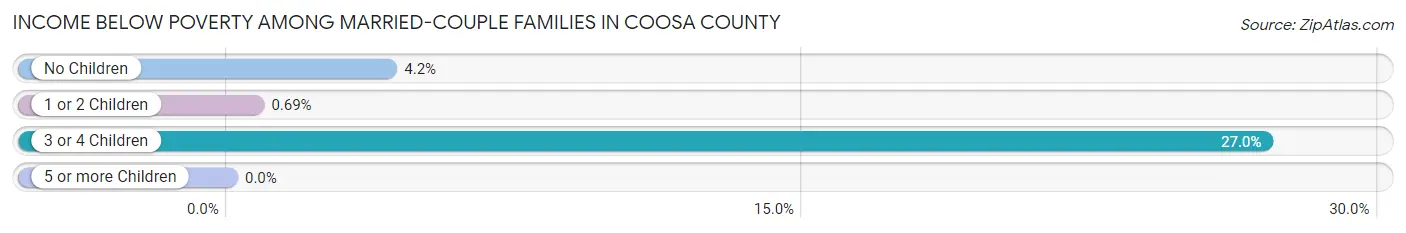
| Children | Above Poverty | Below Poverty |
| No Children | 1,429 (95.8%) | 62 (4.2%) |
| 1 or 2 Children | 429 (99.3%) | 3 (0.7%) |
| 3 or 4 Children | 27 (73.0%) | 10 (27.0%) |
| 5 or more Children | 20 (100.0%) | 0 (0.0%) |
| Total | 1,905 (96.2%) | 75 (3.8%) |
Income Below Poverty Among Single-Parent Households in Coosa County
According to the poverty data in Coosa County, 10.3% or 21 single-father households and 21.5% or 124 single-mother households are living below the poverty line. Among single-father households, those with 1 or 2 children have the highest poverty rate, with 21 households (27.6%) experiencing poverty. Likewise, among single-mother households, those with 3 or 4 children have the highest poverty rate, with 93 households (65.5%) falling below the poverty line.
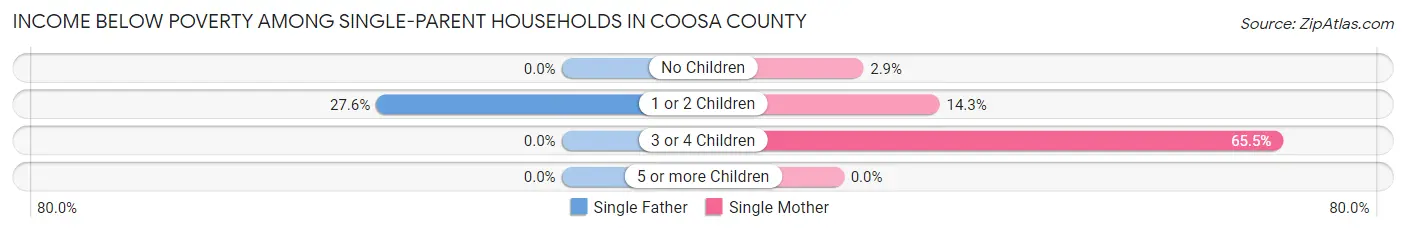
| Children | Single Father | Single Mother |
| No Children | 0 (0.0%) | 8 (2.9%) |
| 1 or 2 Children | 21 (27.6%) | 23 (14.3%) |
| 3 or 4 Children | 0 (0.0%) | 93 (65.5%) |
| 5 or more Children | 0 (0.0%) | 0 (0.0%) |
| Total | 21 (10.3%) | 124 (21.5%) |
Income Below Poverty Among Married-Couple vs Single-Parent Households in Coosa County
The poverty data for Coosa County shows that 75 of the married-couple family households (3.8%) and 145 of the single-parent households (18.6%) are living below the poverty level. Within the married-couple family households, those with 3 or 4 children have the highest poverty rate, with 10 households (27.0%) falling below the poverty line. Among the single-parent households, those with 3 or 4 children have the highest poverty rate, with 93 household (65.5%) living below poverty.
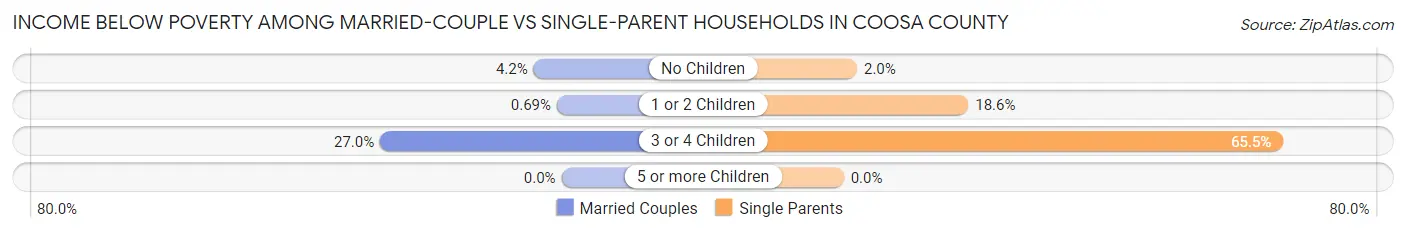
| Children | Married-Couple Families | Single-Parent Households |
| No Children | 62 (4.2%) | 8 (2.0%) |
| 1 or 2 Children | 3 (0.7%) | 44 (18.6%) |
| 3 or 4 Children | 10 (27.0%) | 93 (65.5%) |
| 5 or more Children | 0 (0.0%) | 0 (0.0%) |
| Total | 75 (3.8%) | 145 (18.6%) |
Race in Coosa County
The most populous races in Coosa County are White / Caucasian (6,859 | 66.4%), Black / African American (3,120 | 30.2%), and Hispanic or Latino (284 | 2.8%).
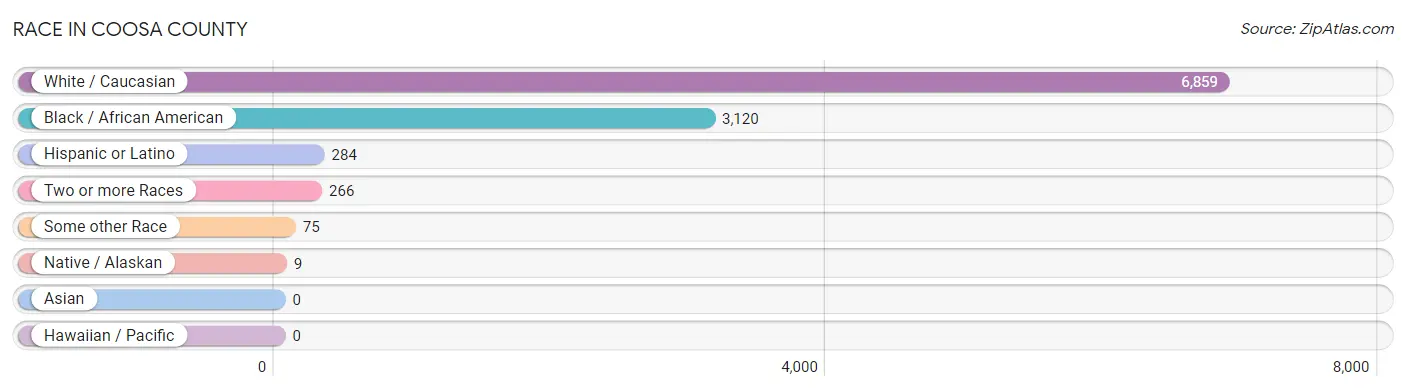
| Race | # Population | % Population |
| Asian | 0 | 0.0% |
| Black / African American | 3,120 | 30.2% |
| Hawaiian / Pacific | 0 | 0.0% |
| Hispanic or Latino | 284 | 2.8% |
| Native / Alaskan | 9 | 0.1% |
| White / Caucasian | 6,859 | 66.4% |
| Two or more Races | 266 | 2.6% |
| Some other Race | 75 | 0.7% |
| Total | 10,329 | 100.0% |
Ancestry in Coosa County
The most populous ancestries reported in Coosa County are American (1,437 | 13.9%), English (1,095 | 10.6%), Irish (799 | 7.7%), German (625 | 6.0%), and Scottish (222 | 2.1%), together accounting for 40.5% of all Coosa County residents.
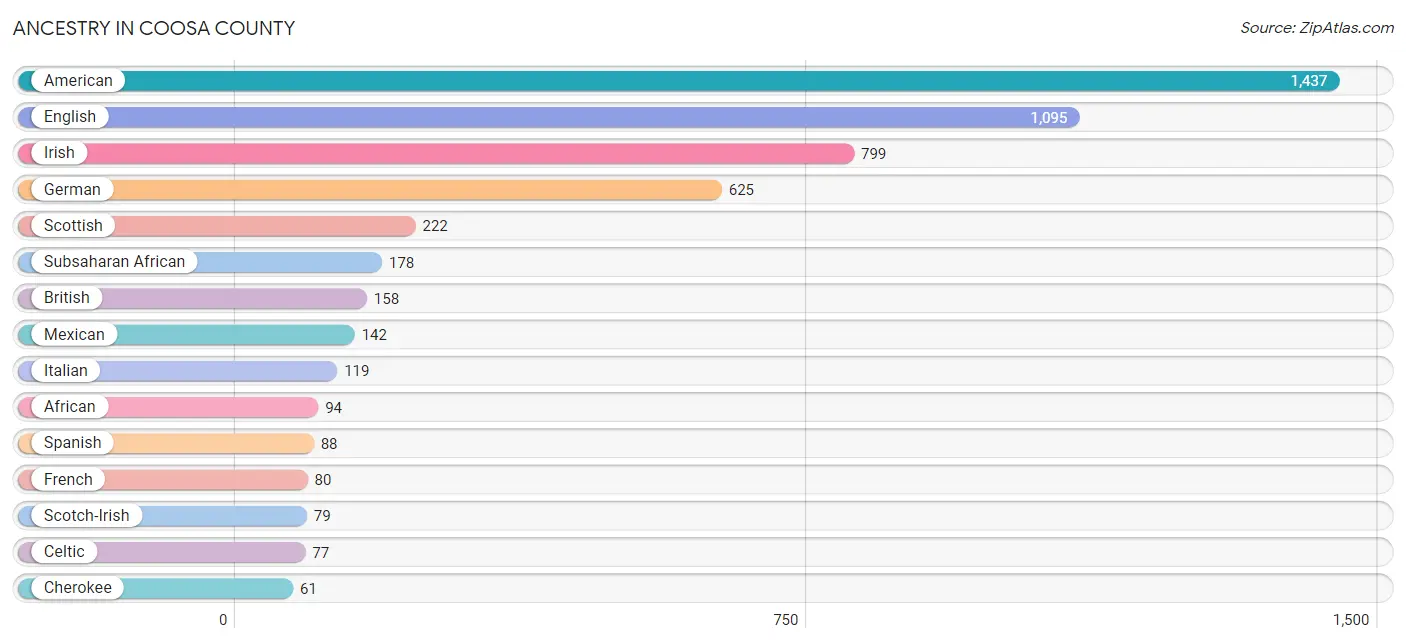
| Ancestry | # Population | % Population |
| African | 94 | 0.9% |
| American | 1,437 | 13.9% |
| British | 158 | 1.5% |
| Burmese | 16 | 0.2% |
| Celtic | 77 | 0.7% |
| Cherokee | 61 | 0.6% |
| Creek | 14 | 0.1% |
| Crow | 2 | 0.0% |
| Dutch | 29 | 0.3% |
| Eastern European | 31 | 0.3% |
| English | 1,095 | 10.6% |
| European | 46 | 0.4% |
| Finnish | 12 | 0.1% |
| French | 80 | 0.8% |
| French Canadian | 28 | 0.3% |
| German | 625 | 6.0% |
| Irish | 799 | 7.7% |
| Italian | 119 | 1.1% |
| Mexican | 142 | 1.4% |
| Nigerian | 52 | 0.5% |
| Norwegian | 11 | 0.1% |
| Puerto Rican | 54 | 0.5% |
| Scandinavian | 26 | 0.3% |
| Scotch-Irish | 79 | 0.8% |
| Scottish | 222 | 2.1% |
| Sioux | 6 | 0.1% |
| South African | 32 | 0.3% |
| South American Indian | 3 | 0.0% |
| Spanish | 88 | 0.9% |
| Subsaharan African | 178 | 1.7% |
| Swedish | 9 | 0.1% |
| Turkish | 33 | 0.3% |
| Welsh | 30 | 0.3% | View All 33 Rows |
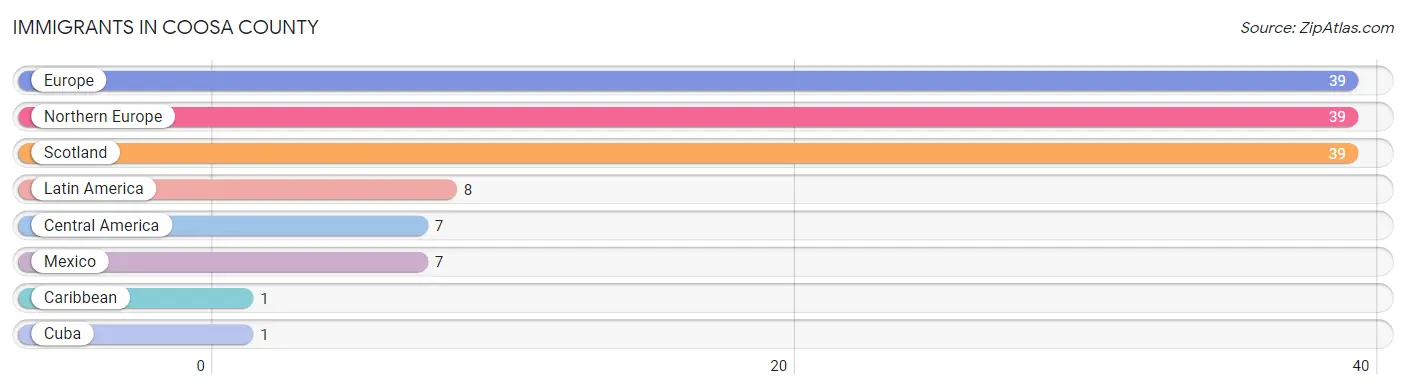
Immigrants in Coosa County
The most numerous immigrant groups reported in Coosa County came from Europe (39 | 0.4%), Northern Europe (39 | 0.4%), Scotland (39 | 0.4%), Latin America (8 | 0.1%), and Central America (7 | 0.1%), together accounting for 1.3% of all Coosa County residents.
| Immigration Origin | # Population | % Population |
| Caribbean | 1 | 0.0% |
| Central America | 7 | 0.1% |
| Cuba | 1 | 0.0% |
| Europe | 39 | 0.4% |
| Latin America | 8 | 0.1% |
| Mexico | 7 | 0.1% |
| Northern Europe | 39 | 0.4% |
| Scotland | 39 | 0.4% | View All 8 Rows |
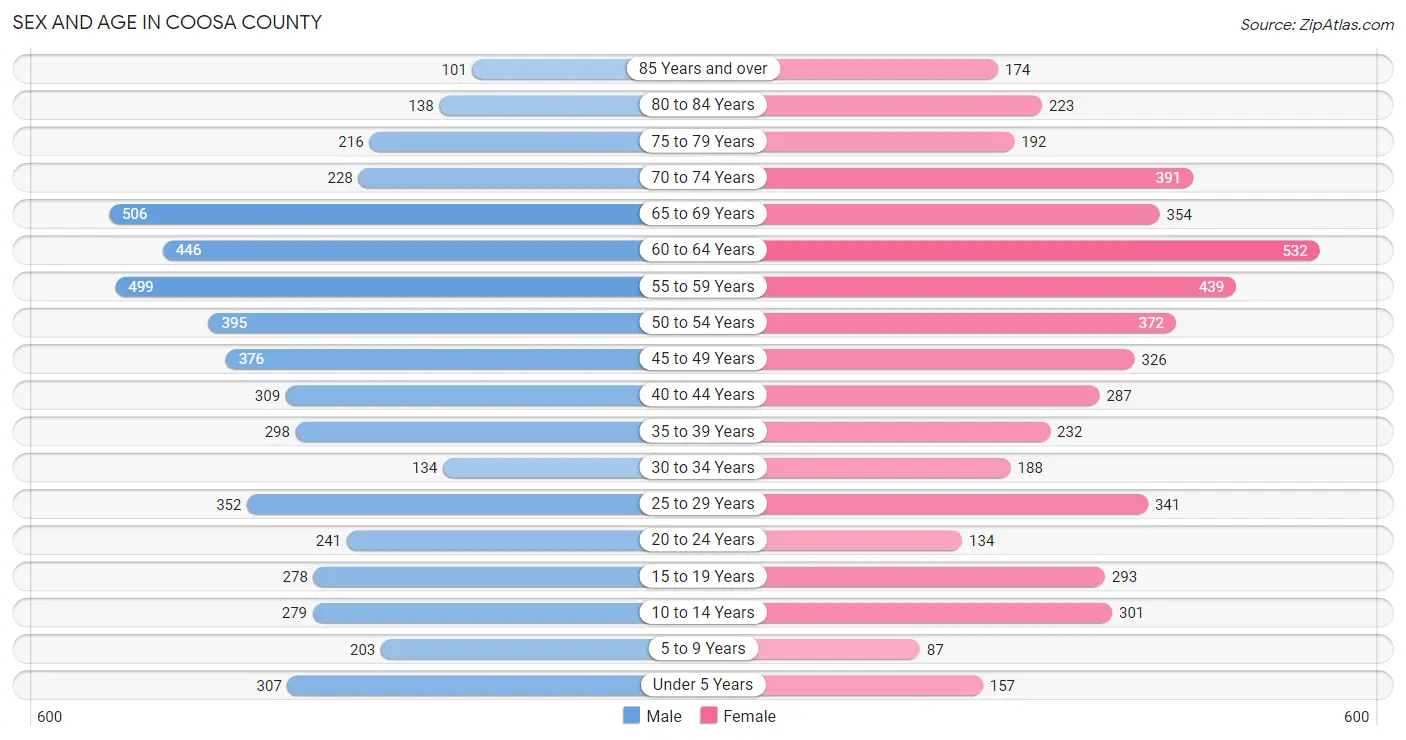
Sex and Age in Coosa County
Sex and Age in Coosa County
The most populous age groups in Coosa County are 65 to 69 Years (506 | 9.5%) for men and 60 to 64 Years (532 | 10.6%) for women.
| Age Bracket | Male | Female |
| Under 5 Years | 307 (5.8%) | 157 (3.1%) |
| 5 to 9 Years | 203 (3.8%) | 87 (1.7%) |
| 10 to 14 Years | 279 (5.3%) | 301 (6.0%) |
| 15 to 19 Years | 278 (5.2%) | 293 (5.8%) |
| 20 to 24 Years | 241 (4.5%) | 134 (2.7%) |
| 25 to 29 Years | 352 (6.6%) | 341 (6.8%) |
| 30 to 34 Years | 134 (2.5%) | 188 (3.7%) |
| 35 to 39 Years | 298 (5.6%) | 232 (4.6%) |
| 40 to 44 Years | 309 (5.8%) | 287 (5.7%) |
| 45 to 49 Years | 376 (7.1%) | 326 (6.5%) |
| 50 to 54 Years | 395 (7.4%) | 372 (7.4%) |
| 55 to 59 Years | 499 (9.4%) | 439 (8.7%) |
| 60 to 64 Years | 446 (8.4%) | 532 (10.6%) |
| 65 to 69 Years | 506 (9.5%) | 354 (7.0%) |
| 70 to 74 Years | 228 (4.3%) | 391 (7.8%) |
| 75 to 79 Years | 216 (4.1%) | 192 (3.8%) |
| 80 to 84 Years | 138 (2.6%) | 223 (4.4%) |
| 85 Years and over | 101 (1.9%) | 174 (3.5%) |
| Total | 5,306 (100.0%) | 5,023 (100.0%) |
Families and Households in Coosa County
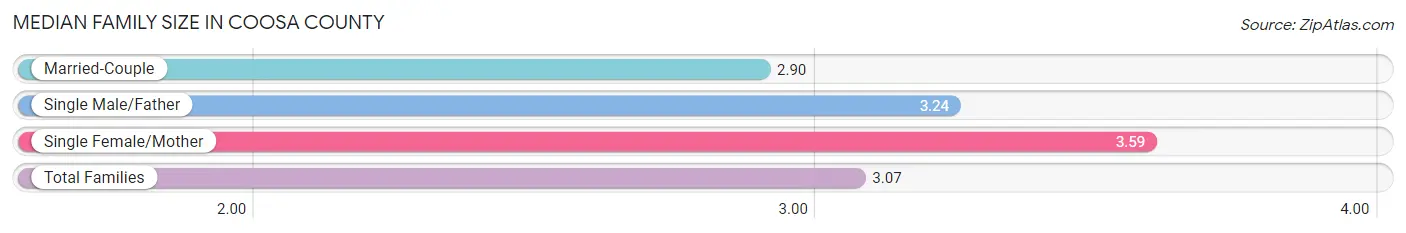
Median Family Size in Coosa County
The median family size in Coosa County is 3.07 persons per family, with single female/mother families (577 | 20.9%) accounting for the largest median family size of 3.59 persons per family. On the other hand, married-couple families (1,980 | 71.7%) represent the smallest median family size with 2.90 persons per family.
| Family Type | # Families | Family Size |
| Married-Couple | 1,980 (71.7%) | 2.90 |
| Single Male/Father | 204 (7.4%) | 3.24 |
| Single Female/Mother | 577 (20.9%) | 3.59 |
| Total Families | 2,761 (100.0%) | 3.07 |
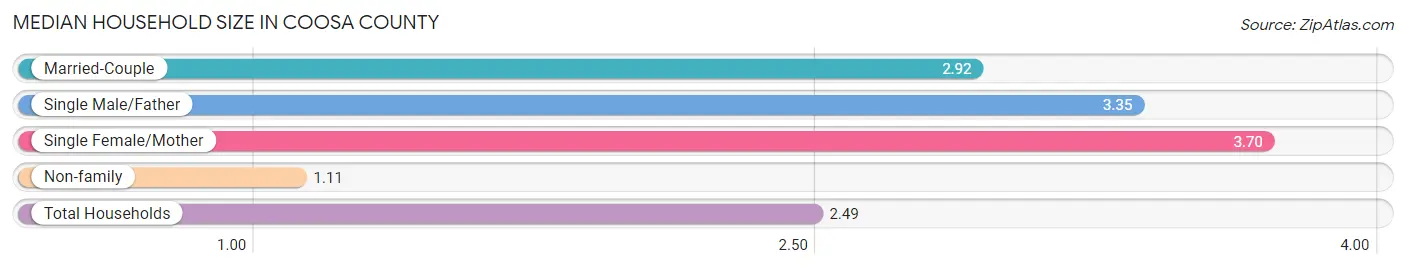
Median Household Size in Coosa County
The median household size in Coosa County is 2.49 persons per household, with single female/mother households (577 | 14.4%) accounting for the largest median household size of 3.7 persons per household. non-family households (1,238 | 31.0%) represent the smallest median household size with 1.11 persons per household.
| Household Type | # Households | Household Size |
| Married-Couple | 1,980 (49.5%) | 2.92 |
| Single Male/Father | 204 (5.1%) | 3.35 |
| Single Female/Mother | 577 (14.4%) | 3.70 |
| Non-family | 1,238 (31.0%) | 1.11 |
| Total Households | 3,999 (100.0%) | 2.49 |
Household Size by Marriage Status in Coosa County
Out of a total of 3,999 households in Coosa County, 2,761 (69.0%) are family households, while 1,238 (31.0%) are nonfamily households. The most numerous type of family households are 2-person households, comprising 1,668, and the most common type of nonfamily households are 1-person households, comprising 1,102.
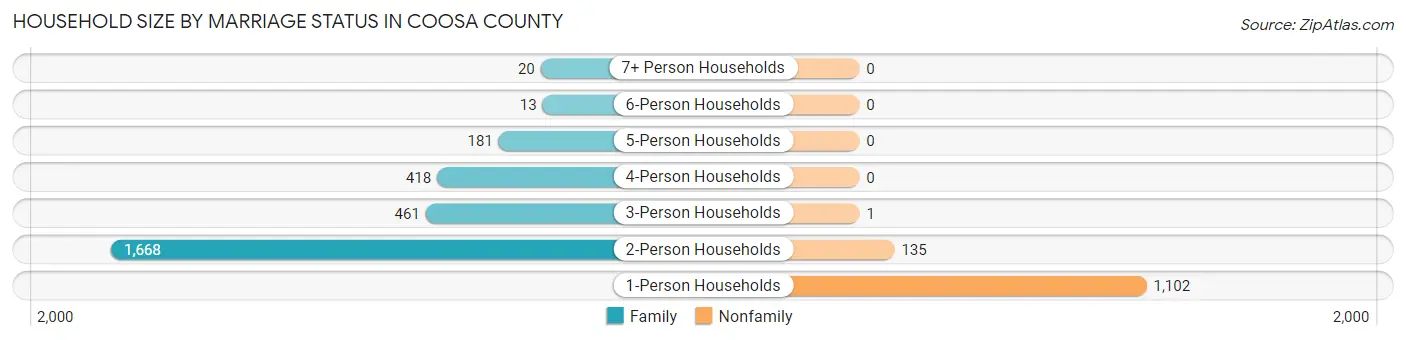
| Household Size | Family Households | Nonfamily Households |
| 1-Person Households | - | 1,102 (27.6%) |
| 2-Person Households | 1,668 (41.7%) | 135 (3.4%) |
| 3-Person Households | 461 (11.5%) | 1 (0.0%) |
| 4-Person Households | 418 (10.4%) | 0 (0.0%) |
| 5-Person Households | 181 (4.5%) | 0 (0.0%) |
| 6-Person Households | 13 (0.3%) | 0 (0.0%) |
| 7+ Person Households | 20 (0.5%) | 0 (0.0%) |
| Total | 2,761 (69.0%) | 1,238 (31.0%) |
Female Fertility in Coosa County
Fertility by Age in Coosa County
Average fertility rate in Coosa County is 49.0 births per 1,000 women. Women in the age bracket of 20 to 34 years have the highest fertility rate with 83.0 births per 1,000 women. Women in the age bracket of 20 to 34 years acount for 57.9% of all women with births.
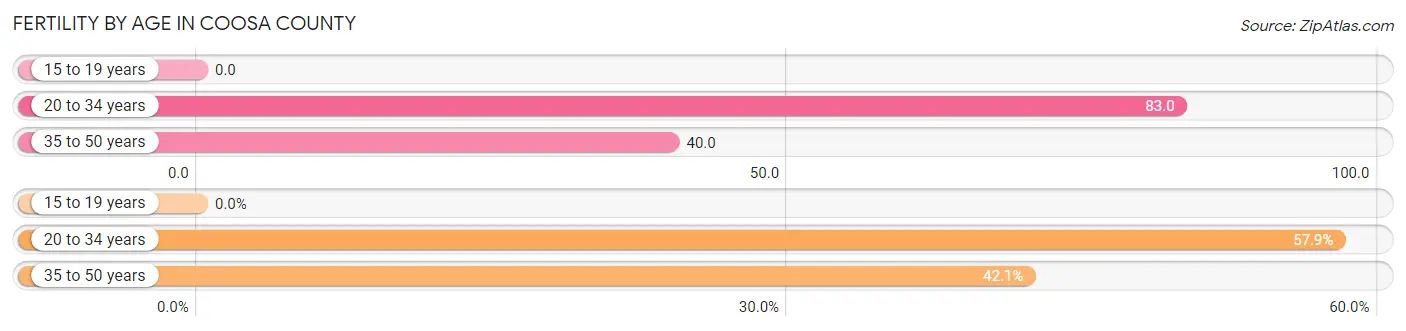
| Age Bracket | Women with Births | Births / 1,000 Women |
| 15 to 19 years | 0 (0.0%) | 0.0 |
| 20 to 34 years | 55 (57.9%) | 83.0 |
| 35 to 50 years | 40 (42.1%) | 40.0 |
| Total | 95 (100.0%) | 49.0 |
Fertility by Age by Marriage Status in Coosa County
85.3% of women with births (95) in Coosa County are married. The highest percentage of unmarried women with births falls into 20 to 34 years age bracket with 25.5% of them unmarried at the time of birth, while the lowest percentage of unmarried women with births belong to 35 to 50 years age bracket with 0.0% of them unmarried.
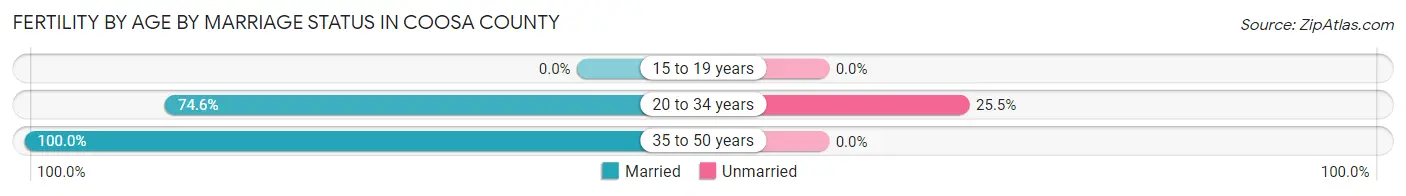
| Age Bracket | Married | Unmarried |
| 15 to 19 years | 0 (0.0%) | 0 (0.0%) |
| 20 to 34 years | 41 (74.6%) | 14 (25.5%) |
| 35 to 50 years | 40 (100.0%) | 0 (0.0%) |
| Total | 81 (85.3%) | 14 (14.7%) |
Fertility by Education in Coosa County
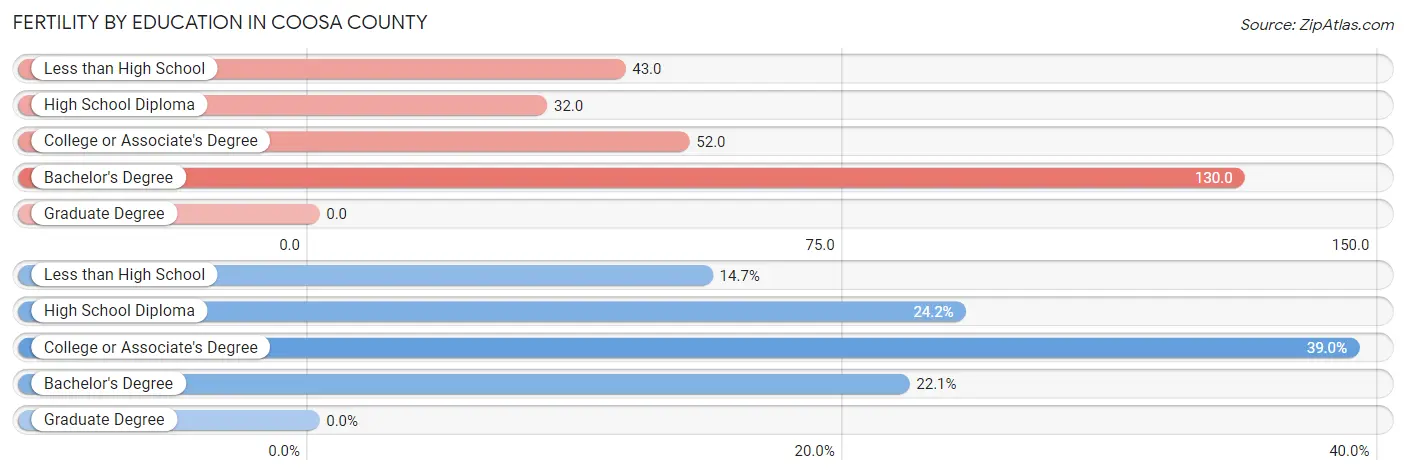
| Educational Attainment | Women with Births | Births / 1,000 Women |
| Less than High School | 14 (14.7%) | 43.0 |
| High School Diploma | 23 (24.2%) | 32.0 |
| College or Associate's Degree | 37 (39.0%) | 52.0 |
| Bachelor's Degree | 21 (22.1%) | 130.0 |
| Graduate Degree | 0 (0.0%) | 0.0 |
| Total | 95 (100.0%) | 49.0 |
Fertility by Education by Marriage Status in Coosa County
14.7% of women with births in Coosa County are unmarried. Women with the educational attainment of high school diploma are most likely to be married with 100.0% of them married at childbirth, while women with the educational attainment of less than high school are least likely to be married with 100.0% of them unmarried at childbirth.
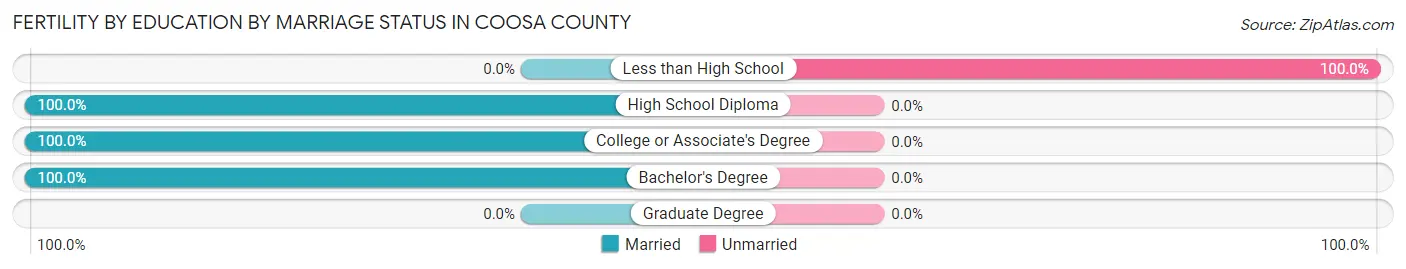
| Educational Attainment | Married | Unmarried |
| Less than High School | 0 (0.0%) | 14 (100.0%) |
| High School Diploma | 23 (100.0%) | 0 (0.0%) |
| College or Associate's Degree | 37 (100.0%) | 0 (0.0%) |
| Bachelor's Degree | 21 (100.0%) | 0 (0.0%) |
| Graduate Degree | 0 (0.0%) | 0 (0.0%) |
| Total | 81 (85.3%) | 14 (14.7%) |
Employment Characteristics in Coosa County
Employment by Class of Employer in Coosa County
Among the 3,851 employed individuals in Coosa County, private company employees (2,765 | 71.8%), not-for-profit organizations (239 | 6.2%), and self-employed (not incorporated) (232 | 6.0%) make up the most common classes of employment.
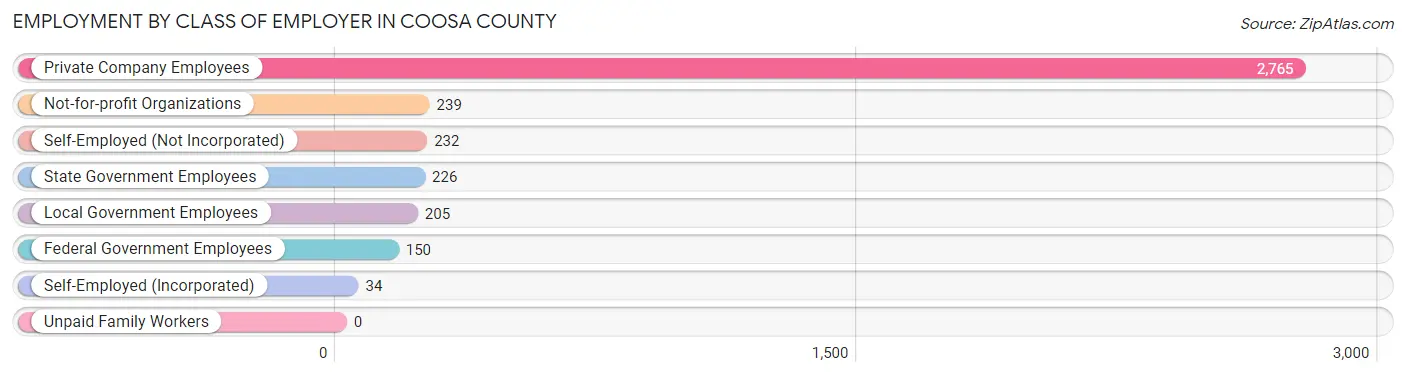
| Employer Class | # Employees | % Employees |
| Private Company Employees | 2,765 | 71.8% |
| Self-Employed (Incorporated) | 34 | 0.9% |
| Self-Employed (Not Incorporated) | 232 | 6.0% |
| Not-for-profit Organizations | 239 | 6.2% |
| Local Government Employees | 205 | 5.3% |
| State Government Employees | 226 | 5.9% |
| Federal Government Employees | 150 | 3.9% |
| Unpaid Family Workers | 0 | 0.0% |
| Total | 3,851 | 100.0% |
Employment Status by Age in Coosa County
According to the labor force statistics for Coosa County, out of the total population over 16 years of age (8,825), 46.4% or 4,095 individuals are in the labor force, with 4.4% or 180 of them unemployed. The age group with the highest labor force participation rate is 35 to 44 years, with 81.6% or 919 individuals in the labor force. Within the labor force, the 20 to 24 years age range has the highest percentage of unemployed individuals, with 27.0% or 47 of them being unemployed.
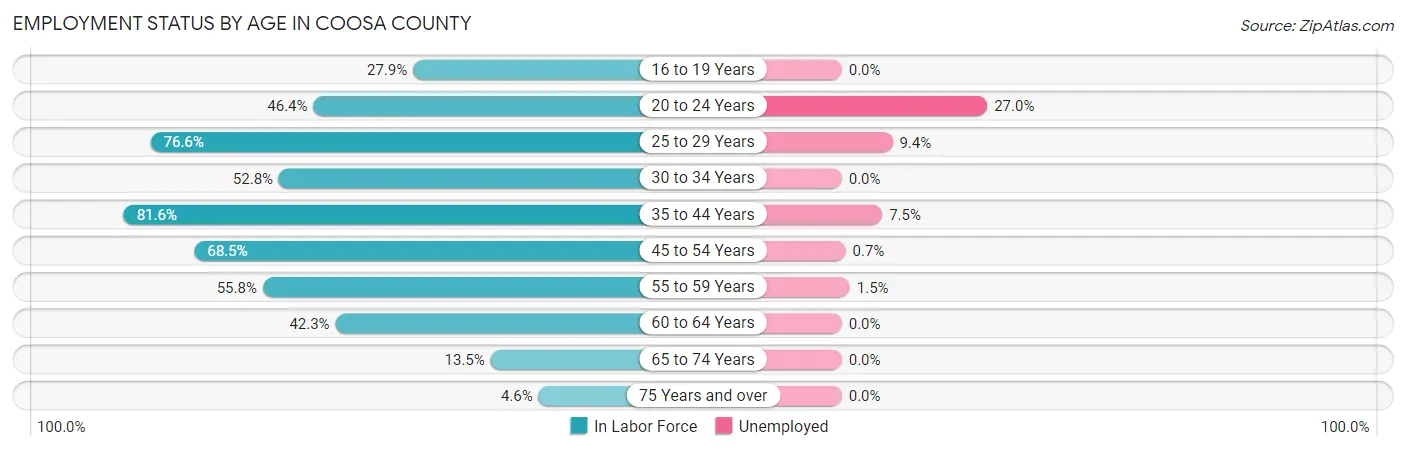
| Age Bracket | In Labor Force | Unemployed |
| 16 to 19 Years | 112 (27.9%) | 0 (0.0%) |
| 20 to 24 Years | 174 (46.4%) | 47 (27.0%) |
| 25 to 29 Years | 531 (76.6%) | 50 (9.4%) |
| 30 to 34 Years | 170 (52.8%) | 0 (0.0%) |
| 35 to 44 Years | 919 (81.6%) | 69 (7.5%) |
| 45 to 54 Years | 1,006 (68.5%) | 7 (0.7%) |
| 55 to 59 Years | 523 (55.8%) | 8 (1.5%) |
| 60 to 64 Years | 414 (42.3%) | 0 (0.0%) |
| 65 to 74 Years | 200 (13.5%) | 0 (0.0%) |
| 75 Years and over | 48 (4.6%) | 0 (0.0%) |
| Total | 4,095 (46.4%) | 180 (4.4%) |
Employment Status by Educational Attainment in Coosa County
According to labor force statistics for Coosa County, 64.5% of individuals (3,564) out of the total population between 25 and 64 years of age (5,526) are in the labor force, with 3.7% or 132 of them being unemployed. The group with the highest labor force participation rate are those with the educational attainment of bachelor's degree or higher, with 76.6% or 389 individuals in the labor force. Within the labor force, individuals with bachelor's degree or higher education have the highest percentage of unemployment, with 5.9% or 23 of them being unemployed.
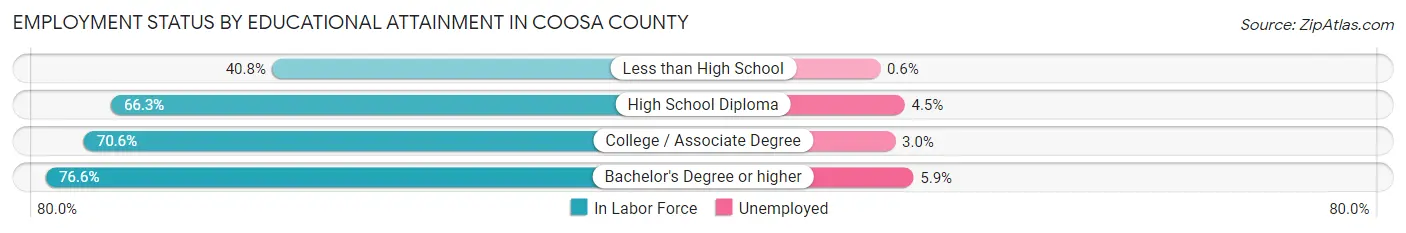
| Educational Attainment | In Labor Force | Unemployed |
| Less than High School | 372 (40.8%) | 5 (0.6%) |
| High School Diploma | 1,508 (66.3%) | 102 (4.5%) |
| College / Associate Degree | 1,293 (70.6%) | 55 (3.0%) |
| Bachelor's Degree or higher | 389 (76.6%) | 30 (5.9%) |
| Total | 3,564 (64.5%) | 204 (3.7%) |
Employment Occupations by Sex in Coosa County
Management, Business, Science and Arts Occupations
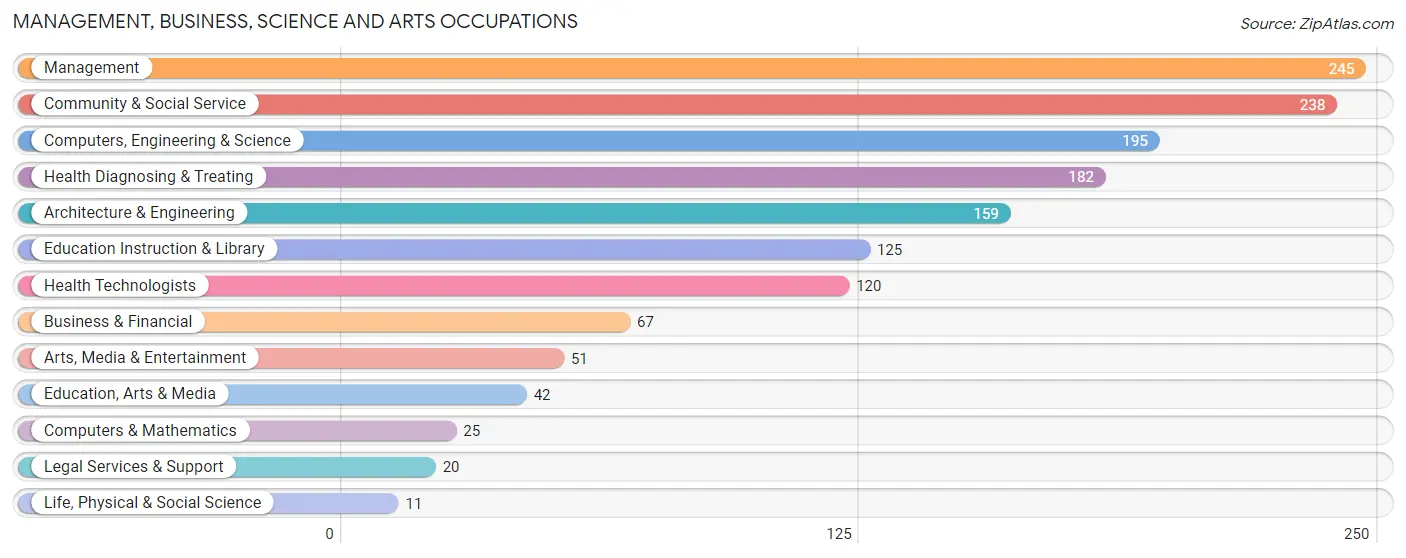
The most common Management, Business, Science and Arts occupations in Coosa County are Management (245 | 6.3%), Community & Social Service (238 | 6.1%), Computers, Engineering & Science (195 | 5.0%), Health Diagnosing & Treating (182 | 4.7%), and Architecture & Engineering (159 | 4.1%).
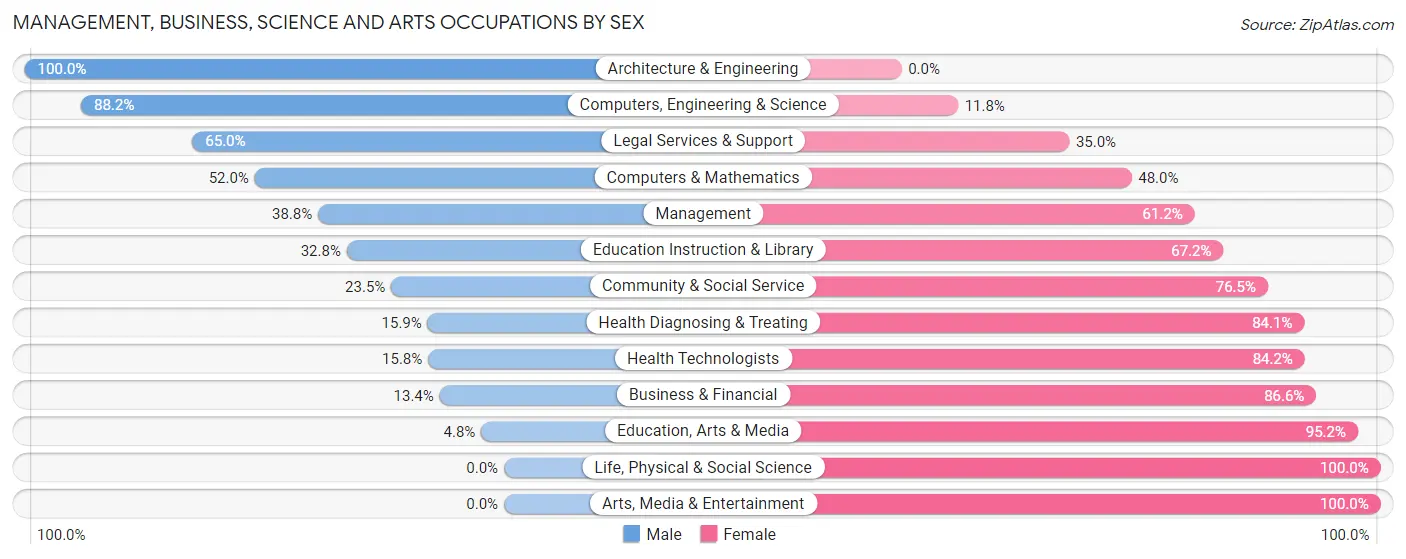
Management, Business, Science and Arts Occupations by Sex
Within the Management, Business, Science and Arts occupations in Coosa County, the most male-oriented occupations are Architecture & Engineering (100.0%), Computers, Engineering & Science (88.2%), and Legal Services & Support (65.0%), while the most female-oriented occupations are Life, Physical & Social Science (100.0%), Arts, Media & Entertainment (100.0%), and Education, Arts & Media (95.2%).
| Occupation | Male | Female |
| Management | 95 (38.8%) | 150 (61.2%) |
| Business & Financial | 9 (13.4%) | 58 (86.6%) |
| Computers, Engineering & Science | 172 (88.2%) | 23 (11.8%) |
| Computers & Mathematics | 13 (52.0%) | 12 (48.0%) |
| Architecture & Engineering | 159 (100.0%) | 0 (0.0%) |
| Life, Physical & Social Science | 0 (0.0%) | 11 (100.0%) |
| Community & Social Service | 56 (23.5%) | 182 (76.5%) |
| Education, Arts & Media | 2 (4.8%) | 40 (95.2%) |
| Legal Services & Support | 13 (65.0%) | 7 (35.0%) |
| Education Instruction & Library | 41 (32.8%) | 84 (67.2%) |
| Arts, Media & Entertainment | 0 (0.0%) | 51 (100.0%) |
| Health Diagnosing & Treating | 29 (15.9%) | 153 (84.1%) |
| Health Technologists | 19 (15.8%) | 101 (84.2%) |
| Total (Category) | 361 (38.9%) | 566 (61.1%) |
| Total (Overall) | 2,040 (52.7%) | 1,828 (47.3%) |
Services Occupations
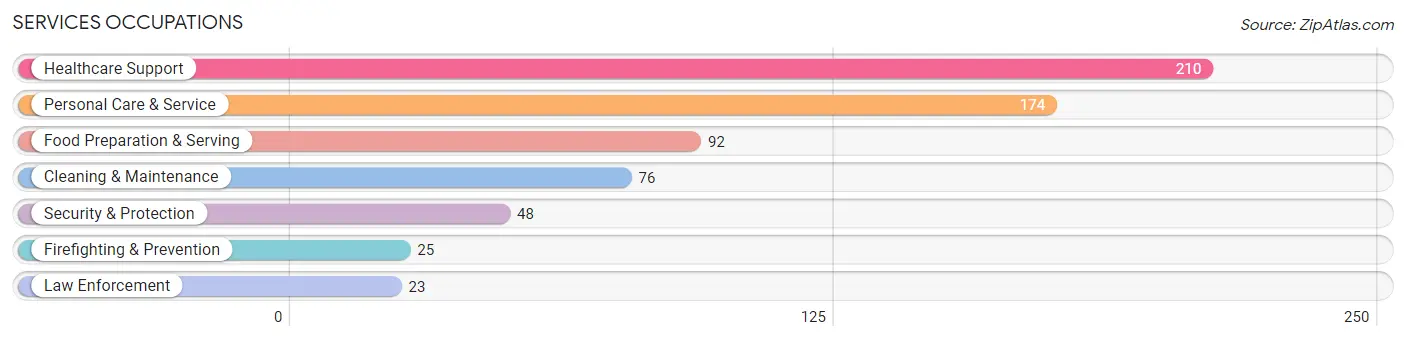
The most common Services occupations in Coosa County are Healthcare Support (210 | 5.4%), Personal Care & Service (174 | 4.5%), Food Preparation & Serving (92 | 2.4%), Cleaning & Maintenance (76 | 2.0%), and Security & Protection (48 | 1.2%).
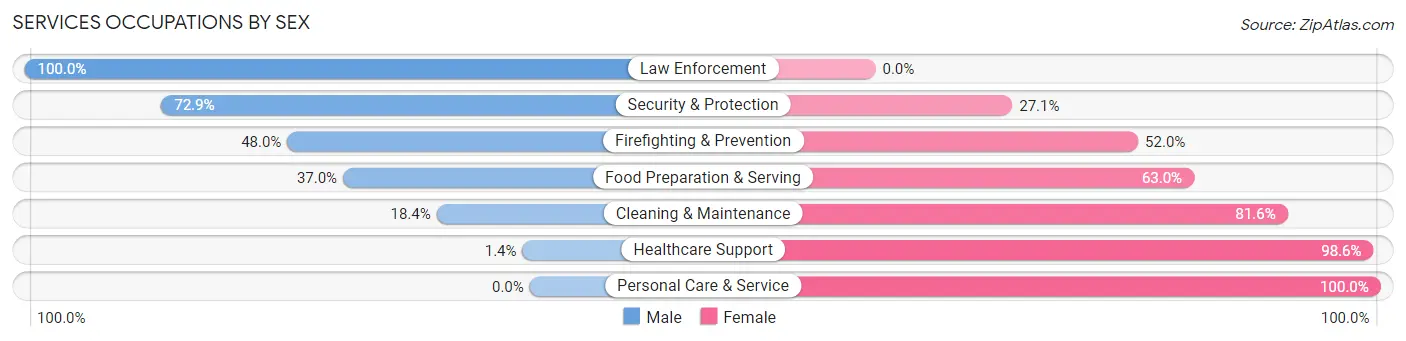
Services Occupations by Sex
Within the Services occupations in Coosa County, the most male-oriented occupations are Law Enforcement (100.0%), Security & Protection (72.9%), and Firefighting & Prevention (48.0%), while the most female-oriented occupations are Personal Care & Service (100.0%), Healthcare Support (98.6%), and Cleaning & Maintenance (81.6%).
| Occupation | Male | Female |
| Healthcare Support | 3 (1.4%) | 207 (98.6%) |
| Security & Protection | 35 (72.9%) | 13 (27.1%) |
| Firefighting & Prevention | 12 (48.0%) | 13 (52.0%) |
| Law Enforcement | 23 (100.0%) | 0 (0.0%) |
| Food Preparation & Serving | 34 (37.0%) | 58 (63.0%) |
| Cleaning & Maintenance | 14 (18.4%) | 62 (81.6%) |
| Personal Care & Service | 0 (0.0%) | 174 (100.0%) |
| Total (Category) | 86 (14.3%) | 514 (85.7%) |
| Total (Overall) | 2,040 (52.7%) | 1,828 (47.3%) |
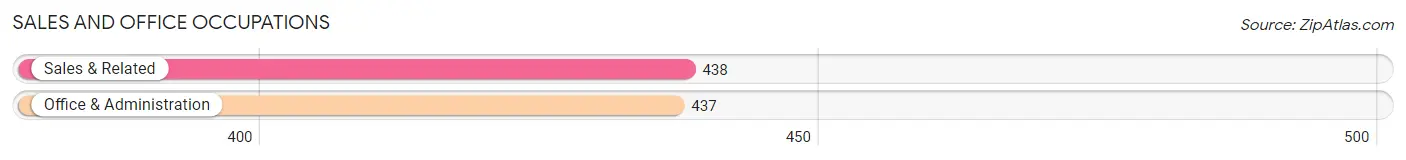
Sales and Office Occupations
The most common Sales and Office occupations in Coosa County are Sales & Related (438 | 11.3%), and Office & Administration (437 | 11.3%).
Sales and Office Occupations by Sex
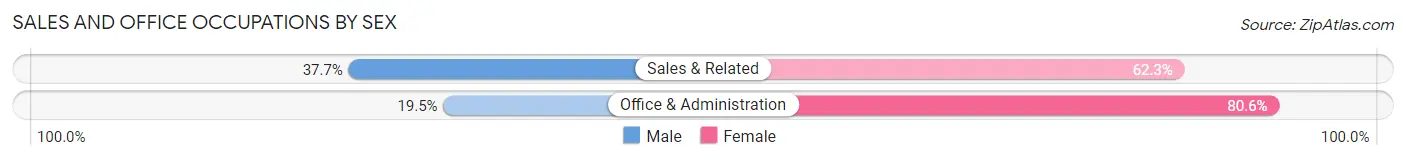
| Occupation | Male | Female |
| Sales & Related | 165 (37.7%) | 273 (62.3%) |
| Office & Administration | 85 (19.5%) | 352 (80.5%) |
| Total (Category) | 250 (28.6%) | 625 (71.4%) |
| Total (Overall) | 2,040 (52.7%) | 1,828 (47.3%) |
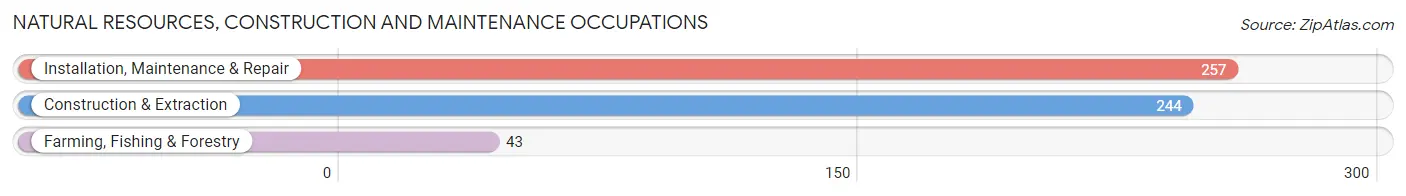
Natural Resources, Construction and Maintenance Occupations
The most common Natural Resources, Construction and Maintenance occupations in Coosa County are Installation, Maintenance & Repair (257 | 6.6%), Construction & Extraction (244 | 6.3%), and Farming, Fishing & Forestry (43 | 1.1%).
Natural Resources, Construction and Maintenance Occupations by Sex
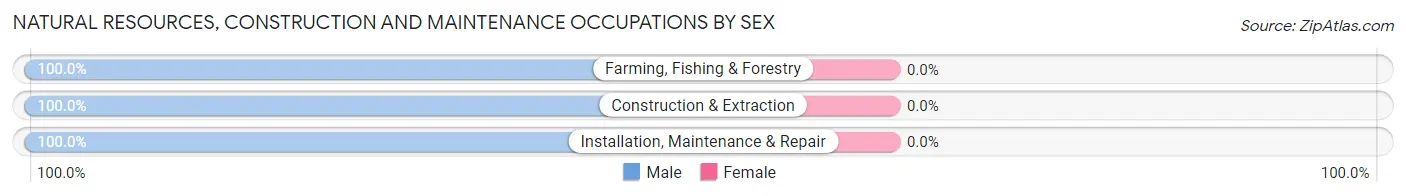
| Occupation | Male | Female |
| Farming, Fishing & Forestry | 43 (100.0%) | 0 (0.0%) |
| Construction & Extraction | 244 (100.0%) | 0 (0.0%) |
| Installation, Maintenance & Repair | 257 (100.0%) | 0 (0.0%) |
| Total (Category) | 544 (100.0%) | 0 (0.0%) |
| Total (Overall) | 2,040 (52.7%) | 1,828 (47.3%) |
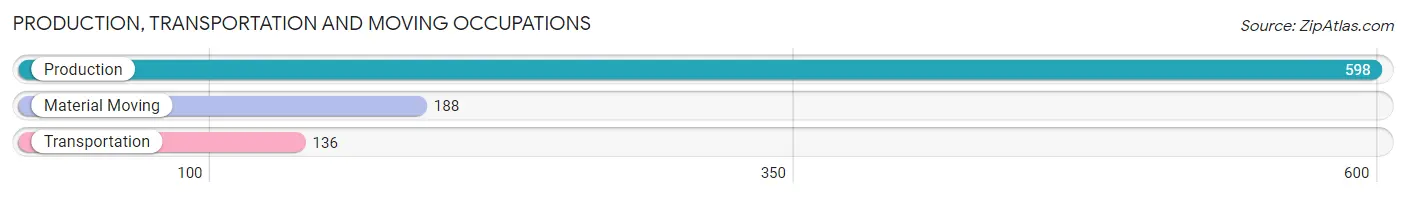
Production, Transportation and Moving Occupations
The most common Production, Transportation and Moving occupations in Coosa County are Production (598 | 15.5%), Material Moving (188 | 4.9%), and Transportation (136 | 3.5%).
Production, Transportation and Moving Occupations by Sex
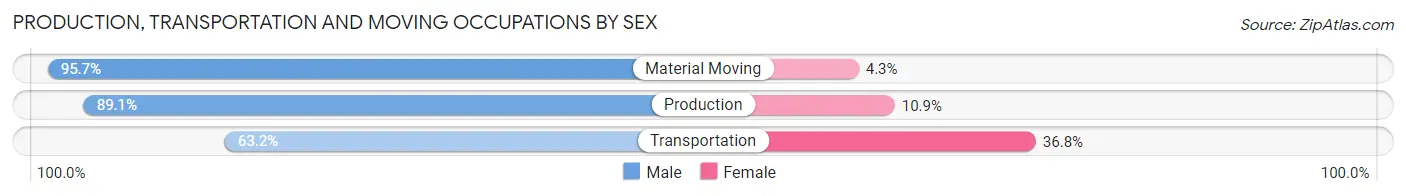
| Occupation | Male | Female |
| Production | 533 (89.1%) | 65 (10.9%) |
| Transportation | 86 (63.2%) | 50 (36.8%) |
| Material Moving | 180 (95.7%) | 8 (4.3%) |
| Total (Category) | 799 (86.7%) | 123 (13.3%) |
| Total (Overall) | 2,040 (52.7%) | 1,828 (47.3%) |
Employment Industries by Sex in Coosa County
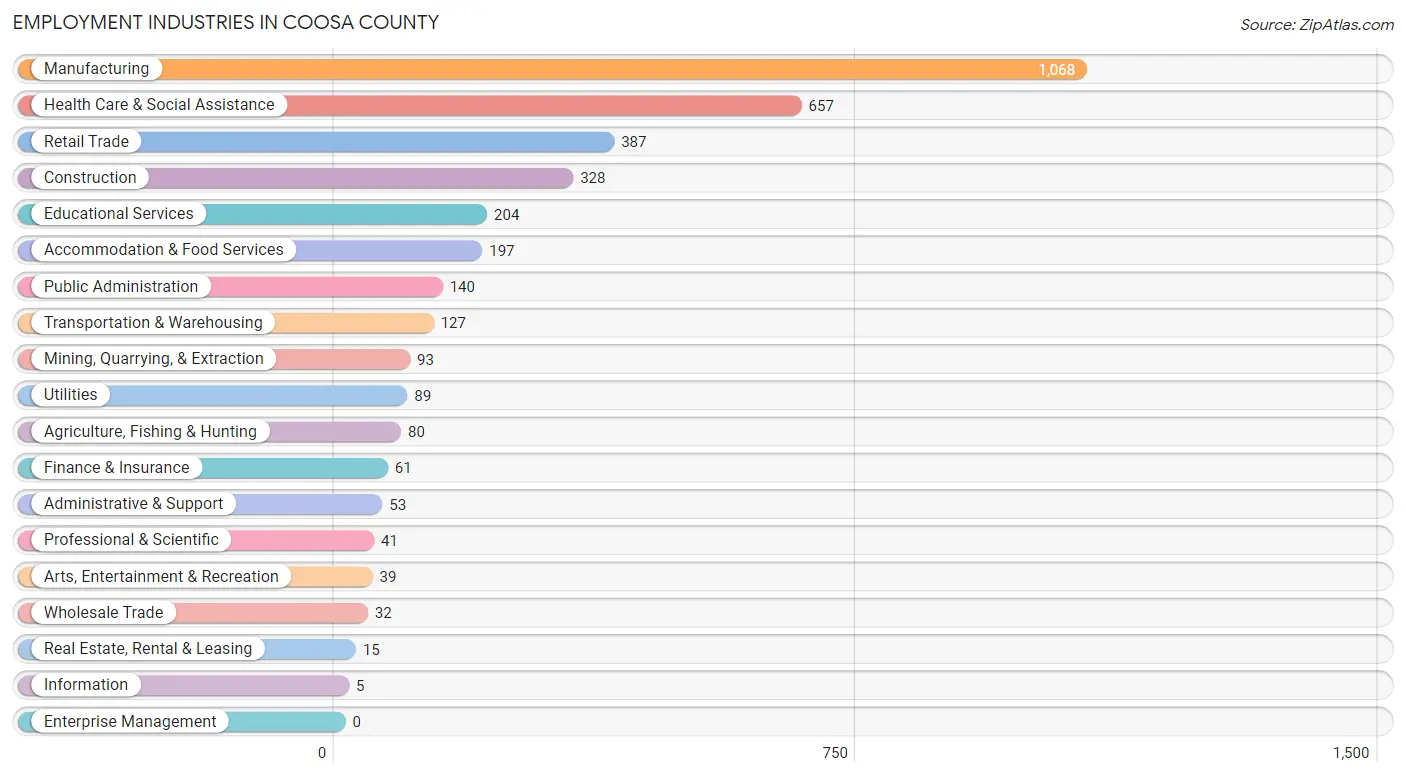
Employment Industries in Coosa County
The major employment industries in Coosa County include Manufacturing (1,068 | 27.6%), Health Care & Social Assistance (657 | 17.0%), Retail Trade (387 | 10.0%), Construction (328 | 8.5%), and Educational Services (204 | 5.3%).
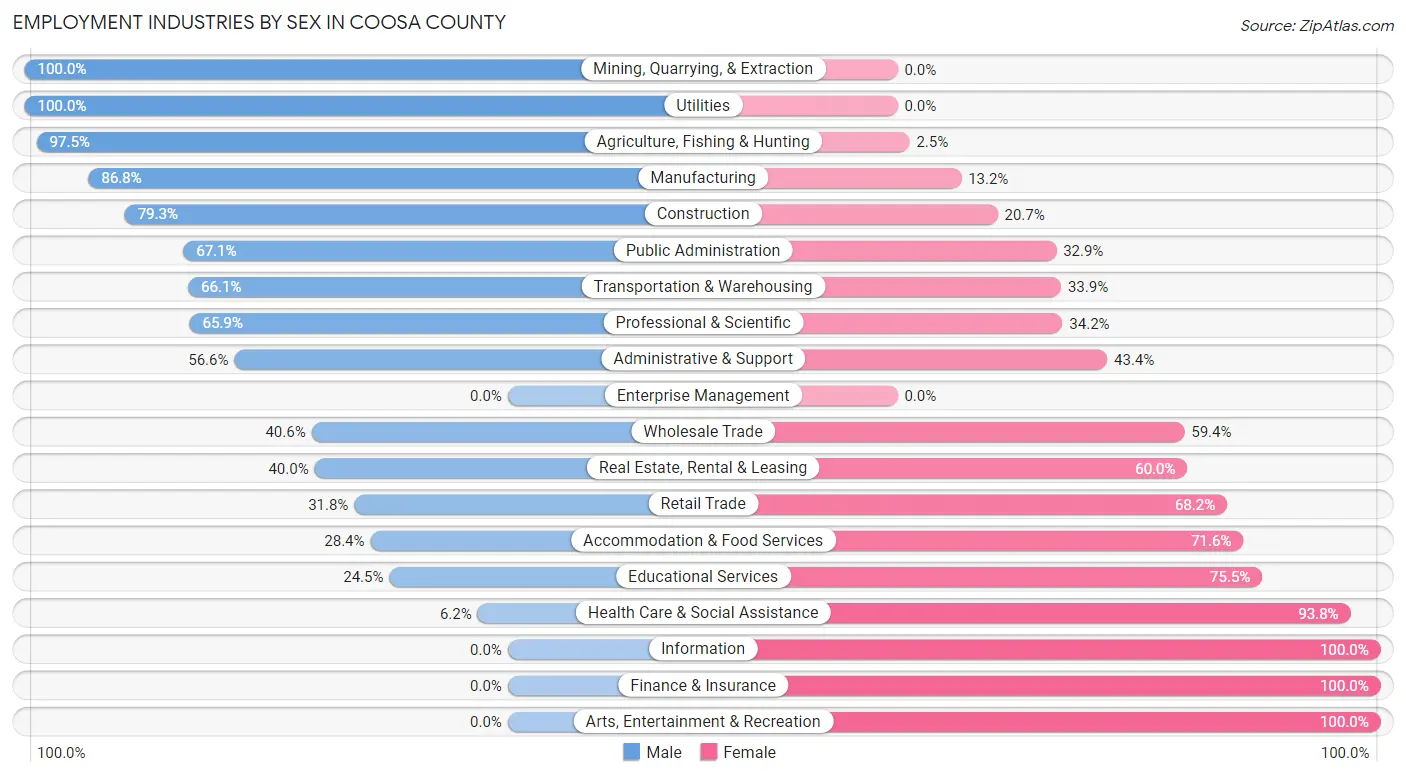
Employment Industries by Sex in Coosa County
The Coosa County industries that see more men than women are Mining, Quarrying, & Extraction (100.0%), Utilities (100.0%), and Agriculture, Fishing & Hunting (97.5%), whereas the industries that tend to have a higher number of women are Information (100.0%), Finance & Insurance (100.0%), and Arts, Entertainment & Recreation (100.0%).
| Industry | Male | Female |
| Agriculture, Fishing & Hunting | 78 (97.5%) | 2 (2.5%) |
| Mining, Quarrying, & Extraction | 93 (100.0%) | 0 (0.0%) |
| Construction | 260 (79.3%) | 68 (20.7%) |
| Manufacturing | 927 (86.8%) | 141 (13.2%) |
| Wholesale Trade | 13 (40.6%) | 19 (59.4%) |
| Retail Trade | 123 (31.8%) | 264 (68.2%) |
| Transportation & Warehousing | 84 (66.1%) | 43 (33.9%) |
| Utilities | 89 (100.0%) | 0 (0.0%) |
| Information | 0 (0.0%) | 5 (100.0%) |
| Finance & Insurance | 0 (0.0%) | 61 (100.0%) |
| Real Estate, Rental & Leasing | 6 (40.0%) | 9 (60.0%) |
| Professional & Scientific | 27 (65.8%) | 14 (34.2%) |
| Enterprise Management | 0 (0.0%) | 0 (0.0%) |
| Administrative & Support | 30 (56.6%) | 23 (43.4%) |
| Educational Services | 50 (24.5%) | 154 (75.5%) |
| Health Care & Social Assistance | 41 (6.2%) | 616 (93.8%) |
| Arts, Entertainment & Recreation | 0 (0.0%) | 39 (100.0%) |
| Accommodation & Food Services | 56 (28.4%) | 141 (71.6%) |
| Public Administration | 94 (67.1%) | 46 (32.9%) |
| Total | 2,040 (52.7%) | 1,828 (47.3%) |
Education in Coosa County
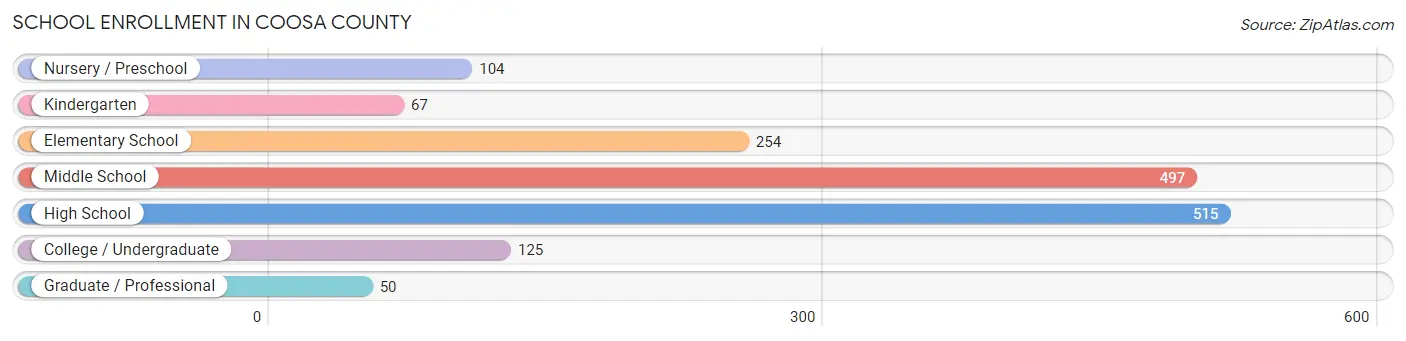
School Enrollment in Coosa County
The most common levels of schooling among the 1,612 students in Coosa County are high school (515 | 32.0%), middle school (497 | 30.8%), and elementary school (254 | 15.8%).
| School Level | # Students | % Students |
| Nursery / Preschool | 104 | 6.5% |
| Kindergarten | 67 | 4.2% |
| Elementary School | 254 | 15.8% |
| Middle School | 497 | 30.8% |
| High School | 515 | 32.0% |
| College / Undergraduate | 125 | 7.7% |
| Graduate / Professional | 50 | 3.1% |
| Total | 1,612 | 100.0% |
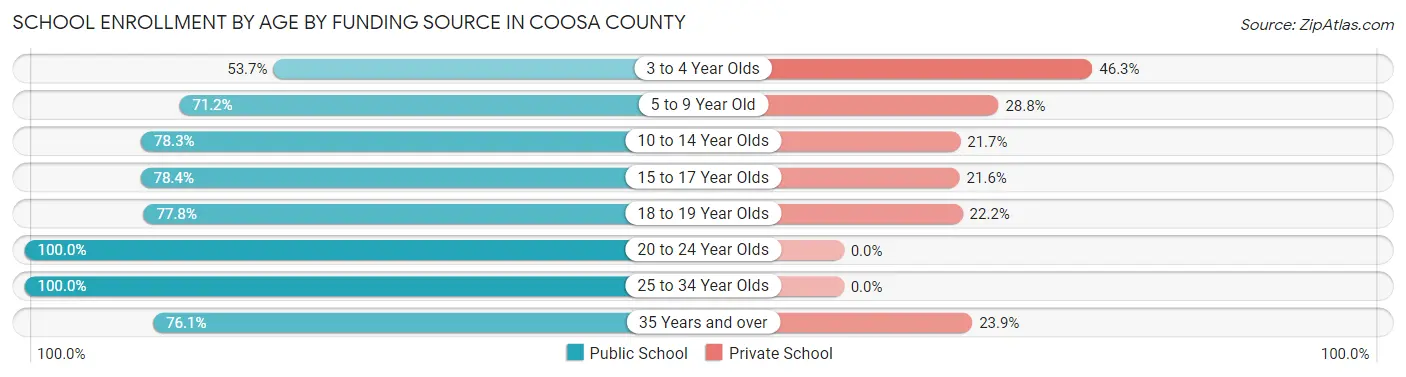
School Enrollment by Age by Funding Source in Coosa County
Out of a total of 1,612 students who are enrolled in schools in Coosa County, 379 (23.5%) attend a private institution, while the remaining 1,233 (76.5%) are enrolled in public schools. The age group of 3 to 4 year olds has the highest likelihood of being enrolled in private schools, with 44 (46.3% in the age bracket) enrolled. Conversely, the age group of 20 to 24 year olds has the lowest likelihood of being enrolled in a private school, with 64 (100.0% in the age bracket) attending a public institution.
| Age Bracket | Public School | Private School |
| 3 to 4 Year Olds | 51 (53.7%) | 44 (46.3%) |
| 5 to 9 Year Old | 195 (71.2%) | 79 (28.8%) |
| 10 to 14 Year Olds | 454 (78.3%) | 126 (21.7%) |
| 15 to 17 Year Olds | 254 (78.4%) | 70 (21.6%) |
| 18 to 19 Year Olds | 151 (77.8%) | 43 (22.2%) |
| 20 to 24 Year Olds | 64 (100.0%) | 0 (0.0%) |
| 25 to 34 Year Olds | 10 (100.0%) | 0 (0.0%) |
| 35 Years and over | 54 (76.1%) | 17 (23.9%) |
| Total | 1,233 (76.5%) | 379 (23.5%) |
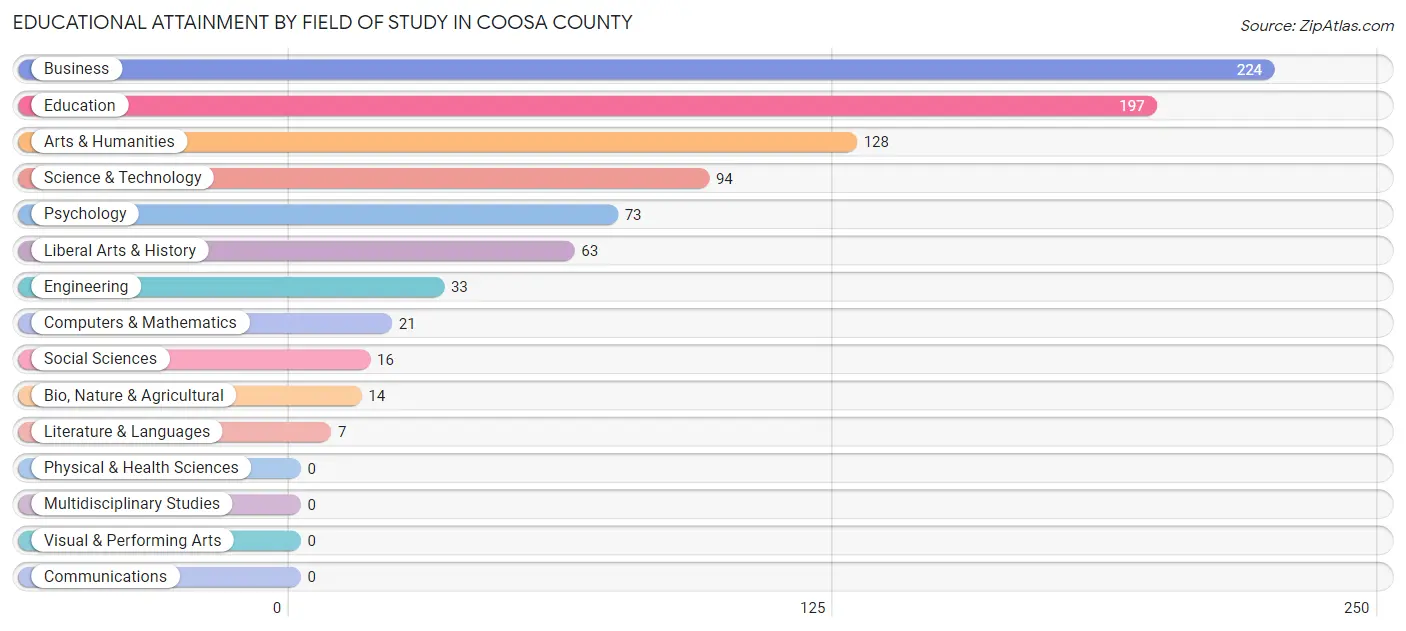
Educational Attainment by Field of Study in Coosa County
Business (224 | 25.8%), education (197 | 22.6%), arts & humanities (128 | 14.7%), science & technology (94 | 10.8%), and psychology (73 | 8.4%) are the most common fields of study among 870 individuals in Coosa County who have obtained a bachelor's degree or higher.
| Field of Study | # Graduates | % Graduates |
| Computers & Mathematics | 21 | 2.4% |
| Bio, Nature & Agricultural | 14 | 1.6% |
| Physical & Health Sciences | 0 | 0.0% |
| Psychology | 73 | 8.4% |
| Social Sciences | 16 | 1.8% |
| Engineering | 33 | 3.8% |
| Multidisciplinary Studies | 0 | 0.0% |
| Science & Technology | 94 | 10.8% |
| Business | 224 | 25.8% |
| Education | 197 | 22.6% |
| Literature & Languages | 7 | 0.8% |
| Liberal Arts & History | 63 | 7.2% |
| Visual & Performing Arts | 0 | 0.0% |
| Communications | 0 | 0.0% |
| Arts & Humanities | 128 | 14.7% |
| Total | 870 | 100.0% |
Transportation & Commute in Coosa County
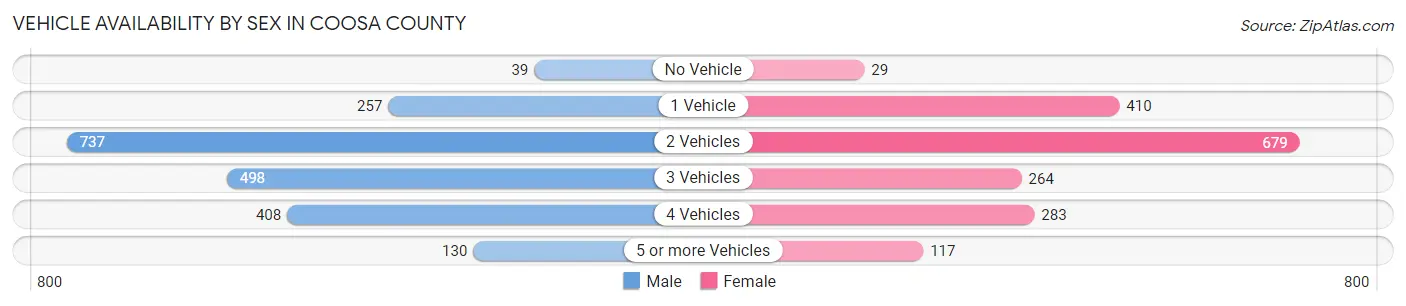
Vehicle Availability by Sex in Coosa County
The most prevalent vehicle ownership categories in Coosa County are males with 2 vehicles (737, accounting for 35.6%) and females with 2 vehicles (679, making up 41.4%).
| Vehicles Available | Male | Female |
| No Vehicle | 39 (1.9%) | 29 (1.6%) |
| 1 Vehicle | 257 (12.4%) | 410 (23.0%) |
| 2 Vehicles | 737 (35.6%) | 679 (38.1%) |
| 3 Vehicles | 498 (24.1%) | 264 (14.8%) |
| 4 Vehicles | 408 (19.7%) | 283 (15.9%) |
| 5 or more Vehicles | 130 (6.3%) | 117 (6.6%) |
| Total | 2,069 (100.0%) | 1,782 (100.0%) |
Commute Time in Coosa County
The most frequently occuring commute durations in Coosa County are 20 to 24 minutes (661 commuters, 18.3%), 15 to 19 minutes (511 commuters, 14.1%), and 30 to 34 minutes (482 commuters, 13.3%).
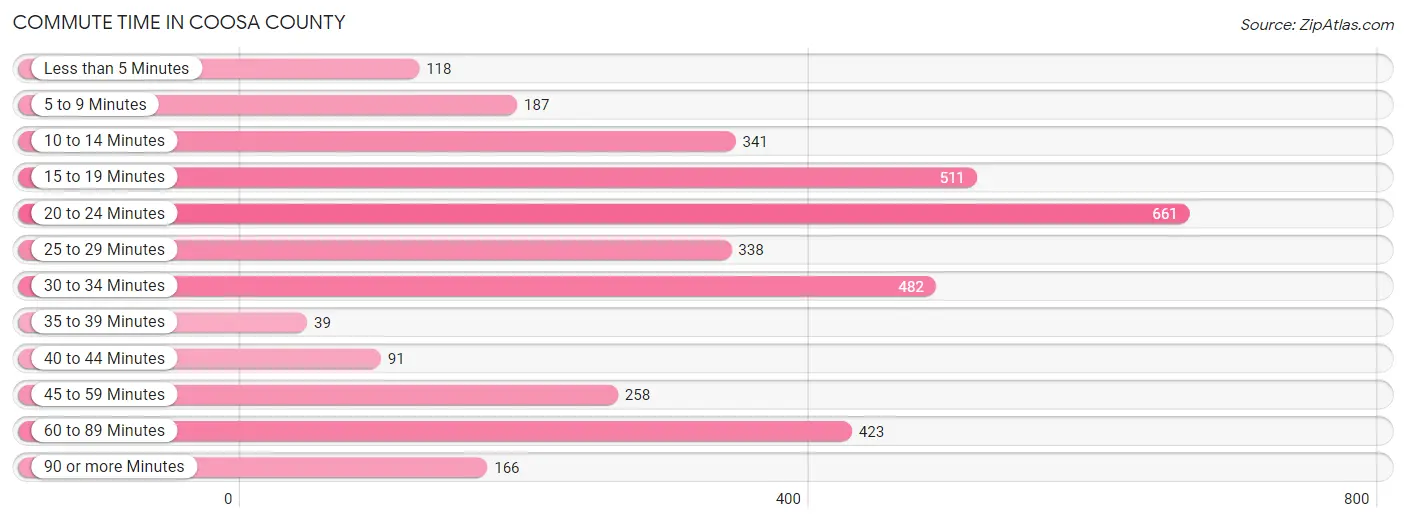
| Commute Time | # Commuters | % Commuters |
| Less than 5 Minutes | 118 | 3.3% |
| 5 to 9 Minutes | 187 | 5.2% |
| 10 to 14 Minutes | 341 | 9.4% |
| 15 to 19 Minutes | 511 | 14.1% |
| 20 to 24 Minutes | 661 | 18.3% |
| 25 to 29 Minutes | 338 | 9.3% |
| 30 to 34 Minutes | 482 | 13.3% |
| 35 to 39 Minutes | 39 | 1.1% |
| 40 to 44 Minutes | 91 | 2.5% |
| 45 to 59 Minutes | 258 | 7.1% |
| 60 to 89 Minutes | 423 | 11.7% |
| 90 or more Minutes | 166 | 4.6% |
Commute Time by Sex in Coosa County
The most common commute times in Coosa County are 15 to 19 minutes (311 commuters, 15.4%) for males and 20 to 24 minutes (418 commuters, 26.1%) for females.
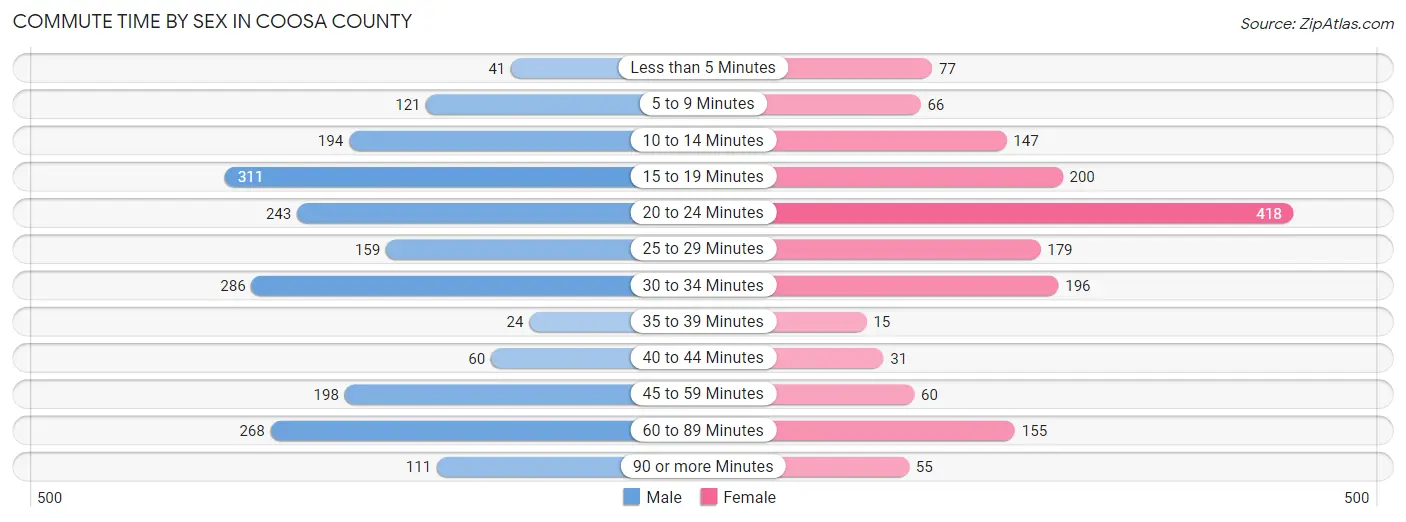
| Commute Time | Male | Female |
| Less than 5 Minutes | 41 (2.0%) | 77 (4.8%) |
| 5 to 9 Minutes | 121 (6.0%) | 66 (4.1%) |
| 10 to 14 Minutes | 194 (9.6%) | 147 (9.2%) |
| 15 to 19 Minutes | 311 (15.4%) | 200 (12.5%) |
| 20 to 24 Minutes | 243 (12.0%) | 418 (26.1%) |
| 25 to 29 Minutes | 159 (7.9%) | 179 (11.2%) |
| 30 to 34 Minutes | 286 (14.2%) | 196 (12.3%) |
| 35 to 39 Minutes | 24 (1.2%) | 15 (0.9%) |
| 40 to 44 Minutes | 60 (3.0%) | 31 (1.9%) |
| 45 to 59 Minutes | 198 (9.8%) | 60 (3.7%) |
| 60 to 89 Minutes | 268 (13.3%) | 155 (9.7%) |
| 90 or more Minutes | 111 (5.5%) | 55 (3.4%) |
Time of Departure to Work by Sex in Coosa County
The most frequent times of departure to work in Coosa County are 12:00 AM to 4:59 AM (432, 21.4%) for males and 12:00 PM to 3:59 PM (231, 14.4%) for females.
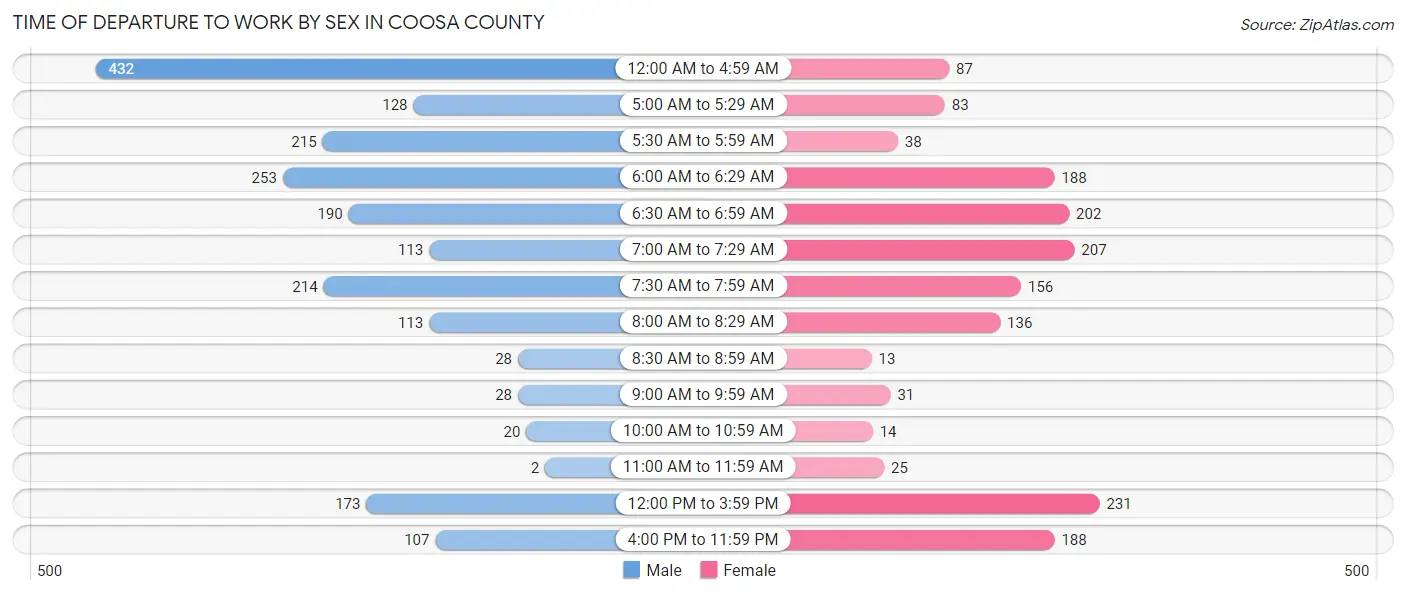
| Time of Departure | Male | Female |
| 12:00 AM to 4:59 AM | 432 (21.4%) | 87 (5.4%) |
| 5:00 AM to 5:29 AM | 128 (6.4%) | 83 (5.2%) |
| 5:30 AM to 5:59 AM | 215 (10.7%) | 38 (2.4%) |
| 6:00 AM to 6:29 AM | 253 (12.6%) | 188 (11.8%) |
| 6:30 AM to 6:59 AM | 190 (9.4%) | 202 (12.6%) |
| 7:00 AM to 7:29 AM | 113 (5.6%) | 207 (13.0%) |
| 7:30 AM to 7:59 AM | 214 (10.6%) | 156 (9.8%) |
| 8:00 AM to 8:29 AM | 113 (5.6%) | 136 (8.5%) |
| 8:30 AM to 8:59 AM | 28 (1.4%) | 13 (0.8%) |
| 9:00 AM to 9:59 AM | 28 (1.4%) | 31 (1.9%) |
| 10:00 AM to 10:59 AM | 20 (1.0%) | 14 (0.9%) |
| 11:00 AM to 11:59 AM | 2 (0.1%) | 25 (1.6%) |
| 12:00 PM to 3:59 PM | 173 (8.6%) | 231 (14.4%) |
| 4:00 PM to 11:59 PM | 107 (5.3%) | 188 (11.8%) |
| Total | 2,016 (100.0%) | 1,599 (100.0%) |
Housing Occupancy in Coosa County
Occupancy by Ownership in Coosa County
Of the total 3,999 dwellings in Coosa County, owner-occupied units account for 3,249 (81.2%), while renter-occupied units make up 750 (18.8%).
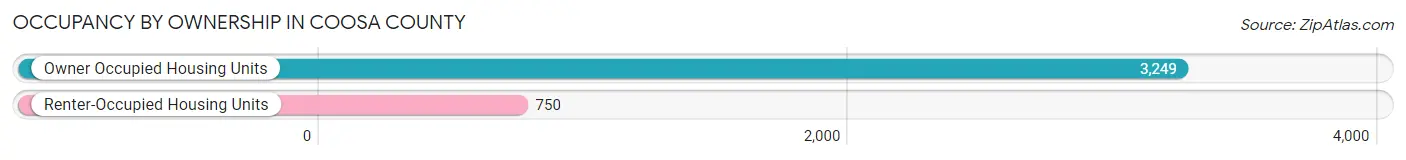
| Occupancy | # Housing Units | % Housing Units |
| Owner Occupied Housing Units | 3,249 | 81.2% |
| Renter-Occupied Housing Units | 750 | 18.8% |
| Total Occupied Housing Units | 3,999 | 100.0% |
Occupancy by Household Size in Coosa County
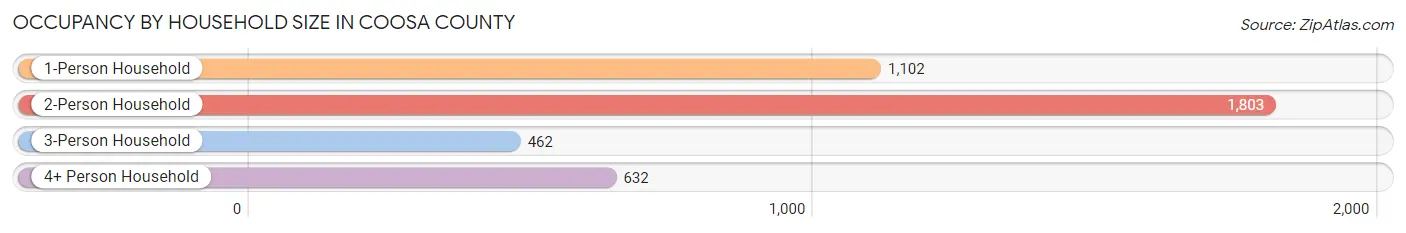
| Household Size | # Housing Units | % Housing Units |
| 1-Person Household | 1,102 | 27.6% |
| 2-Person Household | 1,803 | 45.1% |
| 3-Person Household | 462 | 11.6% |
| 4+ Person Household | 632 | 15.8% |
| Total Housing Units | 3,999 | 100.0% |
Occupancy by Ownership by Household Size in Coosa County
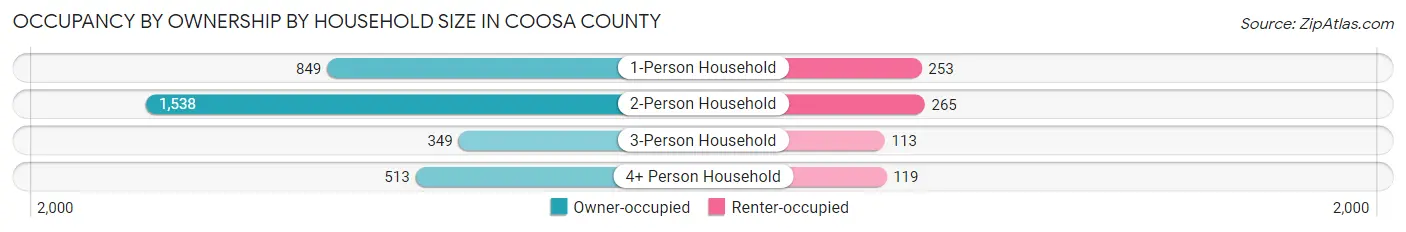
| Household Size | Owner-occupied | Renter-occupied |
| 1-Person Household | 849 (77.0%) | 253 (23.0%) |
| 2-Person Household | 1,538 (85.3%) | 265 (14.7%) |
| 3-Person Household | 349 (75.5%) | 113 (24.5%) |
| 4+ Person Household | 513 (81.2%) | 119 (18.8%) |
| Total Housing Units | 3,249 (81.2%) | 750 (18.8%) |
Occupancy by Educational Attainment in Coosa County

| Household Size | Owner-occupied | Renter-occupied |
| Less than High School | 395 (65.8%) | 205 (34.2%) |
| High School Diploma | 1,344 (82.0%) | 295 (18.0%) |
| College/Associate Degree | 1,091 (84.8%) | 195 (15.2%) |
| Bachelor's Degree or higher | 419 (88.4%) | 55 (11.6%) |
Occupancy by Age of Householder in Coosa County
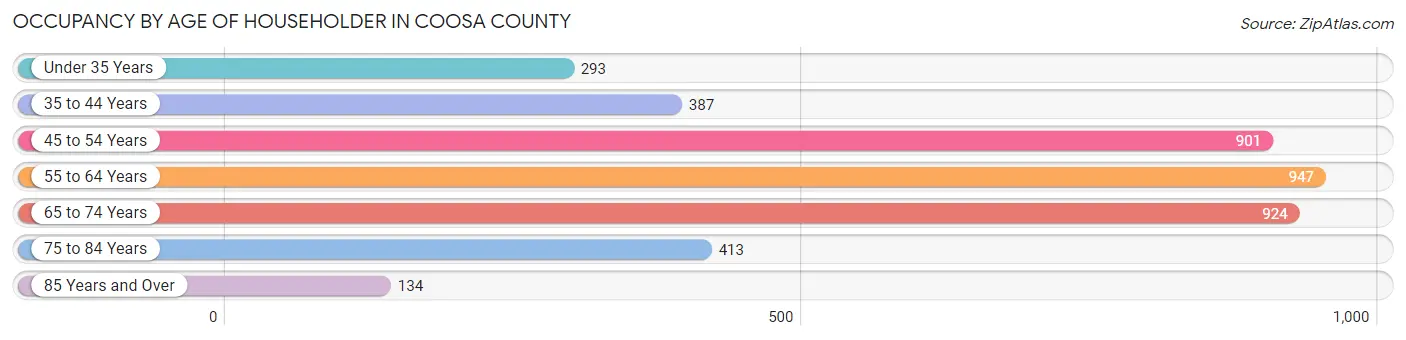
| Age Bracket | # Households | % Households |
| Under 35 Years | 293 | 7.3% |
| 35 to 44 Years | 387 | 9.7% |
| 45 to 54 Years | 901 | 22.5% |
| 55 to 64 Years | 947 | 23.7% |
| 65 to 74 Years | 924 | 23.1% |
| 75 to 84 Years | 413 | 10.3% |
| 85 Years and Over | 134 | 3.4% |
| Total | 3,999 | 100.0% |
Housing Finances in Coosa County
Median Income by Occupancy in Coosa County
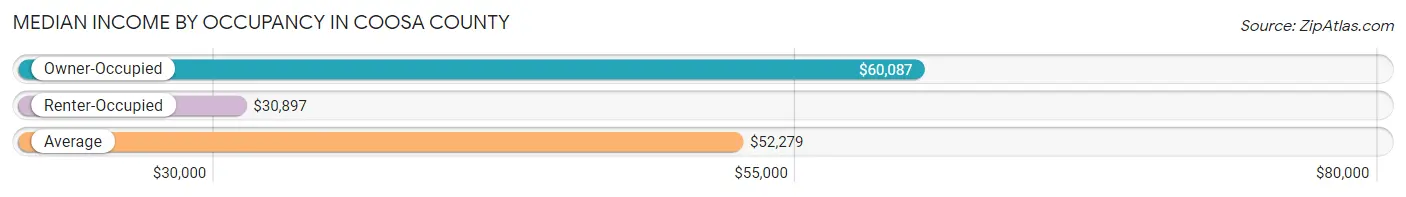
| Occupancy Type | # Households | Median Income |
| Owner-Occupied | 3,249 (81.2%) | $60,087 |
| Renter-Occupied | 750 (18.8%) | $30,897 |
| Average | 3,999 (100.0%) | $52,279 |
Occupancy by Householder Income Bracket in Coosa County
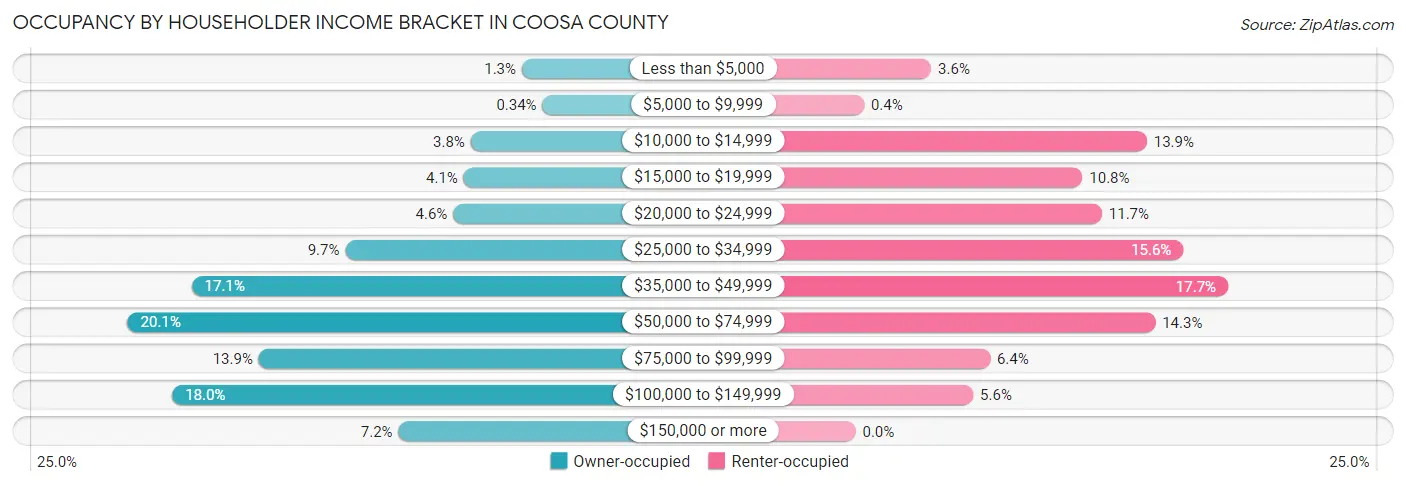
| Income Bracket | Owner-occupied | Renter-occupied |
| Less than $5,000 | 43 (1.3%) | 27 (3.6%) |
| $5,000 to $9,999 | 11 (0.3%) | 3 (0.4%) |
| $10,000 to $14,999 | 122 (3.8%) | 104 (13.9%) |
| $15,000 to $19,999 | 133 (4.1%) | 81 (10.8%) |
| $20,000 to $24,999 | 149 (4.6%) | 88 (11.7%) |
| $25,000 to $34,999 | 316 (9.7%) | 117 (15.6%) |
| $35,000 to $49,999 | 554 (17.1%) | 133 (17.7%) |
| $50,000 to $74,999 | 653 (20.1%) | 107 (14.3%) |
| $75,000 to $99,999 | 450 (13.9%) | 48 (6.4%) |
| $100,000 to $149,999 | 584 (18.0%) | 42 (5.6%) |
| $150,000 or more | 234 (7.2%) | 0 (0.0%) |
| Total | 3,249 (100.0%) | 750 (100.0%) |
Monthly Housing Cost Tiers in Coosa County
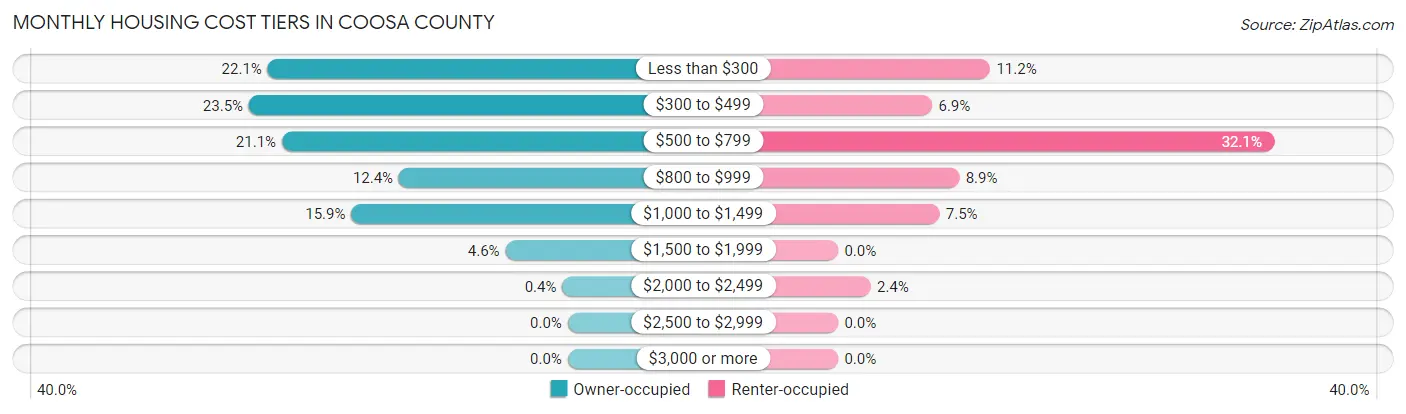
| Monthly Cost | Owner-occupied | Renter-occupied |
| Less than $300 | 718 (22.1%) | 84 (11.2%) |
| $300 to $499 | 763 (23.5%) | 52 (6.9%) |
| $500 to $799 | 684 (21.0%) | 241 (32.1%) |
| $800 to $999 | 404 (12.4%) | 67 (8.9%) |
| $1,000 to $1,499 | 518 (15.9%) | 56 (7.5%) |
| $1,500 to $1,999 | 149 (4.6%) | 0 (0.0%) |
| $2,000 to $2,499 | 13 (0.4%) | 18 (2.4%) |
| $2,500 to $2,999 | 0 (0.0%) | 0 (0.0%) |
| $3,000 or more | 0 (0.0%) | 0 (0.0%) |
| Total | 3,249 (100.0%) | 750 (100.0%) |
Physical Housing Characteristics in Coosa County
Housing Structures in Coosa County
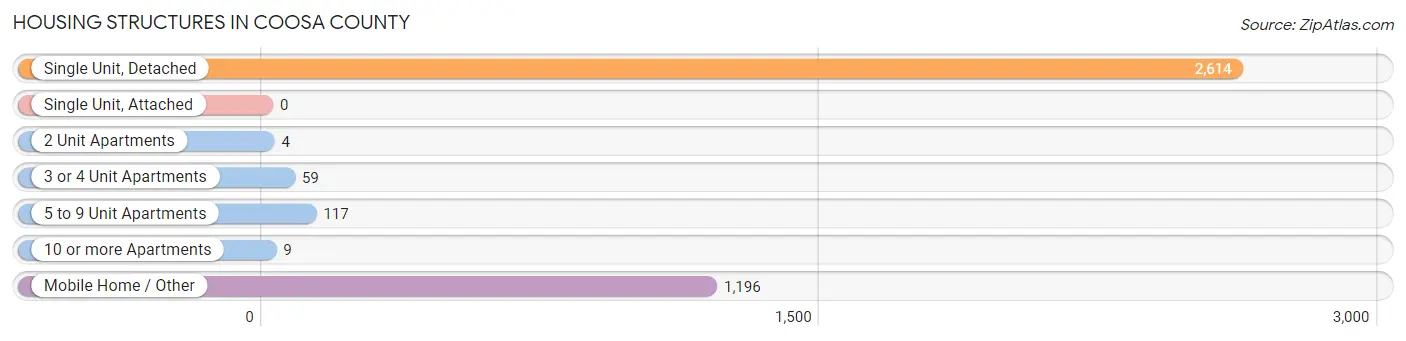
| Structure Type | # Housing Units | % Housing Units |
| Single Unit, Detached | 2,614 | 65.4% |
| Single Unit, Attached | 0 | 0.0% |
| 2 Unit Apartments | 4 | 0.1% |
| 3 or 4 Unit Apartments | 59 | 1.5% |
| 5 to 9 Unit Apartments | 117 | 2.9% |
| 10 or more Apartments | 9 | 0.2% |
| Mobile Home / Other | 1,196 | 29.9% |
| Total | 3,999 | 100.0% |
Housing Structures by Occupancy in Coosa County
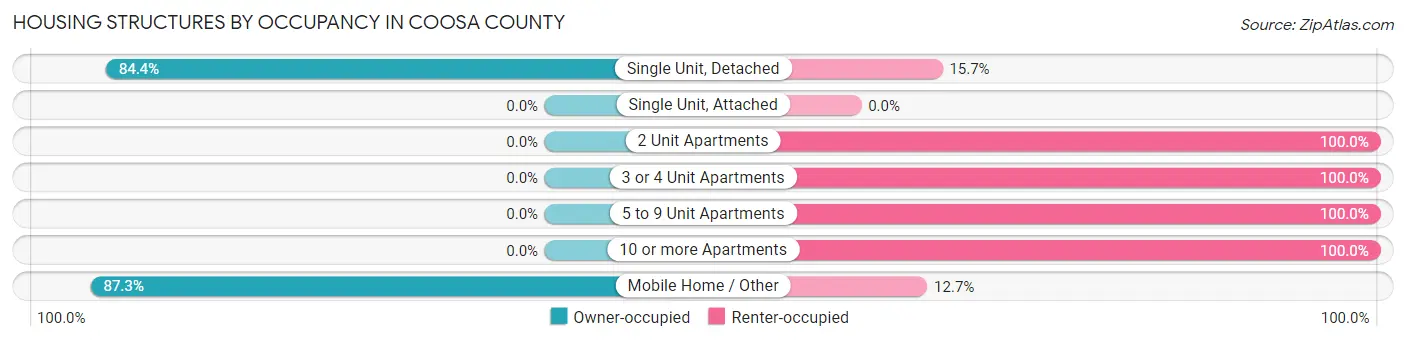
| Structure Type | Owner-occupied | Renter-occupied |
| Single Unit, Detached | 2,205 (84.4%) | 409 (15.7%) |
| Single Unit, Attached | 0 (0.0%) | 0 (0.0%) |
| 2 Unit Apartments | 0 (0.0%) | 4 (100.0%) |
| 3 or 4 Unit Apartments | 0 (0.0%) | 59 (100.0%) |
| 5 to 9 Unit Apartments | 0 (0.0%) | 117 (100.0%) |
| 10 or more Apartments | 0 (0.0%) | 9 (100.0%) |
| Mobile Home / Other | 1,044 (87.3%) | 152 (12.7%) |
| Total | 3,249 (81.2%) | 750 (18.8%) |
Housing Structures by Number of Rooms in Coosa County
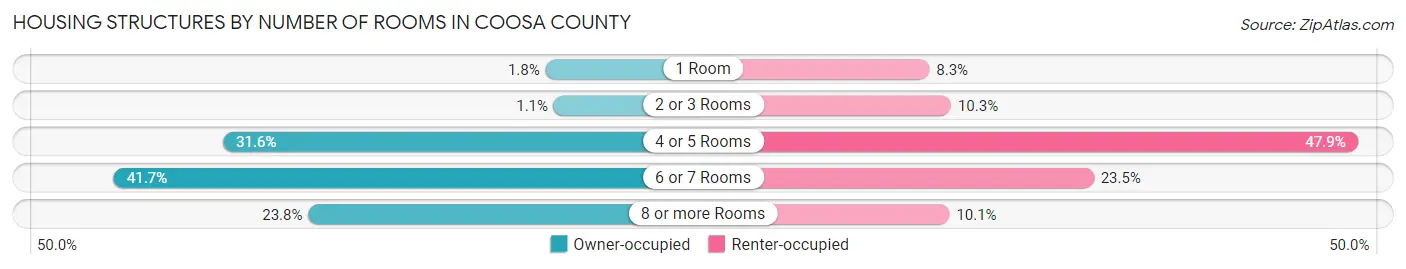
| Number of Rooms | Owner-occupied | Renter-occupied |
| 1 Room | 59 (1.8%) | 62 (8.3%) |
| 2 or 3 Rooms | 34 (1.1%) | 77 (10.3%) |
| 4 or 5 Rooms | 1,028 (31.6%) | 359 (47.9%) |
| 6 or 7 Rooms | 1,356 (41.7%) | 176 (23.5%) |
| 8 or more Rooms | 772 (23.8%) | 76 (10.1%) |
| Total | 3,249 (100.0%) | 750 (100.0%) |
Housing Structure by Heating Type in Coosa County
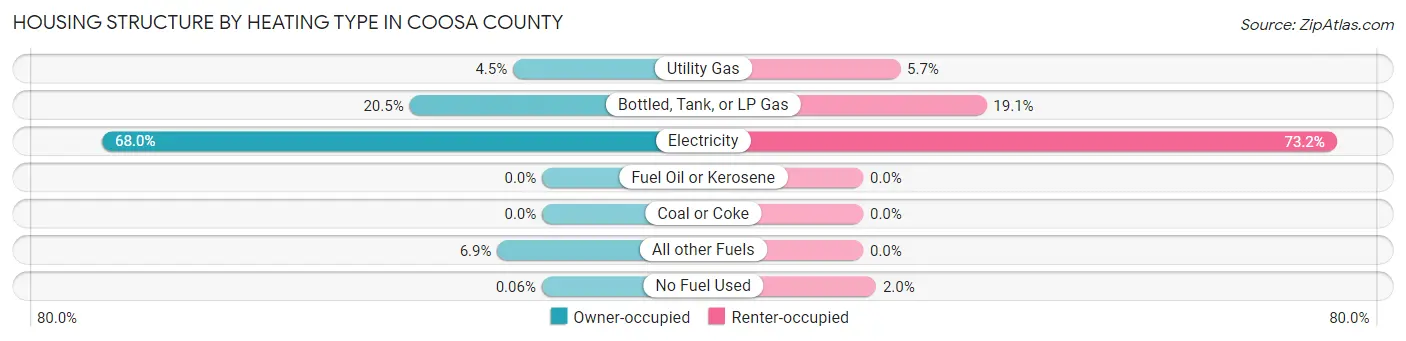
| Heating Type | Owner-occupied | Renter-occupied |
| Utility Gas | 146 (4.5%) | 43 (5.7%) |
| Bottled, Tank, or LP Gas | 666 (20.5%) | 143 (19.1%) |
| Electricity | 2,210 (68.0%) | 549 (73.2%) |
| Fuel Oil or Kerosene | 0 (0.0%) | 0 (0.0%) |
| Coal or Coke | 0 (0.0%) | 0 (0.0%) |
| All other Fuels | 225 (6.9%) | 0 (0.0%) |
| No Fuel Used | 2 (0.1%) | 15 (2.0%) |
| Total | 3,249 (100.0%) | 750 (100.0%) |
Household Vehicle Usage in Coosa County
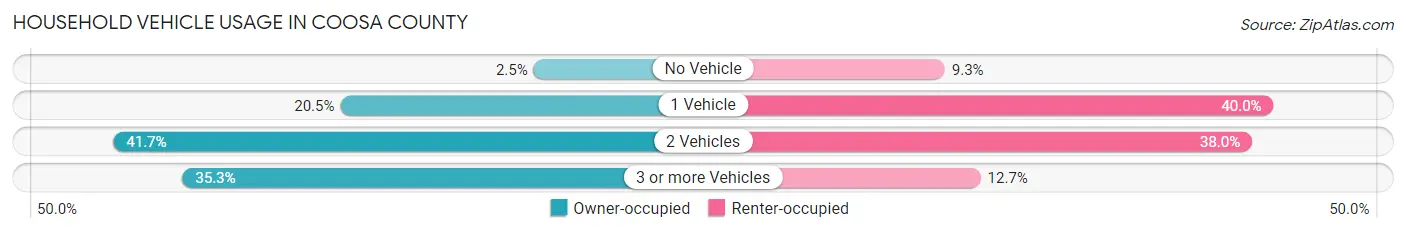
| Vehicles per Household | Owner-occupied | Renter-occupied |
| No Vehicle | 81 (2.5%) | 70 (9.3%) |
| 1 Vehicle | 667 (20.5%) | 300 (40.0%) |
| 2 Vehicles | 1,355 (41.7%) | 285 (38.0%) |
| 3 or more Vehicles | 1,146 (35.3%) | 95 (12.7%) |
| Total | 3,249 (100.0%) | 750 (100.0%) |
Real Estate & Mortgages in Coosa County
Real Estate and Mortgage Overview in Coosa County
| Characteristic | Without Mortgage | With Mortgage |
| Housing Units | 2,073 | 1,176 |
| Median Property Value | $98,800 | $126,400 |
| Median Household Income | $51,138 | $124 |
| Monthly Housing Costs | $395 | $0 |
| Real Estate Taxes | $235 | $295 |
Property Value by Mortgage Status in Coosa County
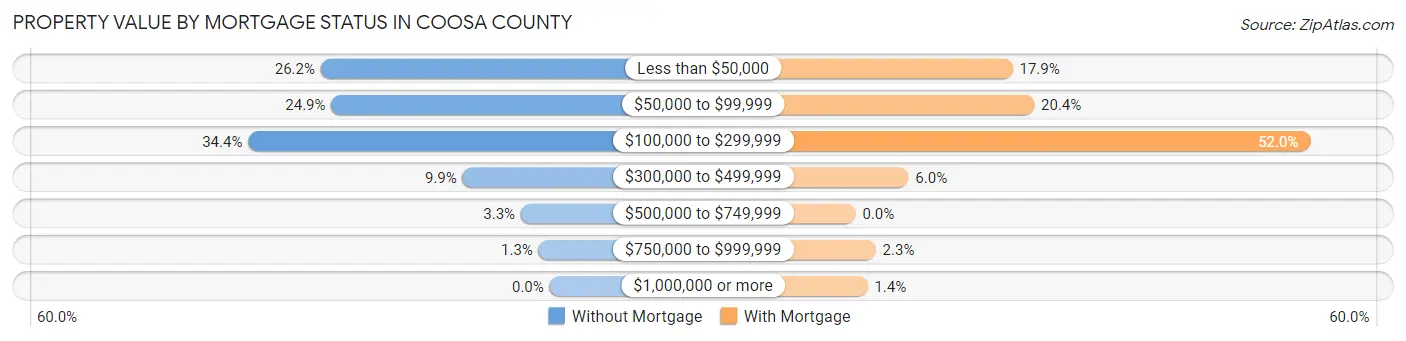
| Property Value | Without Mortgage | With Mortgage |
| Less than $50,000 | 542 (26.2%) | 211 (17.9%) |
| $50,000 to $99,999 | 517 (24.9%) | 240 (20.4%) |
| $100,000 to $299,999 | 714 (34.4%) | 611 (52.0%) |
| $300,000 to $499,999 | 206 (9.9%) | 71 (6.0%) |
| $500,000 to $749,999 | 68 (3.3%) | 0 (0.0%) |
| $750,000 to $999,999 | 26 (1.3%) | 27 (2.3%) |
| $1,000,000 or more | 0 (0.0%) | 16 (1.4%) |
| Total | 2,073 (100.0%) | 1,176 (100.0%) |
Household Income by Mortgage Status in Coosa County
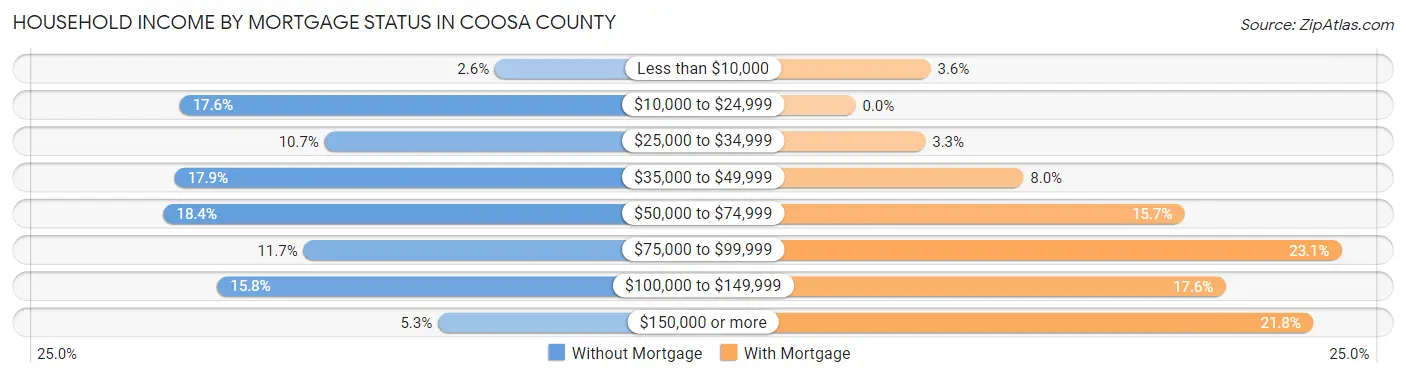
| Household Income | Without Mortgage | With Mortgage |
| Less than $10,000 | 54 (2.6%) | 42 (3.6%) |
| $10,000 to $24,999 | 365 (17.6%) | 0 (0.0%) |
| $25,000 to $34,999 | 222 (10.7%) | 39 (3.3%) |
| $35,000 to $49,999 | 370 (17.8%) | 94 (8.0%) |
| $50,000 to $74,999 | 381 (18.4%) | 184 (15.7%) |
| $75,000 to $99,999 | 243 (11.7%) | 272 (23.1%) |
| $100,000 to $149,999 | 328 (15.8%) | 207 (17.6%) |
| $150,000 or more | 110 (5.3%) | 256 (21.8%) |
| Total | 2,073 (100.0%) | 1,176 (100.0%) |
Property Value to Household Income Ratio in Coosa County
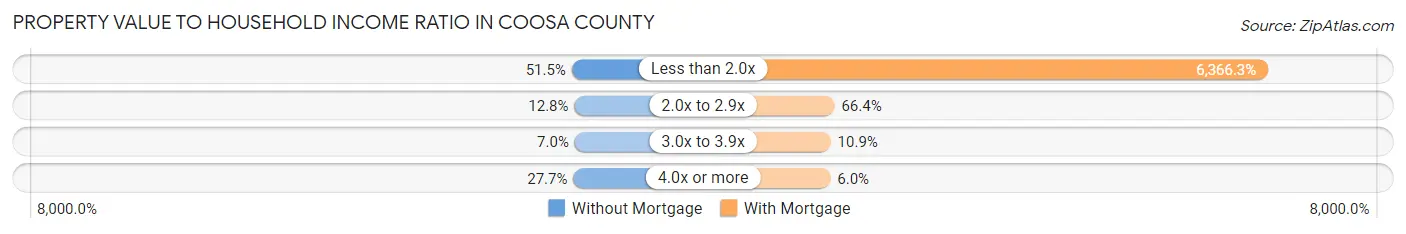
| Value-to-Income Ratio | Without Mortgage | With Mortgage |
| Less than 2.0x | 1,067 (51.5%) | 74,868 (6,366.3%) |
| 2.0x to 2.9x | 265 (12.8%) | 781 (66.4%) |
| 3.0x to 3.9x | 144 (7.0%) | 128 (10.9%) |
| 4.0x or more | 574 (27.7%) | 71 (6.0%) |
| Total | 2,073 (100.0%) | 1,176 (100.0%) |
Real Estate Taxes by Mortgage Status in Coosa County
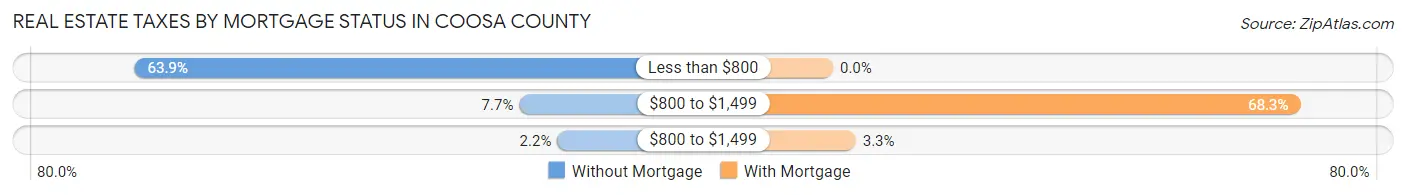
| Property Taxes | Without Mortgage | With Mortgage |
| Less than $800 | 1,325 (63.9%) | 0 (0.0%) |
| $800 to $1,499 | 160 (7.7%) | 803 (68.3%) |
| $800 to $1,499 | 45 (2.2%) | 39 (3.3%) |
| Total | 2,073 (100.0%) | 1,176 (100.0%) |
Health & Disability in Coosa County
Health Insurance Coverage by Age in Coosa County
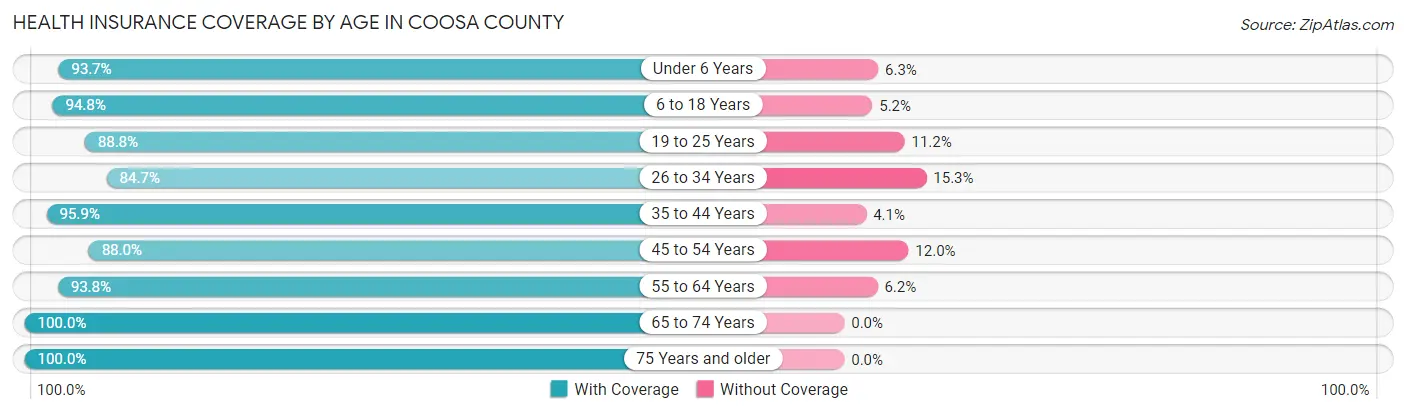
| Age Bracket | With Coverage | Without Coverage |
| Under 6 Years | 461 (93.7%) | 31 (6.3%) |
| 6 to 18 Years | 1,199 (94.8%) | 66 (5.2%) |
| 19 to 25 Years | 537 (88.8%) | 68 (11.2%) |
| 26 to 34 Years | 703 (84.7%) | 127 (15.3%) |
| 35 to 44 Years | 962 (95.9%) | 41 (4.1%) |
| 45 to 54 Years | 1,192 (88.0%) | 162 (12.0%) |
| 55 to 64 Years | 1,772 (93.8%) | 117 (6.2%) |
| 65 to 74 Years | 1,479 (100.0%) | 0 (0.0%) |
| 75 Years and older | 1,002 (100.0%) | 0 (0.0%) |
| Total | 9,307 (93.8%) | 612 (6.2%) |
Health Insurance Coverage by Citizenship Status in Coosa County
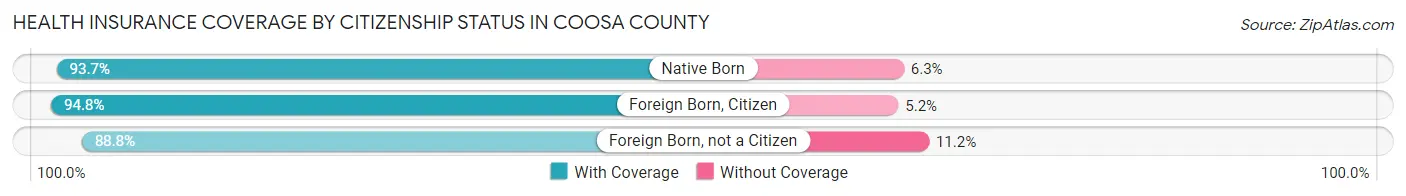
| Citizenship Status | With Coverage | Without Coverage |
| Native Born | 461 (93.7%) | 31 (6.3%) |
| Foreign Born, Citizen | 1,199 (94.8%) | 66 (5.2%) |
| Foreign Born, not a Citizen | 537 (88.8%) | 68 (11.2%) |
Health Insurance Coverage by Household Income in Coosa County
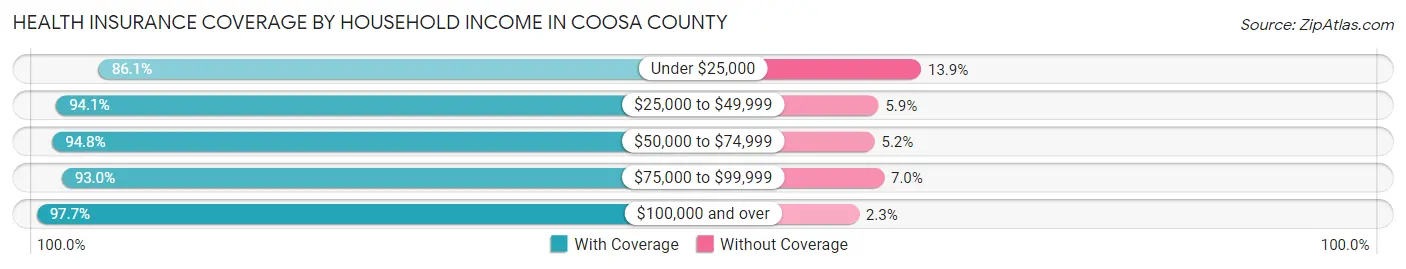
| Household Income | With Coverage | Without Coverage |
| Under $25,000 | 1,126 (86.1%) | 182 (13.9%) |
| $25,000 to $49,999 | 2,379 (94.1%) | 150 (5.9%) |
| $50,000 to $74,999 | 1,714 (94.8%) | 94 (5.2%) |
| $75,000 to $99,999 | 1,760 (93.0%) | 132 (7.0%) |
| $100,000 and over | 2,328 (97.7%) | 54 (2.3%) |
Public vs Private Health Insurance Coverage by Age in Coosa County
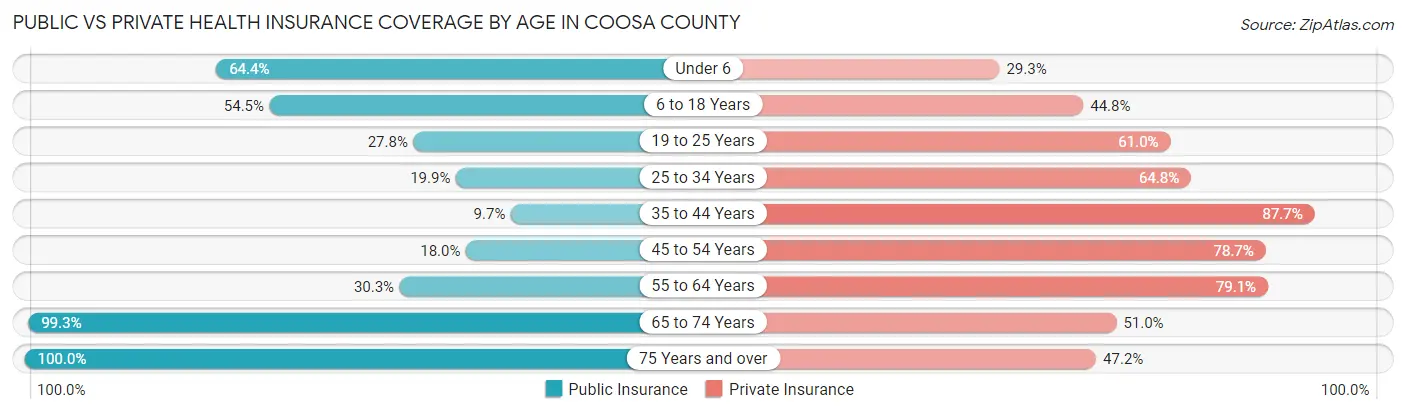
| Age Bracket | Public Insurance | Private Insurance |
| Under 6 | 317 (64.4%) | 144 (29.3%) |
| 6 to 18 Years | 689 (54.5%) | 567 (44.8%) |
| 19 to 25 Years | 168 (27.8%) | 369 (61.0%) |
| 25 to 34 Years | 165 (19.9%) | 538 (64.8%) |
| 35 to 44 Years | 97 (9.7%) | 880 (87.7%) |
| 45 to 54 Years | 244 (18.0%) | 1,065 (78.7%) |
| 55 to 64 Years | 573 (30.3%) | 1,494 (79.1%) |
| 65 to 74 Years | 1,469 (99.3%) | 754 (51.0%) |
| 75 Years and over | 1,002 (100.0%) | 473 (47.2%) |
| Total | 4,724 (47.6%) | 6,284 (63.3%) |
Disability Status by Sex by Age in Coosa County
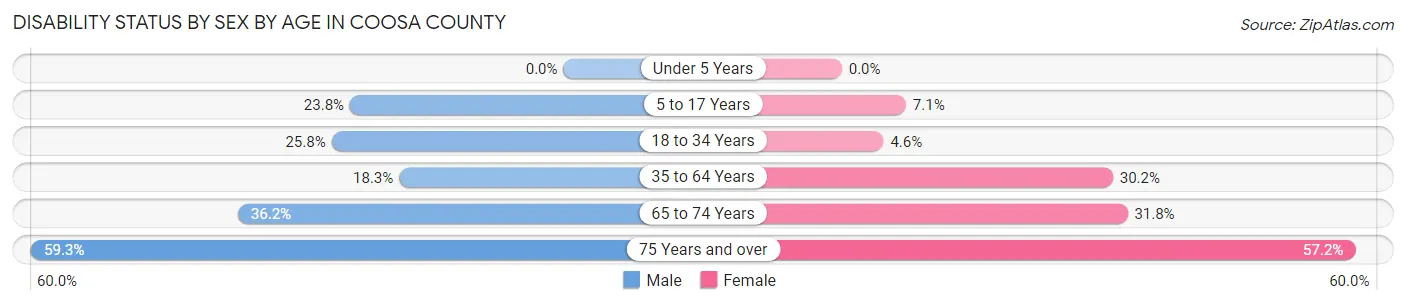
| Age Bracket | Male | Female |
| Under 5 Years | 0 (0.0%) | 0 (0.0%) |
| 5 to 17 Years | 154 (23.8%) | 39 (7.1%) |
| 18 to 34 Years | 190 (25.8%) | 37 (4.6%) |
| 35 to 64 Years | 384 (18.3%) | 648 (30.2%) |
| 65 to 74 Years | 266 (36.2%) | 237 (31.8%) |
| 75 Years and over | 259 (59.3%) | 323 (57.2%) |
Disability Class by Sex by Age in Coosa County
Disability Class: Hearing Difficulty
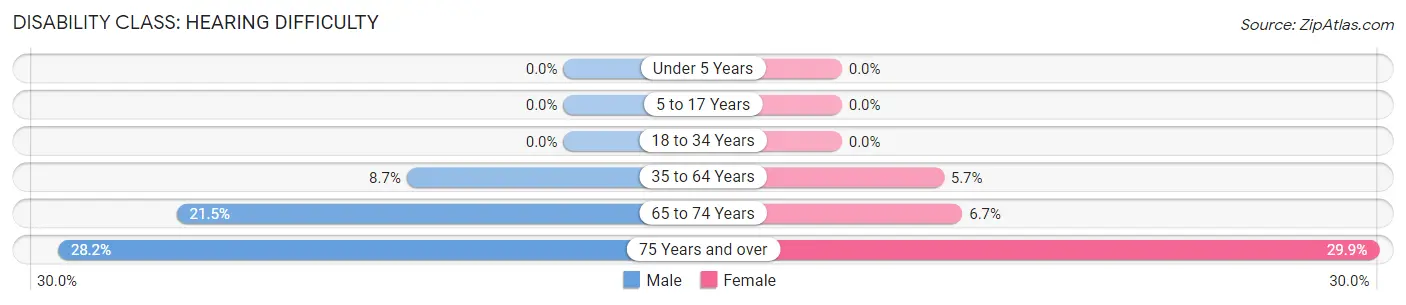
| Age Bracket | Male | Female |
| Under 5 Years | 0 (0.0%) | 0 (0.0%) |
| 5 to 17 Years | 0 (0.0%) | 0 (0.0%) |
| 18 to 34 Years | 0 (0.0%) | 0 (0.0%) |
| 35 to 64 Years | 183 (8.7%) | 122 (5.7%) |
| 65 to 74 Years | 158 (21.5%) | 50 (6.7%) |
| 75 Years and over | 123 (28.1%) | 169 (29.9%) |
Disability Class: Vision Difficulty
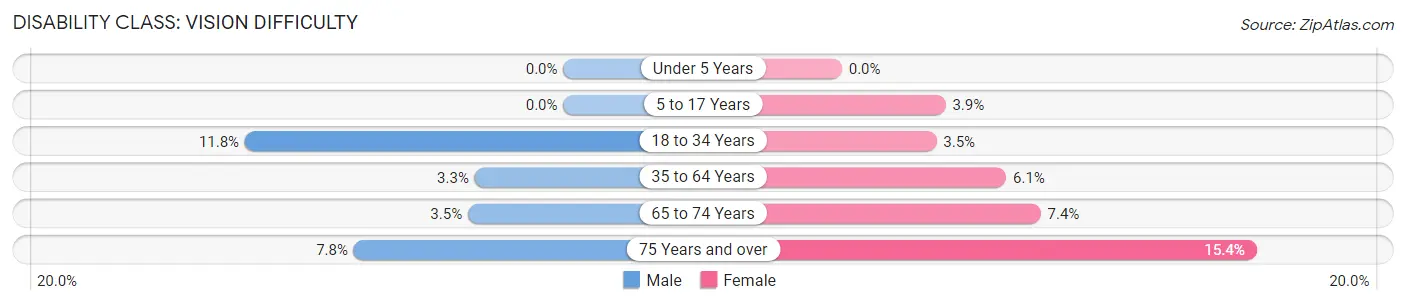
| Age Bracket | Male | Female |
| Under 5 Years | 0 (0.0%) | 0 (0.0%) |
| 5 to 17 Years | 0 (0.0%) | 21 (3.8%) |
| 18 to 34 Years | 87 (11.8%) | 28 (3.5%) |
| 35 to 64 Years | 69 (3.3%) | 131 (6.1%) |
| 65 to 74 Years | 26 (3.5%) | 55 (7.4%) |
| 75 Years and over | 34 (7.8%) | 87 (15.4%) |
Disability Class: Cognitive Difficulty
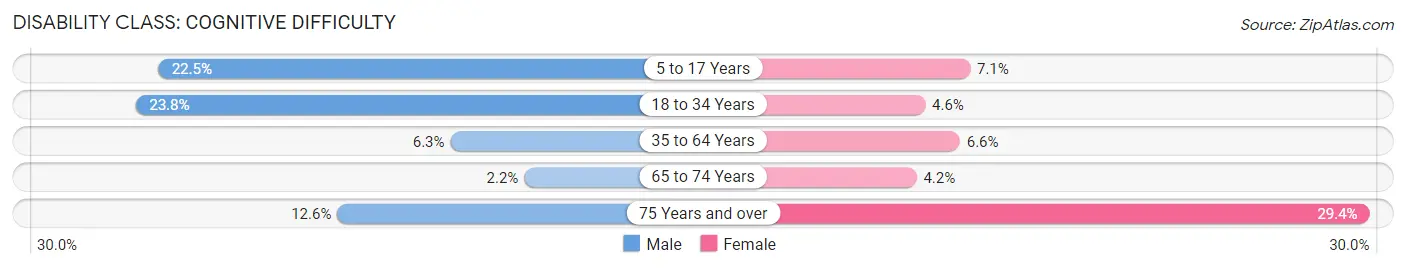
| Age Bracket | Male | Female |
| 5 to 17 Years | 146 (22.5%) | 39 (7.1%) |
| 18 to 34 Years | 175 (23.8%) | 37 (4.6%) |
| 35 to 64 Years | 132 (6.3%) | 141 (6.6%) |
| 65 to 74 Years | 16 (2.2%) | 31 (4.2%) |
| 75 Years and over | 55 (12.6%) | 166 (29.4%) |
Disability Class: Ambulatory Difficulty
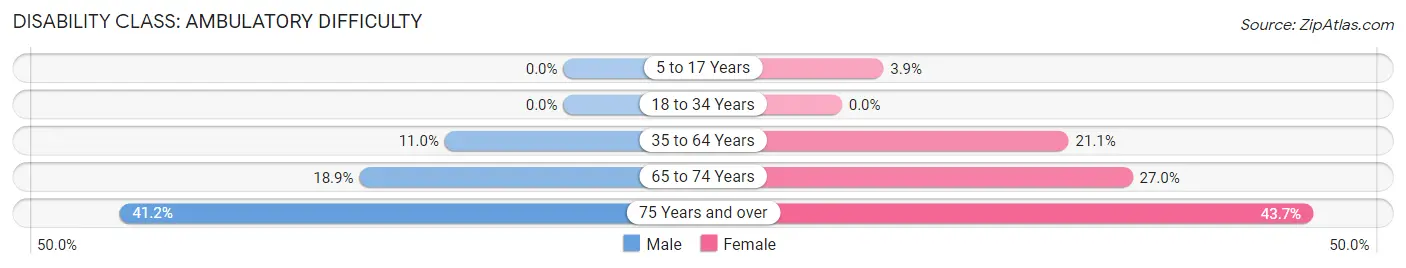
| Age Bracket | Male | Female |
| 5 to 17 Years | 0 (0.0%) | 21 (3.8%) |
| 18 to 34 Years | 0 (0.0%) | 0 (0.0%) |
| 35 to 64 Years | 231 (11.0%) | 452 (21.0%) |
| 65 to 74 Years | 139 (18.9%) | 201 (27.0%) |
| 75 Years and over | 180 (41.2%) | 247 (43.7%) |
Disability Class: Self-Care Difficulty
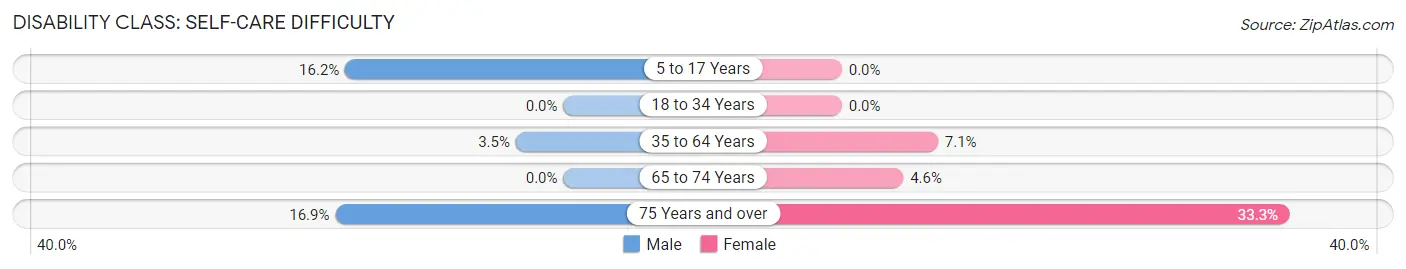
| Age Bracket | Male | Female |
| 5 to 17 Years | 105 (16.2%) | 0 (0.0%) |
| 18 to 34 Years | 0 (0.0%) | 0 (0.0%) |
| 35 to 64 Years | 74 (3.5%) | 153 (7.1%) |
| 65 to 74 Years | 0 (0.0%) | 34 (4.6%) |
| 75 Years and over | 74 (16.9%) | 188 (33.3%) |
Technology Access in Coosa County
Computing Device Access in Coosa County
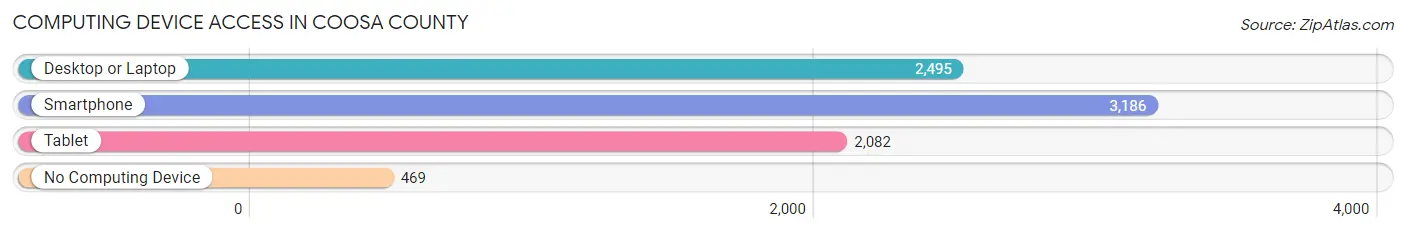
| Device Type | # Households | % Households |
| Desktop or Laptop | 2,495 | 62.4% |
| Smartphone | 3,186 | 79.7% |
| Tablet | 2,082 | 52.1% |
| No Computing Device | 469 | 11.7% |
| Total | 3,999 | 100.0% |
Internet Access in Coosa County
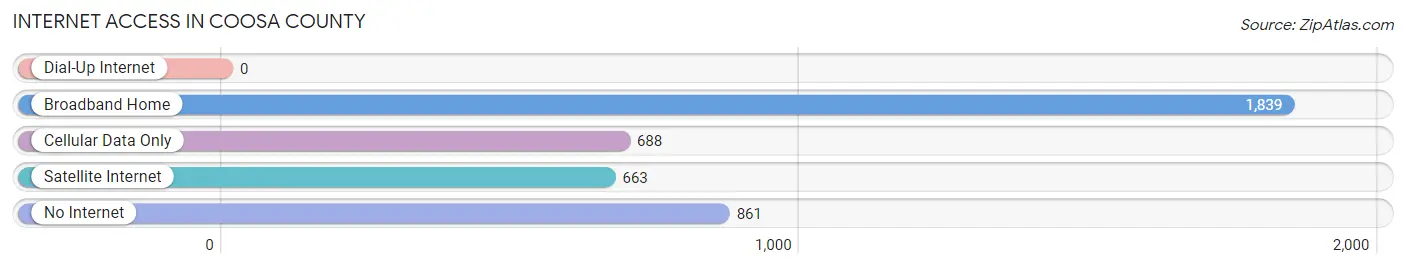
| Internet Type | # Households | % Households |
| Dial-Up Internet | 0 | 0.0% |
| Broadband Home | 1,839 | 46.0% |
| Cellular Data Only | 688 | 17.2% |
| Satellite Internet | 663 | 16.6% |
| No Internet | 861 | 21.5% |
| Total | 3,999 | 100.0% |
Coosa County Summary
Coosa County is located in the east-central part of the state of Alabama, in the United States. It is bordered by Talladega County to the north, Clay County to the east, Tallapoosa County to the south, and Chilton County to the west. The county seat is Rockford, and the largest city is Wetumpka. The county was established on December 18, 1832, and was named for the Coosa River, which runs through the county.
Geography
Coosa County covers an area of 576 square miles, of which 574 square miles is land and 2 square miles is water. The county is located in the Piedmont region of Alabama, and is characterized by rolling hills and valleys. The Coosa River forms the western boundary of the county, and the Tallapoosa River forms the southern boundary. The county is home to several lakes, including Lake Jordan, Lake Martin, and Lake Mitchell.
The climate of Coosa County is humid subtropical, with hot, humid summers and mild winters. The average annual temperature is 64°F, and the average annual precipitation is 52 inches.
Demographics
As of the 2010 United States Census, there were 11,539 people, 4,541 households, and 3,097 families living in Coosa County. The population density was 20.1 people per square mile. The racial makeup of the county was 79.2% White, 18.3% Black or African American, 0.3% Native American, 0.2% Asian, 0.1% Pacific Islander, 0.7% from other races, and 1.4% from two or more races. 1.7% of the population were Hispanic or Latino of any race.
The median income for a household in Coosa County was $35,945, and the median income for a family was $43,945. The per capita income for the county was $17,945. About 17.2% of the population were below the poverty line.
Economy
The economy of Coosa County is largely based on agriculture and manufacturing. The county is home to several large poultry farms, as well as several smaller farms that produce corn, soybeans, cotton, and other crops. The county is also home to several manufacturing plants, including a paper mill, a textile mill, and a furniture factory.
The county is also home to several tourist attractions, including the Coosa River, Lake Jordan, and Lake Martin. The county is also home to several historic sites, including the Wetumpka Impact Crater, the Horseshoe Bend National Military Park, and the Fort Toulouse-Fort Jackson State Historic Site.
Conclusion
Coosa County is a rural county located in the east-central part of Alabama. It is bordered by the Coosa and Tallapoosa Rivers, and is home to several lakes and tourist attractions. The county has a humid subtropical climate, and is largely agricultural and manufacturing-based. The population of the county is 11,539, and the median income for a household is $35,945. Coosa County is a great place to live, work, and visit.
Common Questions
What is Per Capita Income in Coosa County?
Per Capita income in Coosa County is $28,998.
What is the Median Family Income in Coosa County?
Median Family Income in Coosa County is $64,482.
What is the Median Household income in Coosa County?
Median Household Income in Coosa County is $52,279.
What is Income or Wage Gap in Coosa County?
Income or Wage Gap in Coosa County is 32.7%.
Women in Coosa County earn 67.3 cents for every dollar earned by a man.
What is Inequality or Gini Index in Coosa County?
Inequality or Gini Index in Coosa County is 0.42.
What is the Total Population of Coosa County?
Total Population of Coosa County is 10,329.
What is the Total Male Population of Coosa County?
Total Male Population of Coosa County is 5,306.
What is the Total Female Population of Coosa County?
Total Female Population of Coosa County is 5,023.
What is the Ratio of Males per 100 Females in Coosa County?
There are 105.63 Males per 100 Females in Coosa County.
What is the Ratio of Females per 100 Males in Coosa County?
There are 94.67 Females per 100 Males in Coosa County.
What is the Median Population Age in Coosa County?
Median Population Age in Coosa County is 50.2 Years.
What is the Average Family Size in Coosa County
Average Family Size in Coosa County is 3.1 People.
What is the Average Household Size in Coosa County
Average Household Size in Coosa County is 2.5 People.
How Large is the Labor Force in Coosa County?
There are 4,095 People in the Labor Forcein in Coosa County.
What is the Percentage of People in the Labor Force in Coosa County?
46.4% of People are in the Labor Force in Coosa County.
What is the Unemployment Rate in Coosa County?
Unemployment Rate in Coosa County is 4.4%.