Butler County, AL Map & Demographics
Butler County Map
Butler County Overview
$26,334
PER CAPITA INCOME
$59,217
AVG FAMILY INCOME
$44,429
AVG HOUSEHOLD INCOME
33.5%
WAGE / INCOME GAP [ % ]
66.5¢/ $1
WAGE / INCOME GAP [ $ ]
$8,395
FAMILY INCOME DEFICIT
0.48
INEQUALITY / GINI INDEX
18,981
TOTAL POPULATION
8,928
MALE POPULATION
10,053
FEMALE POPULATION
88.81
MALES / 100 FEMALES
112.60
FEMALES / 100 MALES
41.6
MEDIAN AGE
3.3
AVG FAMILY SIZE
2.6
AVG HOUSEHOLD SIZE
8,042
LABOR FORCE [ PEOPLE ]
52.9%
PERCENT IN LABOR FORCE
6.8%
UNEMPLOYMENT RATE
Butler County Area Codes
Income in Butler County
Income Overview in Butler County
Per Capita Income in Butler County is $26,334, while median incomes of families and households are $59,217 and $44,429 respectively.
| Characteristic | Number | Measure |
| Per Capita Income | 18,981 | $26,334 |
| Median Family Income | 4,620 | $59,217 |
| Mean Family Income | 4,620 | $79,960 |
| Median Household Income | 7,131 | $44,429 |
| Mean Household Income | 7,131 | $65,988 |
| Income Deficit | 4,620 | $8,395 |
| Wage / Income Gap (%) | 18,981 | 33.52% |
| Wage / Income Gap ($) | 18,981 | 66.48¢ per $1 |
| Gini / Inequality Index | 18,981 | 0.48 |
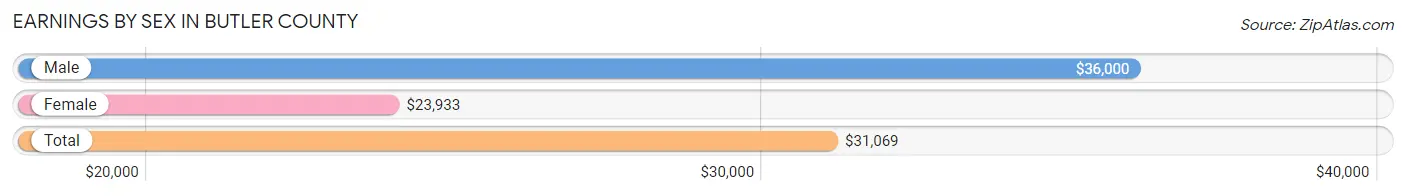
Earnings by Sex in Butler County
Average Earnings in Butler County are $31,069, $36,000 for men and $23,933 for women, a difference of 33.5%.
| Sex | Number | Average Earnings |
| Male | 3,944 (47.3%) | $36,000 |
| Female | 4,399 (52.7%) | $23,933 |
| Total | 8,343 (100.0%) | $31,069 |
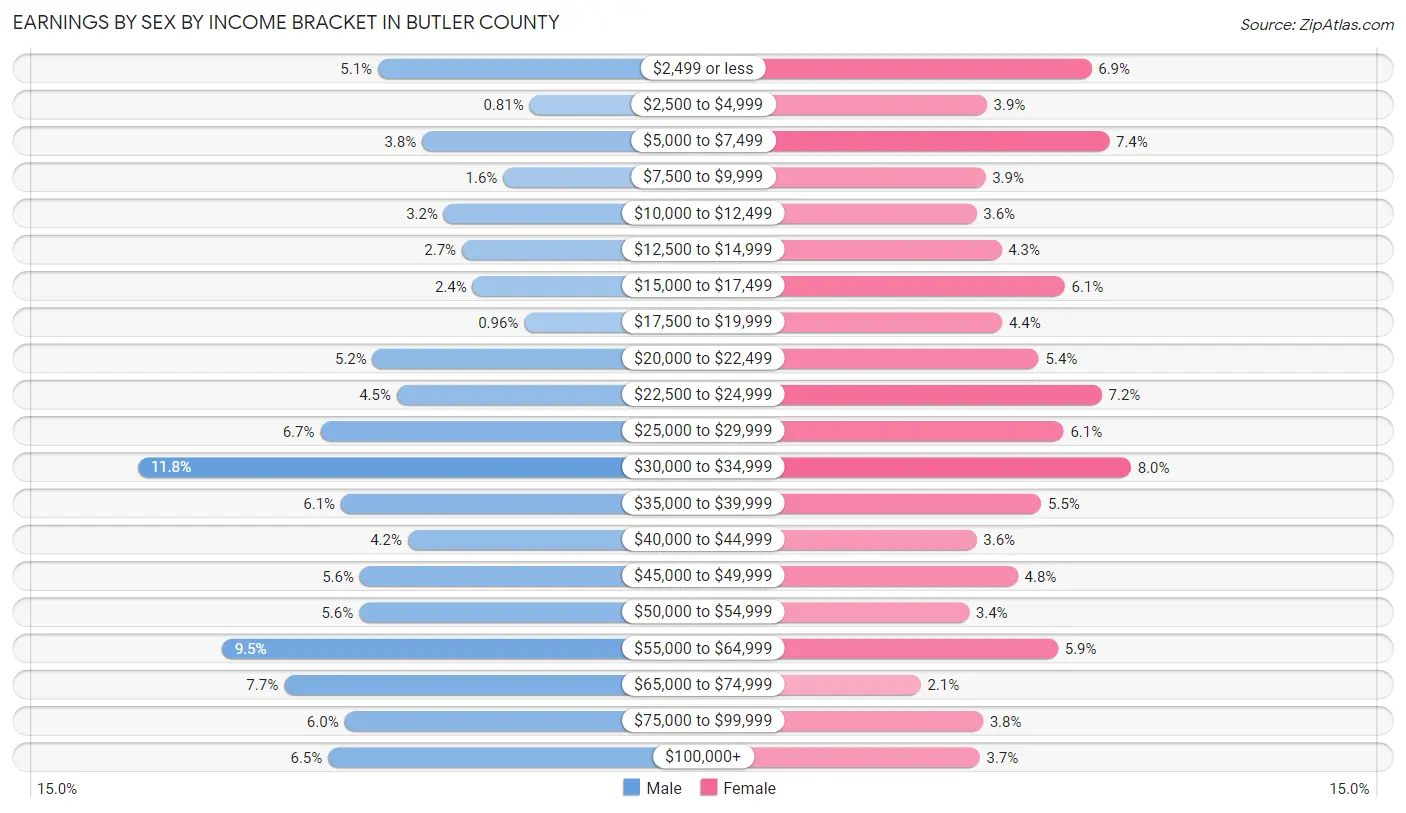
Earnings by Sex by Income Bracket in Butler County
The most common earnings brackets in Butler County are $30,000 to $34,999 for men (466 | 11.8%) and $30,000 to $34,999 for women (351 | 8.0%).
| Income | Male | Female |
| $2,499 or less | 200 (5.1%) | 302 (6.9%) |
| $2,500 to $4,999 | 32 (0.8%) | 173 (3.9%) |
| $5,000 to $7,499 | 151 (3.8%) | 324 (7.4%) |
| $7,500 to $9,999 | 61 (1.5%) | 171 (3.9%) |
| $10,000 to $12,499 | 127 (3.2%) | 160 (3.6%) |
| $12,500 to $14,999 | 107 (2.7%) | 191 (4.3%) |
| $15,000 to $17,499 | 95 (2.4%) | 269 (6.1%) |
| $17,500 to $19,999 | 38 (1.0%) | 192 (4.4%) |
| $20,000 to $22,499 | 206 (5.2%) | 237 (5.4%) |
| $22,500 to $24,999 | 179 (4.5%) | 315 (7.2%) |
| $25,000 to $29,999 | 264 (6.7%) | 268 (6.1%) |
| $30,000 to $34,999 | 466 (11.8%) | 351 (8.0%) |
| $35,000 to $39,999 | 241 (6.1%) | 240 (5.5%) |
| $40,000 to $44,999 | 167 (4.2%) | 160 (3.6%) |
| $45,000 to $49,999 | 220 (5.6%) | 211 (4.8%) |
| $50,000 to $54,999 | 221 (5.6%) | 151 (3.4%) |
| $55,000 to $64,999 | 373 (9.5%) | 261 (5.9%) |
| $65,000 to $74,999 | 304 (7.7%) | 91 (2.1%) |
| $75,000 to $99,999 | 237 (6.0%) | 168 (3.8%) |
| $100,000+ | 255 (6.5%) | 164 (3.7%) |
| Total | 3,944 (100.0%) | 4,399 (100.0%) |
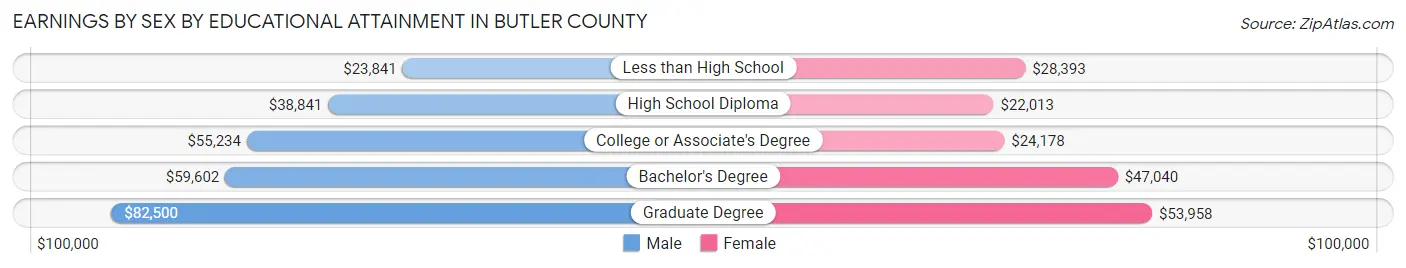
Earnings by Sex by Educational Attainment in Butler County
Average earnings in Butler County are $41,250 for men and $27,030 for women, a difference of 34.5%. Men with an educational attainment of graduate degree enjoy the highest average annual earnings of $82,500, while those with less than high school education earn the least with $23,841. Women with an educational attainment of graduate degree earn the most with the average annual earnings of $53,958, while those with high school diploma education have the smallest earnings of $22,013.
| Educational Attainment | Male Income | Female Income |
| Less than High School | $23,841 | $28,393 |
| High School Diploma | $38,841 | $22,013 |
| College or Associate's Degree | $55,234 | $24,178 |
| Bachelor's Degree | $59,602 | $47,040 |
| Graduate Degree | $82,500 | $53,958 |
| Total | $41,250 | $27,030 |
Family Income in Butler County
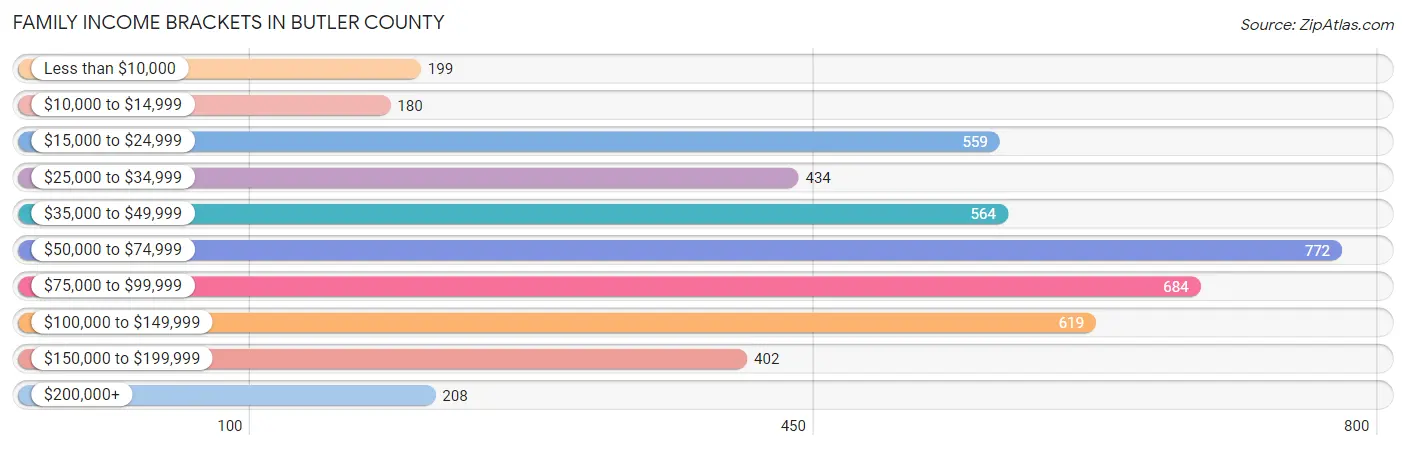
Family Income Brackets in Butler County
According to the Butler County family income data, there are 772 families falling into the $50,000 to $74,999 income range, which is the most common income bracket and makes up 16.7% of all families. Conversely, the $10,000 to $14,999 income bracket is the least frequent group with only 180 families (3.9%) belonging to this category.
| Income Bracket | # Families | % Families |
| Less than $10,000 | 199 | 4.3% |
| $10,000 to $14,999 | 180 | 3.9% |
| $15,000 to $24,999 | 559 | 12.1% |
| $25,000 to $34,999 | 434 | 9.4% |
| $35,000 to $49,999 | 564 | 12.2% |
| $50,000 to $74,999 | 772 | 16.7% |
| $75,000 to $99,999 | 684 | 14.8% |
| $100,000 to $149,999 | 619 | 13.4% |
| $150,000 to $199,999 | 402 | 8.7% |
| $200,000+ | 208 | 4.5% |
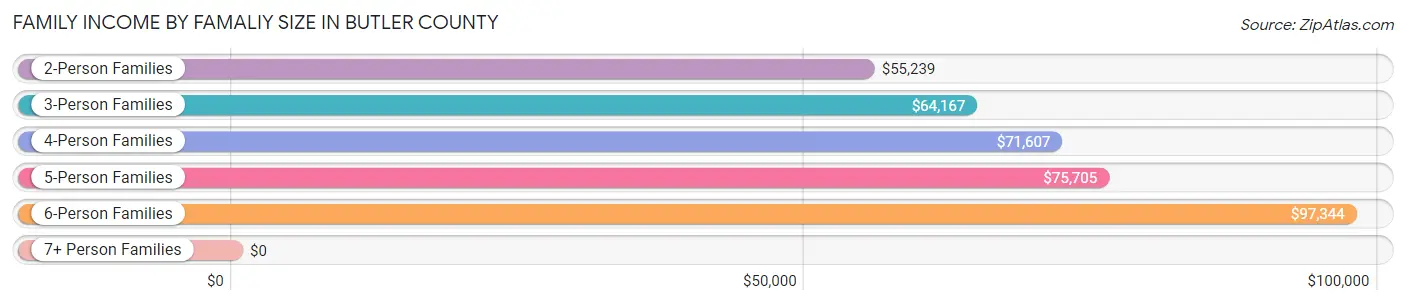
Family Income by Famaliy Size in Butler County
6-person families (95 | 2.1%) account for the highest median family income in Butler County with $97,344 per family, while 2-person families (2,399 | 51.9%) have the highest median income of $27,620 per family member.
| Income Bracket | # Families | Median Income |
| 2-Person Families | 2,399 (51.9%) | $55,239 |
| 3-Person Families | 1,100 (23.8%) | $64,167 |
| 4-Person Families | 704 (15.2%) | $71,607 |
| 5-Person Families | 310 (6.7%) | $75,705 |
| 6-Person Families | 95 (2.1%) | $97,344 |
| 7+ Person Families | 12 (0.3%) | $0 |
| Total | 4,620 (100.0%) | $59,217 |
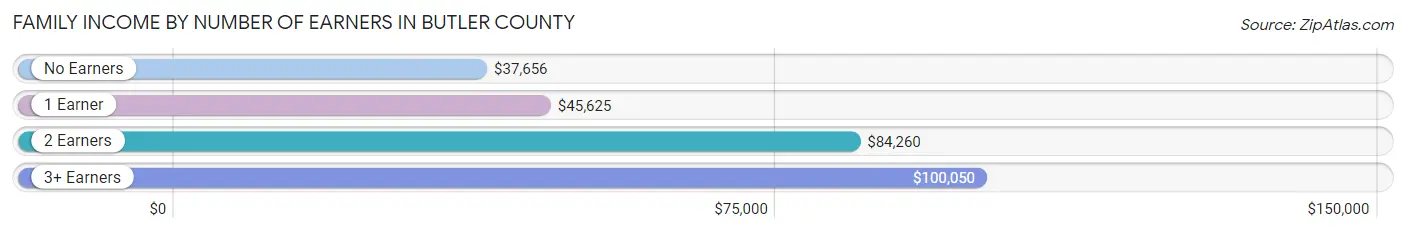
Family Income by Number of Earners in Butler County
The median family income in Butler County is $59,217, with families comprising 3+ earners (297) having the highest median family income of $100,050, while families with no earners (1,007) have the lowest median family income of $37,656, accounting for 6.4% and 21.8% of families, respectively.
| Number of Earners | # Families | Median Income |
| No Earners | 1,007 (21.8%) | $37,656 |
| 1 Earner | 1,508 (32.6%) | $45,625 |
| 2 Earners | 1,808 (39.1%) | $84,260 |
| 3+ Earners | 297 (6.4%) | $100,050 |
| Total | 4,620 (100.0%) | $59,217 |
Household Income in Butler County
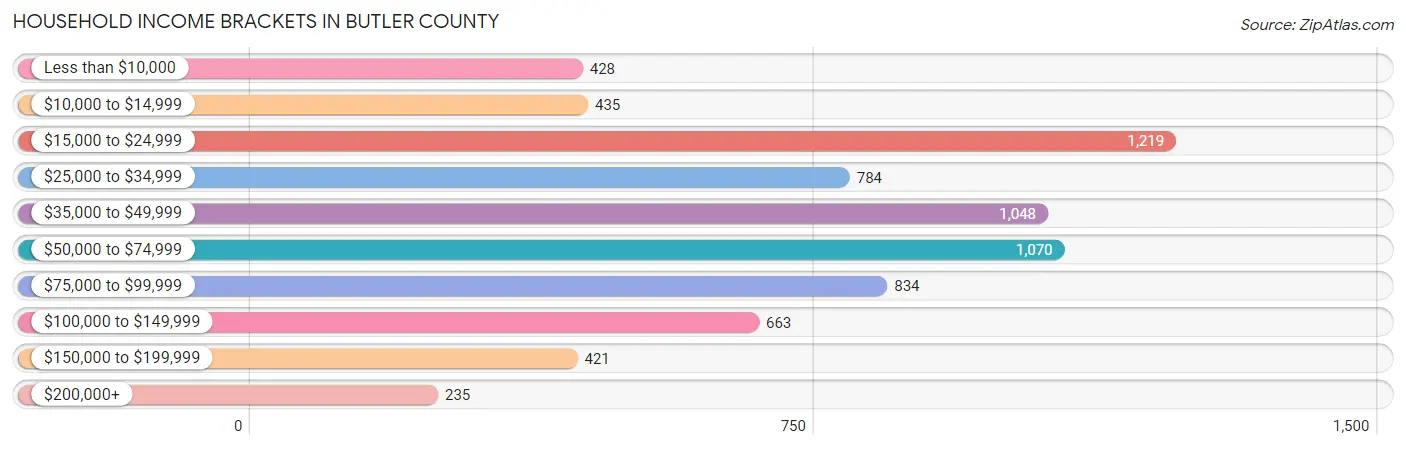
Household Income Brackets in Butler County
With 1,219 households falling in the category, the $15,000 to $24,999 income range is the most frequent in Butler County, accounting for 17.1% of all households. In contrast, only 235 households (3.3%) fall into the $200,000+ income bracket, making it the least populous group.
| Income Bracket | # Households | % Households |
| Less than $10,000 | 428 | 6.0% |
| $10,000 to $14,999 | 435 | 6.1% |
| $15,000 to $24,999 | 1,219 | 17.1% |
| $25,000 to $34,999 | 784 | 11.0% |
| $35,000 to $49,999 | 1,048 | 14.7% |
| $50,000 to $74,999 | 1,070 | 15.0% |
| $75,000 to $99,999 | 834 | 11.7% |
| $100,000 to $149,999 | 663 | 9.3% |
| $150,000 to $199,999 | 421 | 5.9% |
| $200,000+ | 235 | 3.3% |
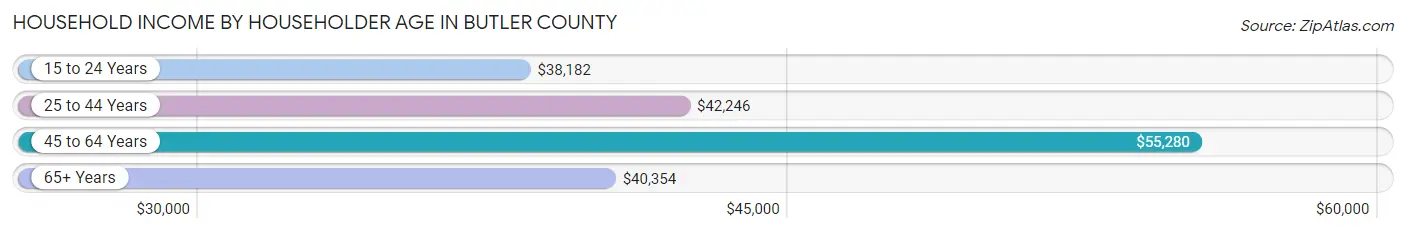
Household Income by Householder Age in Butler County
The median household income in Butler County is $44,429, with the highest median household income of $55,280 found in the 45 to 64 years age bracket for the primary householder. A total of 2,550 households (35.8%) fall into this category. Meanwhile, the 15 to 24 years age bracket for the primary householder has the lowest median household income of $38,182, with 76 households (1.1%) in this group.
| Income Bracket | # Households | Median Income |
| 15 to 24 Years | 76 (1.1%) | $38,182 |
| 25 to 44 Years | 1,976 (27.7%) | $42,246 |
| 45 to 64 Years | 2,550 (35.8%) | $55,280 |
| 65+ Years | 2,529 (35.5%) | $40,354 |
| Total | 7,131 (100.0%) | $44,429 |
Poverty in Butler County
Income Below Poverty by Sex and Age in Butler County
With 16.7% poverty level for males and 25.0% for females among the residents of Butler County, 6 to 11 year old males and under 5 year old females are the most vulnerable to poverty, with 307 males (45.8%) and 302 females (56.6%) in their respective age groups living below the poverty level.
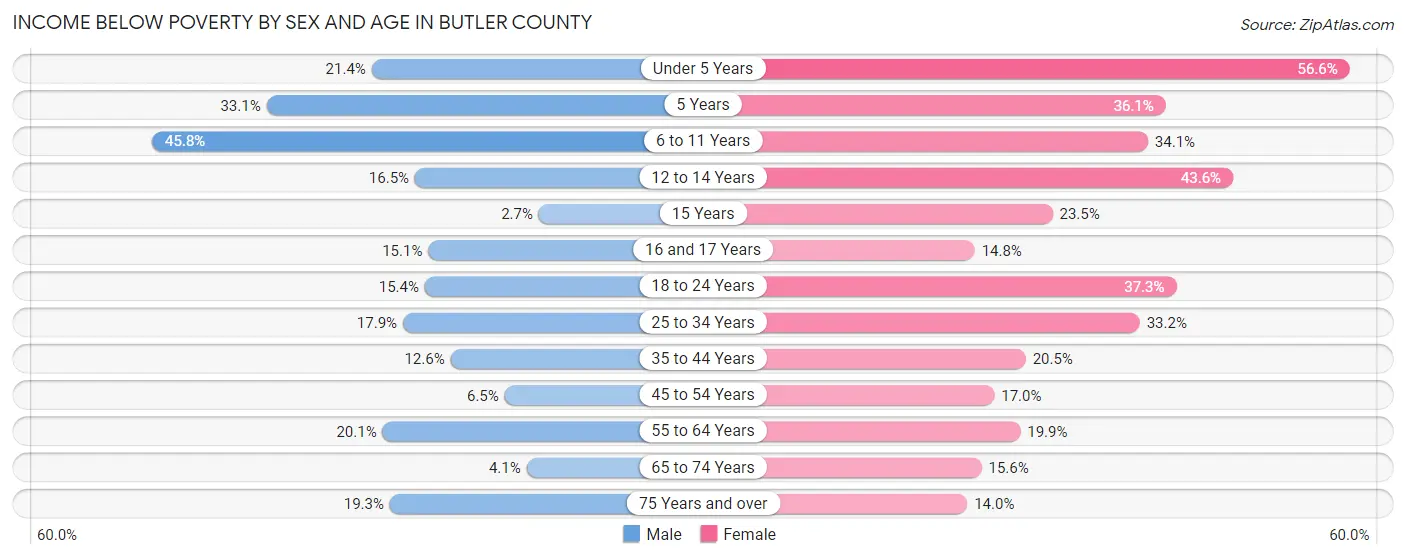
| Age Bracket | Male | Female |
| Under 5 Years | 111 (21.3%) | 302 (56.6%) |
| 5 Years | 40 (33.1%) | 22 (36.1%) |
| 6 to 11 Years | 307 (45.8%) | 226 (34.1%) |
| 12 to 14 Years | 83 (16.5%) | 169 (43.6%) |
| 15 Years | 5 (2.7%) | 23 (23.5%) |
| 16 and 17 Years | 31 (15.0%) | 37 (14.8%) |
| 18 to 24 Years | 114 (15.4%) | 263 (37.2%) |
| 25 to 34 Years | 180 (17.9%) | 366 (33.2%) |
| 35 to 44 Years | 142 (12.6%) | 255 (20.5%) |
| 45 to 54 Years | 62 (6.5%) | 206 (17.0%) |
| 55 to 64 Years | 227 (20.1%) | 274 (19.9%) |
| 65 to 74 Years | 41 (4.1%) | 192 (15.6%) |
| 75 Years and over | 115 (19.3%) | 144 (14.0%) |
| Total | 1,458 (16.7%) | 2,479 (25.0%) |
Income Above Poverty by Sex and Age in Butler County
According to the poverty statistics in Butler County, males aged 15 years and females aged 75 years and over are the age groups that are most secure financially, with 97.3% of males and 86.0% of females in these age groups living above the poverty line.
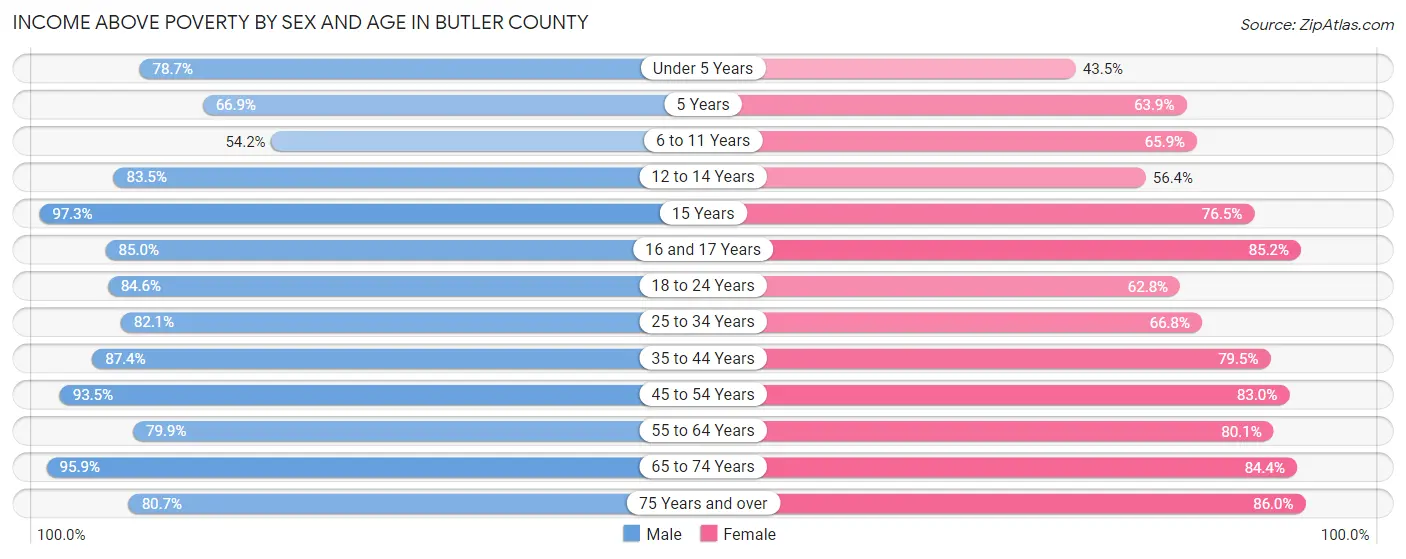
| Age Bracket | Male | Female |
| Under 5 Years | 409 (78.6%) | 232 (43.4%) |
| 5 Years | 81 (66.9%) | 39 (63.9%) |
| 6 to 11 Years | 363 (54.2%) | 437 (65.9%) |
| 12 to 14 Years | 419 (83.5%) | 219 (56.4%) |
| 15 Years | 178 (97.3%) | 75 (76.5%) |
| 16 and 17 Years | 175 (85.0%) | 213 (85.2%) |
| 18 to 24 Years | 625 (84.6%) | 443 (62.7%) |
| 25 to 34 Years | 827 (82.1%) | 737 (66.8%) |
| 35 to 44 Years | 988 (87.4%) | 990 (79.5%) |
| 45 to 54 Years | 886 (93.5%) | 1,007 (83.0%) |
| 55 to 64 Years | 900 (79.9%) | 1,104 (80.1%) |
| 65 to 74 Years | 959 (95.9%) | 1,042 (84.4%) |
| 75 Years and over | 480 (80.7%) | 887 (86.0%) |
| Total | 7,290 (83.3%) | 7,425 (75.0%) |
Income Below Poverty Among Married-Couple Families in Butler County
The poverty statistics for married-couple families in Butler County show that 10.3% or 334 of the total 3,241 families live below the poverty line. Families with 1 or 2 children have the highest poverty rate of 18.2%, comprising of 169 families. On the other hand, families with no children have the lowest poverty rate of 6.6%, which includes 142 families.
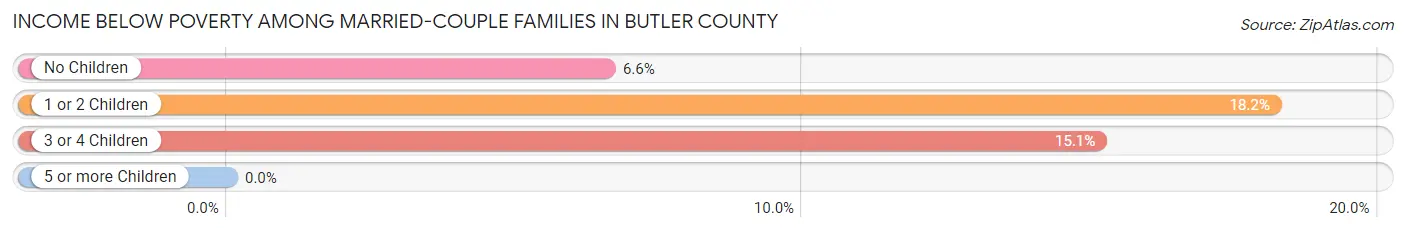
| Children | Above Poverty | Below Poverty |
| No Children | 2,017 (93.4%) | 142 (6.6%) |
| 1 or 2 Children | 761 (81.8%) | 169 (18.2%) |
| 3 or 4 Children | 129 (84.9%) | 23 (15.1%) |
| 5 or more Children | 0 (0.0%) | 0 (0.0%) |
| Total | 2,907 (89.7%) | 334 (10.3%) |
Income Below Poverty Among Single-Parent Households in Butler County
According to the poverty data in Butler County, 23.5% or 46 single-father households and 36.2% or 428 single-mother households are living below the poverty line. Among single-father households, those with no children have the highest poverty rate, with 27 households (25.7%) experiencing poverty. Likewise, among single-mother households, those with 1 or 2 children have the highest poverty rate, with 310 households (47.5%) falling below the poverty line.
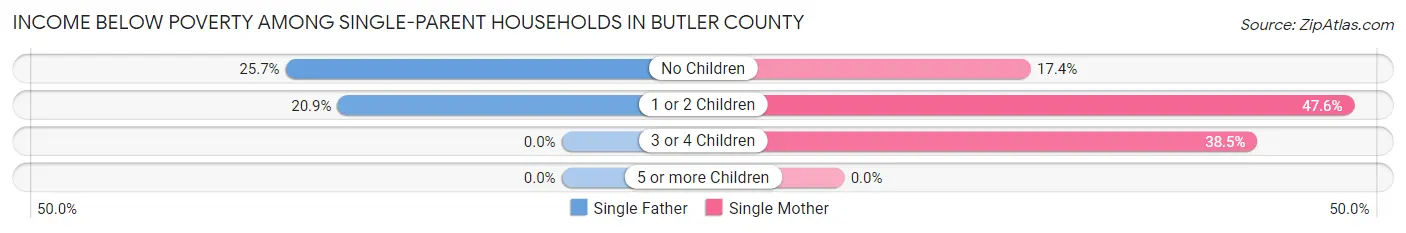
| Children | Single Father | Single Mother |
| No Children | 27 (25.7%) | 71 (17.4%) |
| 1 or 2 Children | 19 (20.9%) | 310 (47.5%) |
| 3 or 4 Children | 0 (0.0%) | 47 (38.5%) |
| 5 or more Children | 0 (0.0%) | 0 (0.0%) |
| Total | 46 (23.5%) | 428 (36.2%) |
Income Below Poverty Among Married-Couple vs Single-Parent Households in Butler County
The poverty data for Butler County shows that 334 of the married-couple family households (10.3%) and 474 of the single-parent households (34.4%) are living below the poverty level. Within the married-couple family households, those with 1 or 2 children have the highest poverty rate, with 169 households (18.2%) falling below the poverty line. Among the single-parent households, those with 1 or 2 children have the highest poverty rate, with 329 household (44.3%) living below poverty.
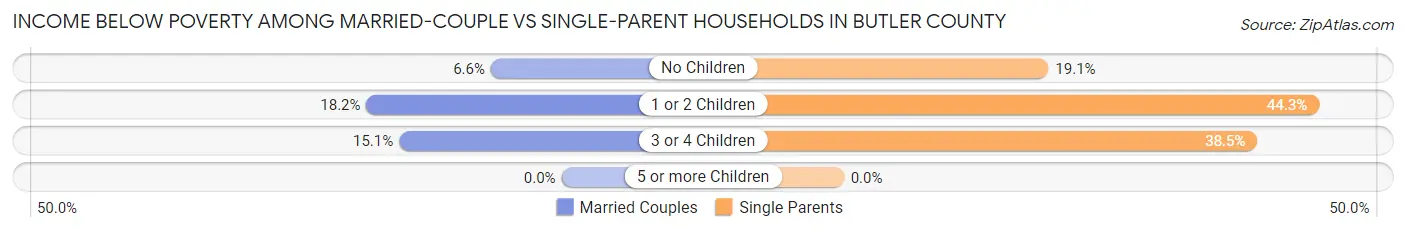
| Children | Married-Couple Families | Single-Parent Households |
| No Children | 142 (6.6%) | 98 (19.1%) |
| 1 or 2 Children | 169 (18.2%) | 329 (44.3%) |
| 3 or 4 Children | 23 (15.1%) | 47 (38.5%) |
| 5 or more Children | 0 (0.0%) | 0 (0.0%) |
| Total | 334 (10.3%) | 474 (34.4%) |
Race in Butler County
The most populous races in Butler County are White / Caucasian (9,777 | 51.5%), Black / African American (8,462 | 44.6%), and Two or more Races (373 | 2.0%).
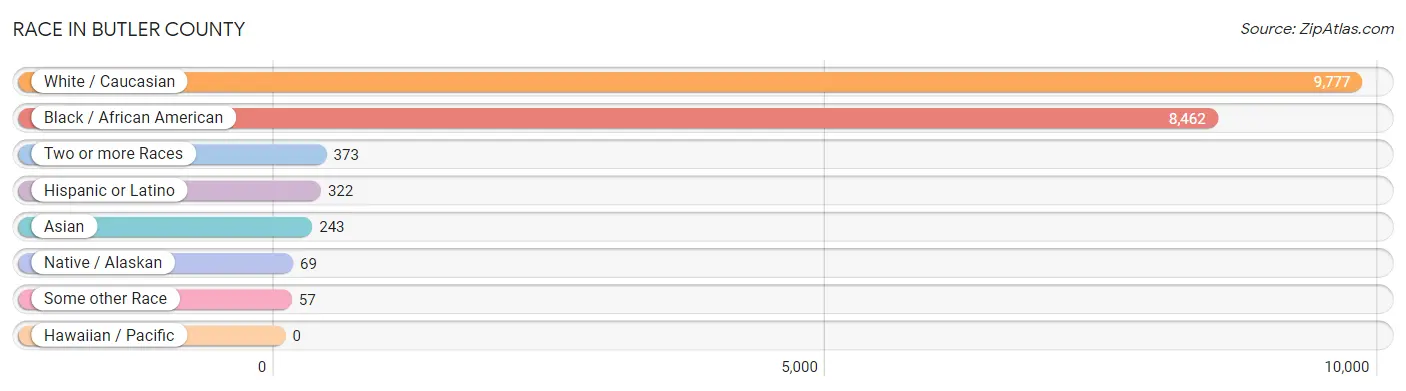
| Race | # Population | % Population |
| Asian | 243 | 1.3% |
| Black / African American | 8,462 | 44.6% |
| Hawaiian / Pacific | 0 | 0.0% |
| Hispanic or Latino | 322 | 1.7% |
| Native / Alaskan | 69 | 0.4% |
| White / Caucasian | 9,777 | 51.5% |
| Two or more Races | 373 | 2.0% |
| Some other Race | 57 | 0.3% |
| Total | 18,981 | 100.0% |
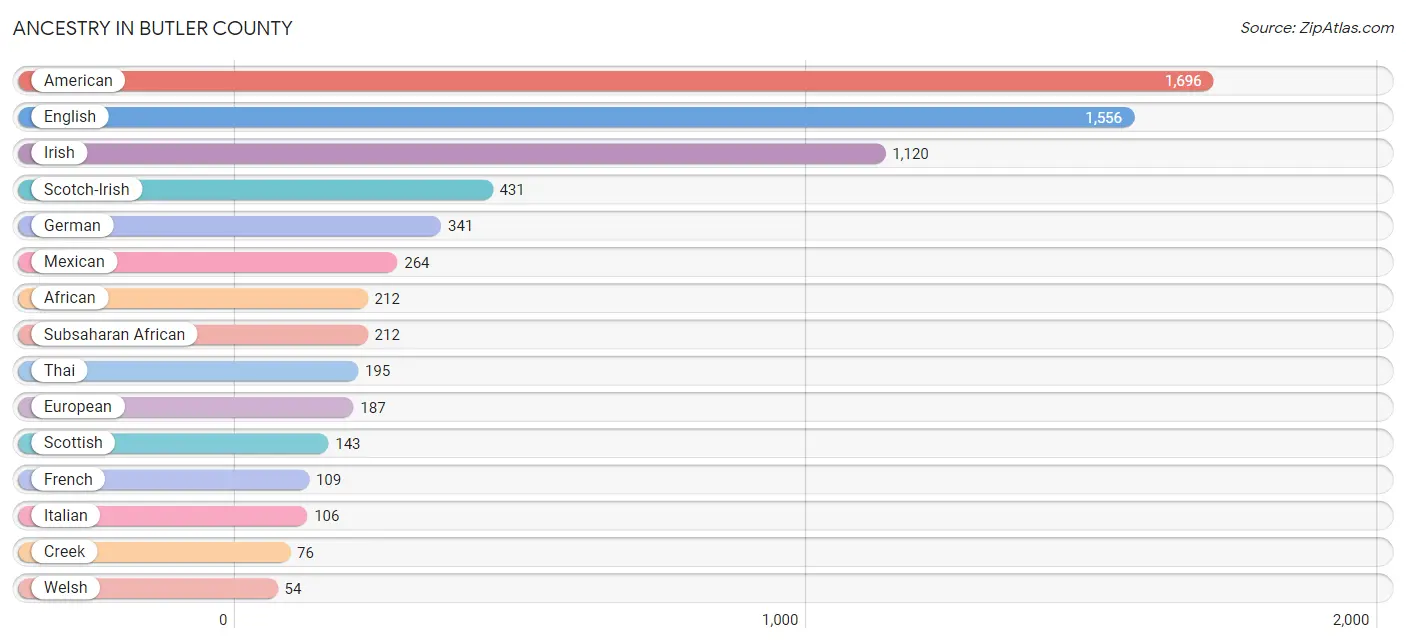
Ancestry in Butler County
The most populous ancestries reported in Butler County are American (1,696 | 8.9%), English (1,556 | 8.2%), Irish (1,120 | 5.9%), Scotch-Irish (431 | 2.3%), and German (341 | 1.8%), together accounting for 27.1% of all Butler County residents.
| Ancestry | # Population | % Population |
| African | 212 | 1.1% |
| American | 1,696 | 8.9% |
| Arab | 16 | 0.1% |
| Belgian | 12 | 0.1% |
| Bhutanese | 38 | 0.2% |
| British | 33 | 0.2% |
| Burmese | 52 | 0.3% |
| Central American | 22 | 0.1% |
| Cherokee | 50 | 0.3% |
| Choctaw | 5 | 0.0% |
| Creek | 76 | 0.4% |
| Dutch | 11 | 0.1% |
| English | 1,556 | 8.2% |
| European | 187 | 1.0% |
| French | 109 | 0.6% |
| French Canadian | 39 | 0.2% |
| German | 341 | 1.8% |
| Honduran | 22 | 0.1% |
| Irish | 1,120 | 5.9% |
| Italian | 106 | 0.6% |
| Korean | 14 | 0.1% |
| Lebanese | 16 | 0.1% |
| Mexican | 264 | 1.4% |
| New Zealander | 4 | 0.0% |
| Northern European | 4 | 0.0% |
| Norwegian | 18 | 0.1% |
| Polish | 6 | 0.0% |
| Portuguese | 5 | 0.0% |
| Puerto Rican | 9 | 0.1% |
| Russian | 16 | 0.1% |
| Scandinavian | 5 | 0.0% |
| Scotch-Irish | 431 | 2.3% |
| Scottish | 143 | 0.7% |
| Subsaharan African | 212 | 1.1% |
| Swedish | 24 | 0.1% |
| Thai | 195 | 1.0% |
| Welsh | 54 | 0.3% | View All 37 Rows |
Immigrants in Butler County
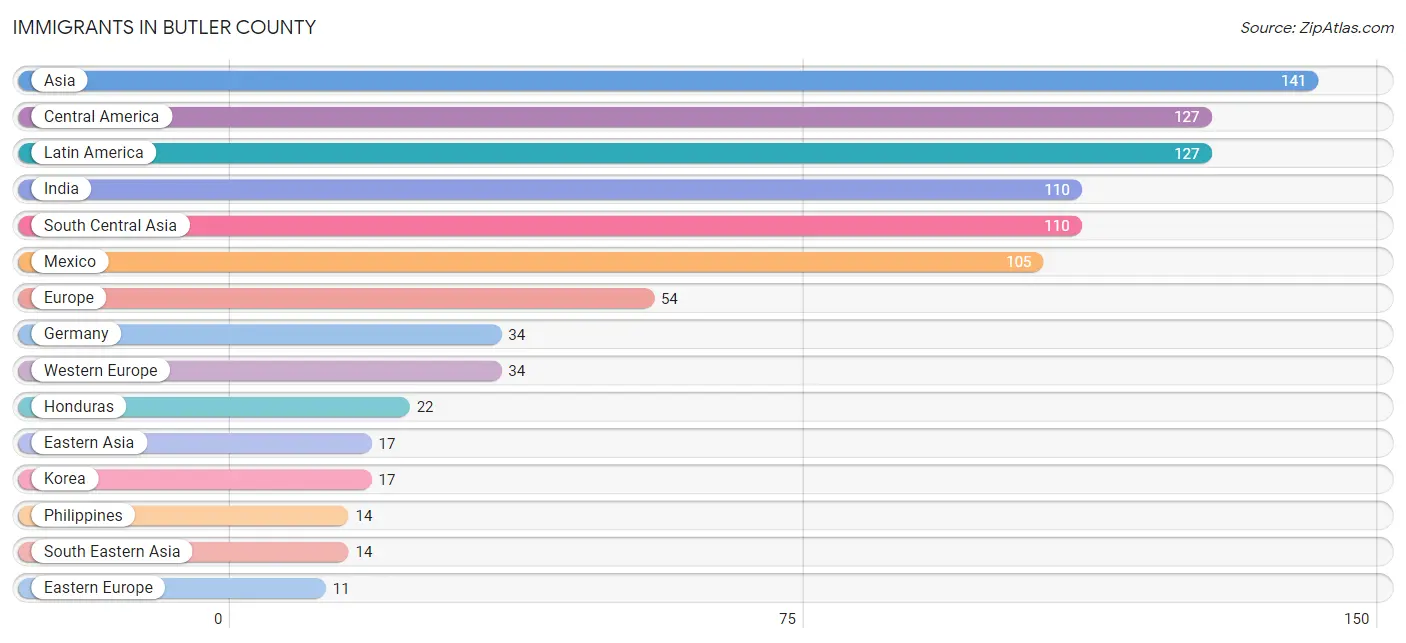
The most numerous immigrant groups reported in Butler County came from Asia (141 | 0.7%), Central America (127 | 0.7%), Latin America (127 | 0.7%), India (110 | 0.6%), and South Central Asia (110 | 0.6%), together accounting for 3.2% of all Butler County residents.
| Immigration Origin | # Population | % Population |
| Asia | 141 | 0.7% |
| Central America | 127 | 0.7% |
| Eastern Asia | 17 | 0.1% |
| Eastern Europe | 11 | 0.1% |
| Europe | 54 | 0.3% |
| Germany | 34 | 0.2% |
| Honduras | 22 | 0.1% |
| India | 110 | 0.6% |
| Korea | 17 | 0.1% |
| Latin America | 127 | 0.7% |
| Mexico | 105 | 0.5% |
| Northern Europe | 9 | 0.1% |
| Philippines | 14 | 0.1% |
| Poland | 11 | 0.1% |
| Scotland | 5 | 0.0% |
| South Central Asia | 110 | 0.6% |
| South Eastern Asia | 14 | 0.1% |
| Western Europe | 34 | 0.2% | View All 18 Rows |
Sex and Age in Butler County
Sex and Age in Butler County
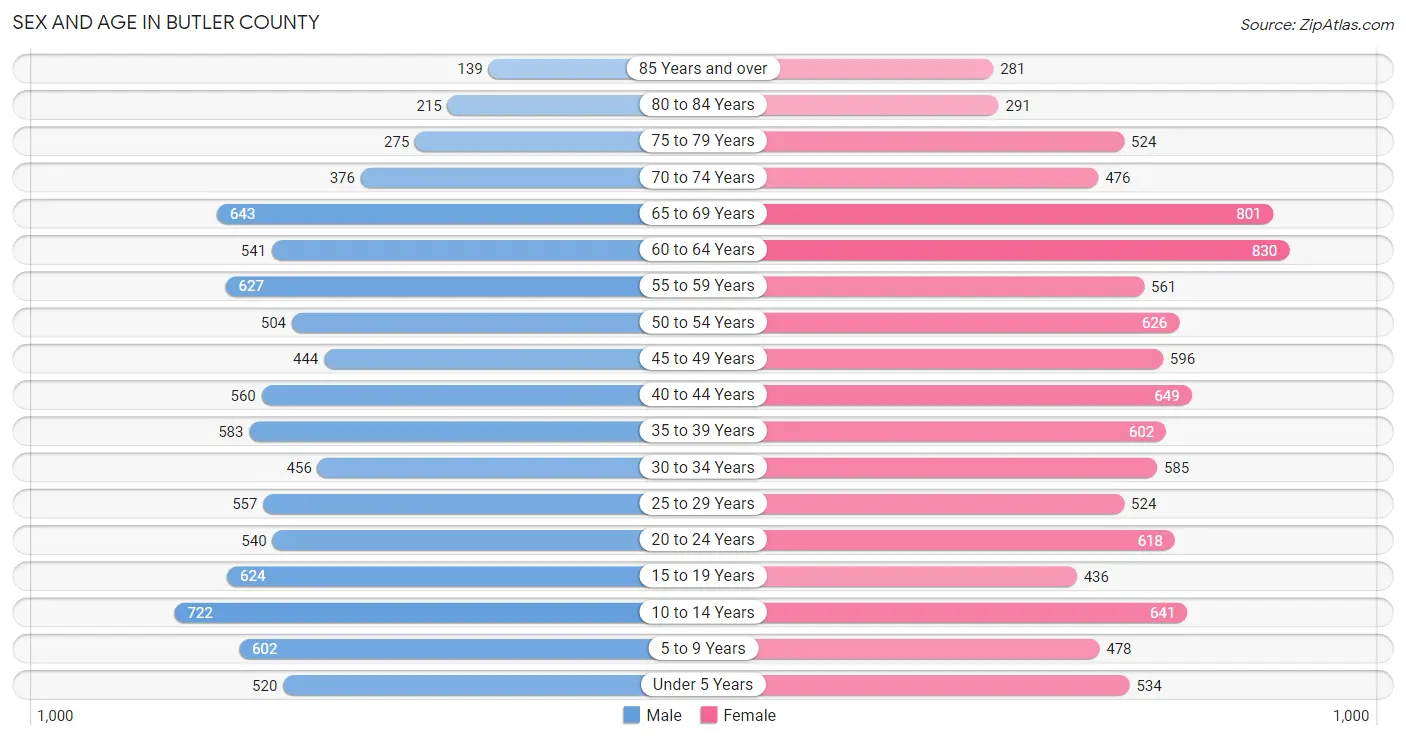
The most populous age groups in Butler County are 10 to 14 Years (722 | 8.1%) for men and 60 to 64 Years (830 | 8.3%) for women.
| Age Bracket | Male | Female |
| Under 5 Years | 520 (5.8%) | 534 (5.3%) |
| 5 to 9 Years | 602 (6.7%) | 478 (4.8%) |
| 10 to 14 Years | 722 (8.1%) | 641 (6.4%) |
| 15 to 19 Years | 624 (7.0%) | 436 (4.3%) |
| 20 to 24 Years | 540 (6.0%) | 618 (6.1%) |
| 25 to 29 Years | 557 (6.2%) | 524 (5.2%) |
| 30 to 34 Years | 456 (5.1%) | 585 (5.8%) |
| 35 to 39 Years | 583 (6.5%) | 602 (6.0%) |
| 40 to 44 Years | 560 (6.3%) | 649 (6.5%) |
| 45 to 49 Years | 444 (5.0%) | 596 (5.9%) |
| 50 to 54 Years | 504 (5.7%) | 626 (6.2%) |
| 55 to 59 Years | 627 (7.0%) | 561 (5.6%) |
| 60 to 64 Years | 541 (6.1%) | 830 (8.3%) |
| 65 to 69 Years | 643 (7.2%) | 801 (8.0%) |
| 70 to 74 Years | 376 (4.2%) | 476 (4.7%) |
| 75 to 79 Years | 275 (3.1%) | 524 (5.2%) |
| 80 to 84 Years | 215 (2.4%) | 291 (2.9%) |
| 85 Years and over | 139 (1.6%) | 281 (2.8%) |
| Total | 8,928 (100.0%) | 10,053 (100.0%) |
Families and Households in Butler County
Median Family Size in Butler County
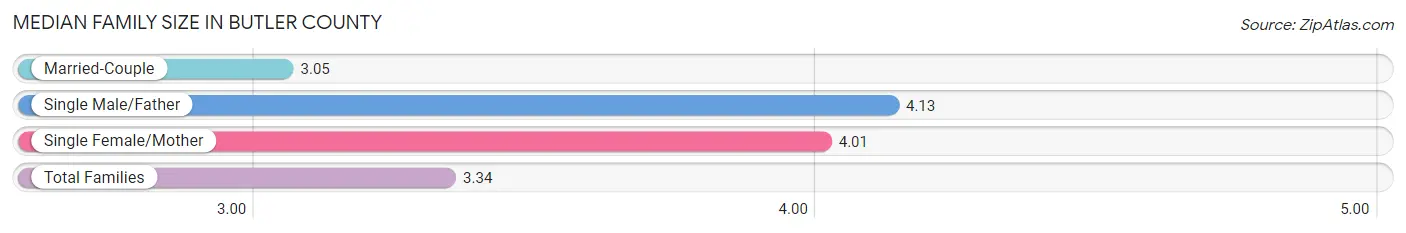
The median family size in Butler County is 3.34 persons per family, with single male/father families (196 | 4.2%) accounting for the largest median family size of 4.13 persons per family. On the other hand, married-couple families (3,241 | 70.2%) represent the smallest median family size with 3.05 persons per family.
| Family Type | # Families | Family Size |
| Married-Couple | 3,241 (70.2%) | 3.05 |
| Single Male/Father | 196 (4.2%) | 4.13 |
| Single Female/Mother | 1,183 (25.6%) | 4.01 |
| Total Families | 4,620 (100.0%) | 3.34 |
Median Household Size in Butler County
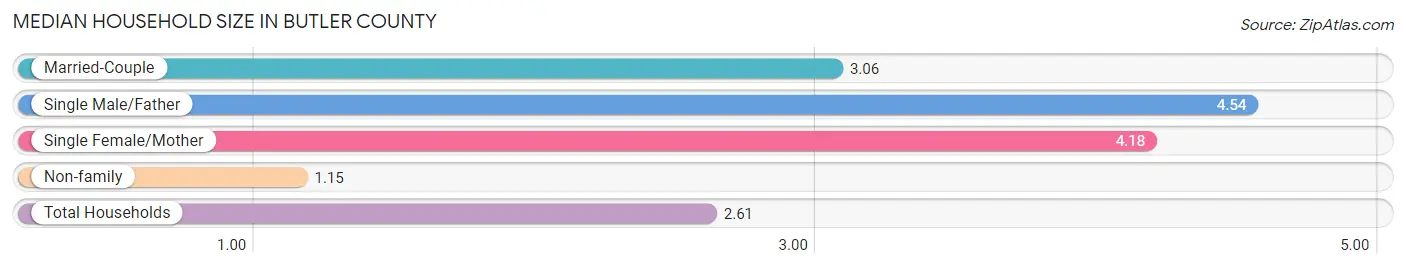
The median household size in Butler County is 2.61 persons per household, with single male/father households (196 | 2.8%) accounting for the largest median household size of 4.54 persons per household. non-family households (2,511 | 35.2%) represent the smallest median household size with 1.15 persons per household.
| Household Type | # Households | Household Size |
| Married-Couple | 3,241 (45.5%) | 3.06 |
| Single Male/Father | 196 (2.8%) | 4.54 |
| Single Female/Mother | 1,183 (16.6%) | 4.18 |
| Non-family | 2,511 (35.2%) | 1.15 |
| Total Households | 7,131 (100.0%) | 2.61 |
Household Size by Marriage Status in Butler County
Out of a total of 7,131 households in Butler County, 4,620 (64.8%) are family households, while 2,511 (35.2%) are nonfamily households. The most numerous type of family households are 2-person households, comprising 2,262, and the most common type of nonfamily households are 1-person households, comprising 2,263.
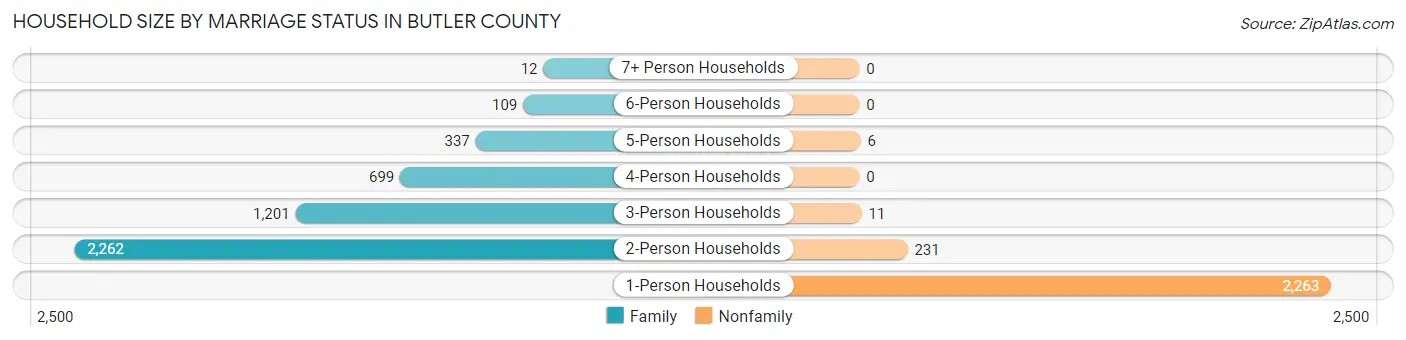
| Household Size | Family Households | Nonfamily Households |
| 1-Person Households | - | 2,263 (31.7%) |
| 2-Person Households | 2,262 (31.7%) | 231 (3.2%) |
| 3-Person Households | 1,201 (16.8%) | 11 (0.2%) |
| 4-Person Households | 699 (9.8%) | 0 (0.0%) |
| 5-Person Households | 337 (4.7%) | 6 (0.1%) |
| 6-Person Households | 109 (1.5%) | 0 (0.0%) |
| 7+ Person Households | 12 (0.2%) | 0 (0.0%) |
| Total | 4,620 (64.8%) | 2,511 (35.2%) |
Female Fertility in Butler County
Fertility by Age in Butler County
Average fertility rate in Butler County is 31.0 births per 1,000 women. Women in the age bracket of 20 to 34 years have the highest fertility rate with 69.0 births per 1,000 women. Women in the age bracket of 20 to 34 years acount for 93.7% of all women with births.
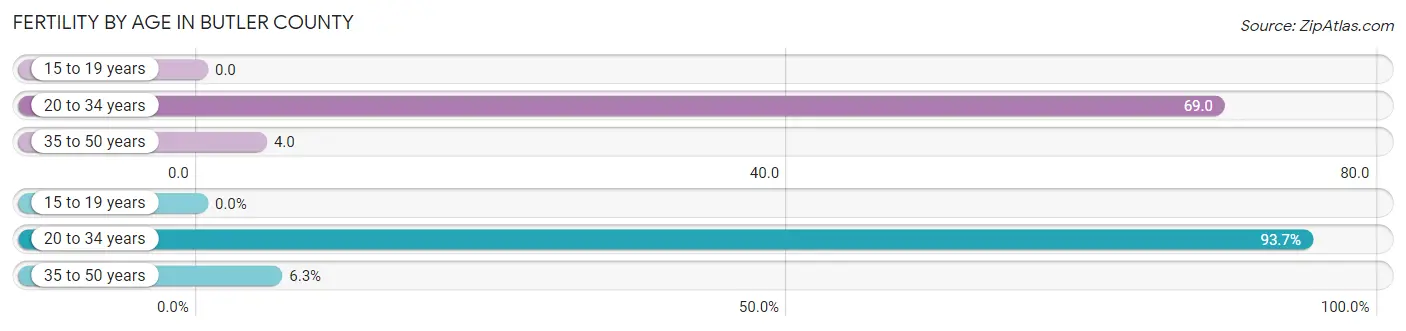
| Age Bracket | Women with Births | Births / 1,000 Women |
| 15 to 19 years | 0 (0.0%) | 0.0 |
| 20 to 34 years | 119 (93.7%) | 69.0 |
| 35 to 50 years | 8 (6.3%) | 4.0 |
| Total | 127 (100.0%) | 31.0 |
Fertility by Age by Marriage Status in Butler County
66.9% of women with births (127) in Butler County are married. The highest percentage of unmarried women with births falls into 20 to 34 years age bracket with 35.3% of them unmarried at the time of birth, while the lowest percentage of unmarried women with births belong to 35 to 50 years age bracket with 0.0% of them unmarried.
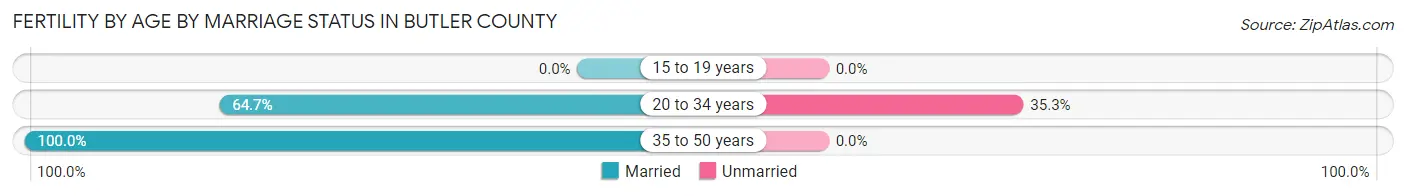
| Age Bracket | Married | Unmarried |
| 15 to 19 years | 0 (0.0%) | 0 (0.0%) |
| 20 to 34 years | 77 (64.7%) | 42 (35.3%) |
| 35 to 50 years | 8 (100.0%) | 0 (0.0%) |
| Total | 85 (66.9%) | 42 (33.1%) |
Fertility by Education in Butler County
Average fertility rate in Butler County is 31.0 births per 1,000 women. Women with the education attainment of high school diploma have the highest fertility rate of 34.0 births per 1,000 women, while women with the education attainment of bachelor's degree have the lowest fertility at 19.0 births per 1,000 women. Women with the education attainment of high school diploma represent 45.7% of all women with births.
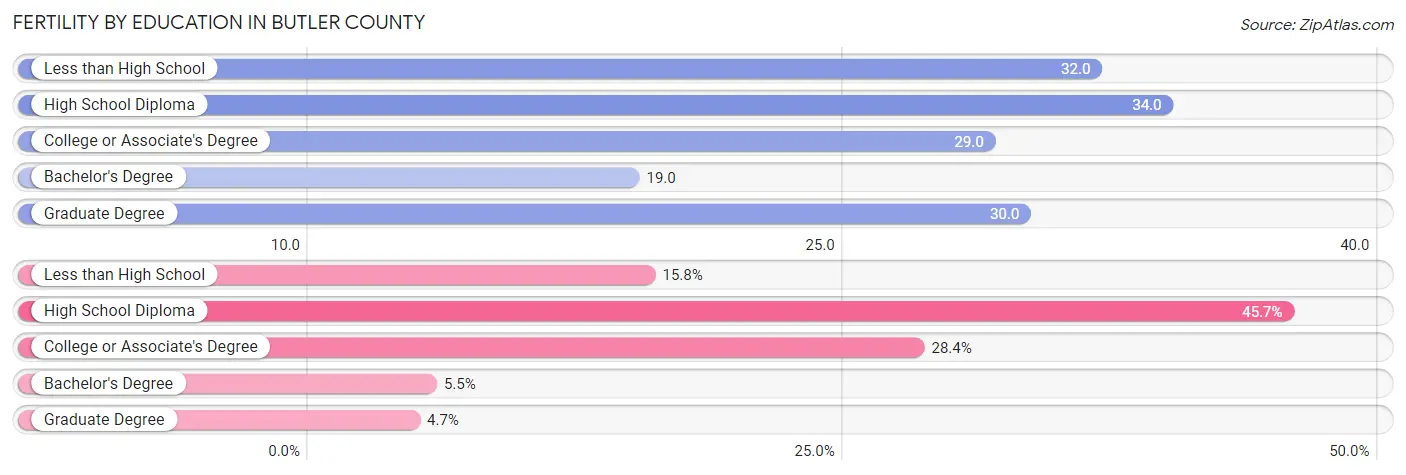
| Educational Attainment | Women with Births | Births / 1,000 Women |
| Less than High School | 20 (15.8%) | 32.0 |
| High School Diploma | 58 (45.7%) | 34.0 |
| College or Associate's Degree | 36 (28.3%) | 29.0 |
| Bachelor's Degree | 7 (5.5%) | 19.0 |
| Graduate Degree | 6 (4.7%) | 30.0 |
| Total | 127 (100.0%) | 31.0 |
Fertility by Education by Marriage Status in Butler County
33.1% of women with births in Butler County are unmarried. Women with the educational attainment of bachelor's degree are most likely to be married with 100.0% of them married at childbirth, while women with the educational attainment of less than high school are least likely to be married with 100.0% of them unmarried at childbirth.
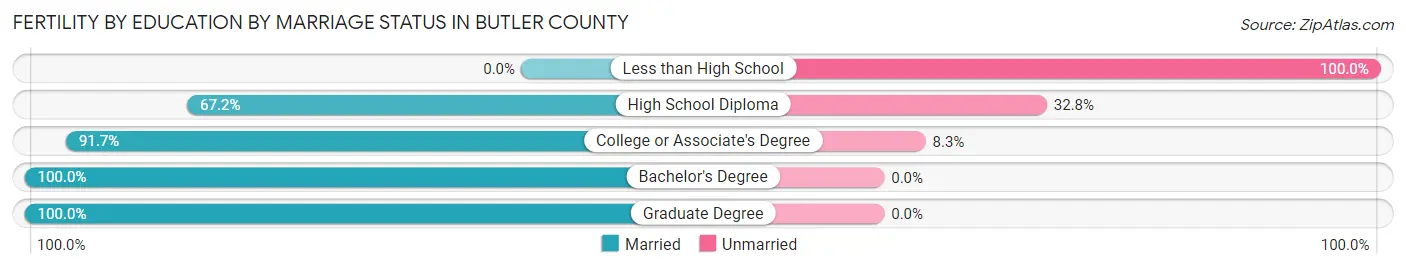
| Educational Attainment | Married | Unmarried |
| Less than High School | 0 (0.0%) | 20 (100.0%) |
| High School Diploma | 39 (67.2%) | 19 (32.8%) |
| College or Associate's Degree | 33 (91.7%) | 3 (8.3%) |
| Bachelor's Degree | 7 (100.0%) | 0 (0.0%) |
| Graduate Degree | 6 (100.0%) | 0 (0.0%) |
| Total | 85 (66.9%) | 42 (33.1%) |
Employment Characteristics in Butler County
Employment by Class of Employer in Butler County
Among the 7,394 employed individuals in Butler County, private company employees (5,577 | 75.4%), not-for-profit organizations (469 | 6.3%), and local government employees (394 | 5.3%) make up the most common classes of employment.
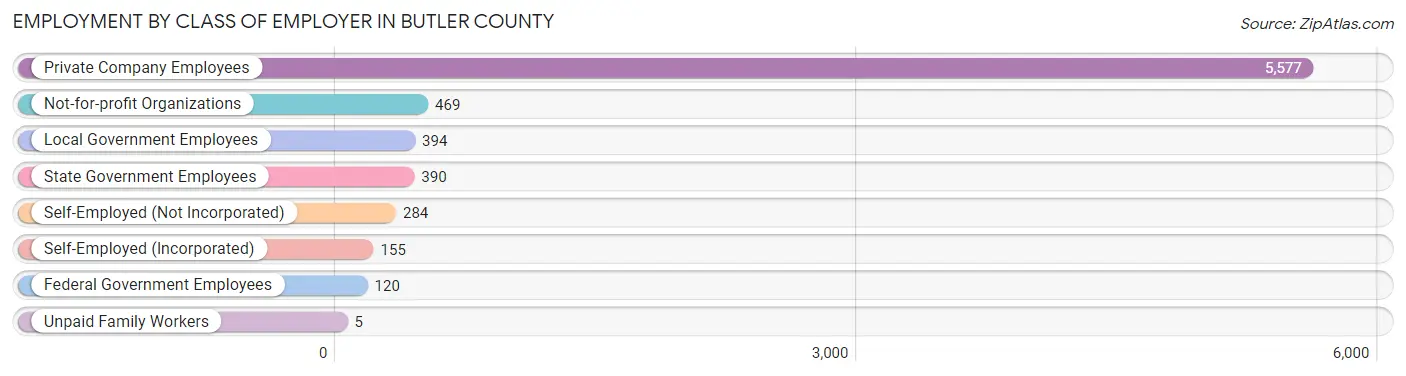
| Employer Class | # Employees | % Employees |
| Private Company Employees | 5,577 | 75.4% |
| Self-Employed (Incorporated) | 155 | 2.1% |
| Self-Employed (Not Incorporated) | 284 | 3.8% |
| Not-for-profit Organizations | 469 | 6.3% |
| Local Government Employees | 394 | 5.3% |
| State Government Employees | 390 | 5.3% |
| Federal Government Employees | 120 | 1.6% |
| Unpaid Family Workers | 5 | 0.1% |
| Total | 7,394 | 100.0% |
Employment Status by Age in Butler County
According to the labor force statistics for Butler County, out of the total population over 16 years of age (15,203), 52.9% or 8,042 individuals are in the labor force, with 6.8% or 547 of them unemployed. The age group with the highest labor force participation rate is 30 to 34 years, with 82.4% or 858 individuals in the labor force. Within the labor force, the 20 to 24 years age range has the highest percentage of unemployed individuals, with 21.7% or 188 of them being unemployed.
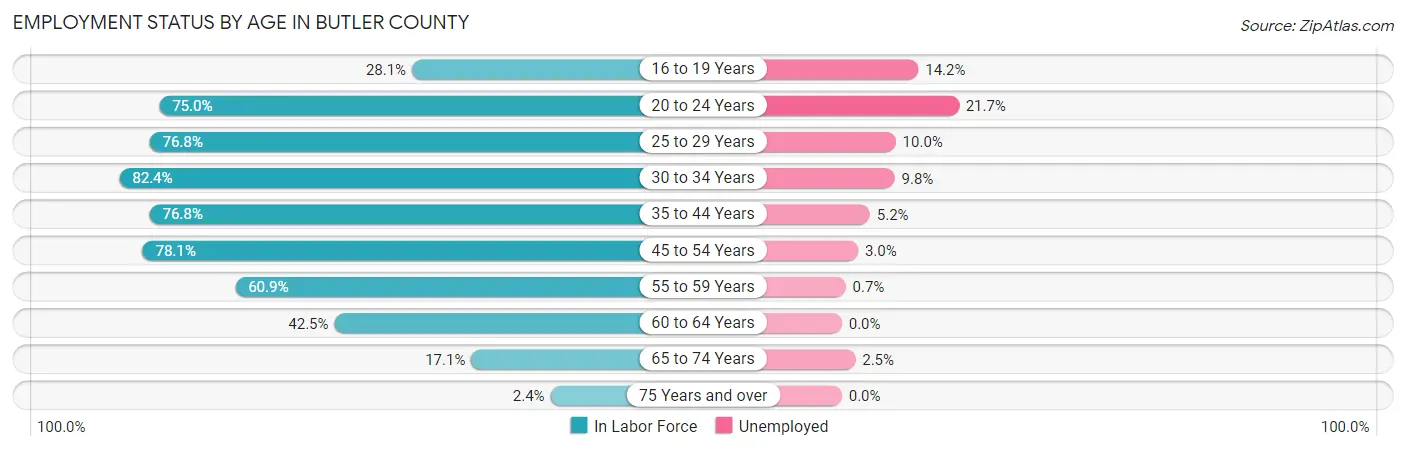
| Age Bracket | In Labor Force | Unemployed |
| 16 to 19 Years | 219 (28.1%) | 31 (14.2%) |
| 20 to 24 Years | 868 (75.0%) | 188 (21.7%) |
| 25 to 29 Years | 830 (76.8%) | 83 (10.0%) |
| 30 to 34 Years | 858 (82.4%) | 84 (9.8%) |
| 35 to 44 Years | 1,839 (76.8%) | 96 (5.2%) |
| 45 to 54 Years | 1,695 (78.1%) | 51 (3.0%) |
| 55 to 59 Years | 723 (60.9%) | 5 (0.7%) |
| 60 to 64 Years | 583 (42.5%) | 0 (0.0%) |
| 65 to 74 Years | 393 (17.1%) | 10 (2.5%) |
| 75 Years and over | 41 (2.4%) | 0 (0.0%) |
| Total | 8,042 (52.9%) | 547 (6.8%) |
Employment Status by Educational Attainment in Butler County
According to labor force statistics for Butler County, 70.6% of individuals (6,527) out of the total population between 25 and 64 years of age (9,245) are in the labor force, with 4.9% or 320 of them being unemployed. The group with the highest labor force participation rate are those with the educational attainment of bachelor's degree or higher, with 92.8% or 1,145 individuals in the labor force. Within the labor force, individuals with less than high school education have the highest percentage of unemployment, with 13.3% or 85 of them being unemployed.
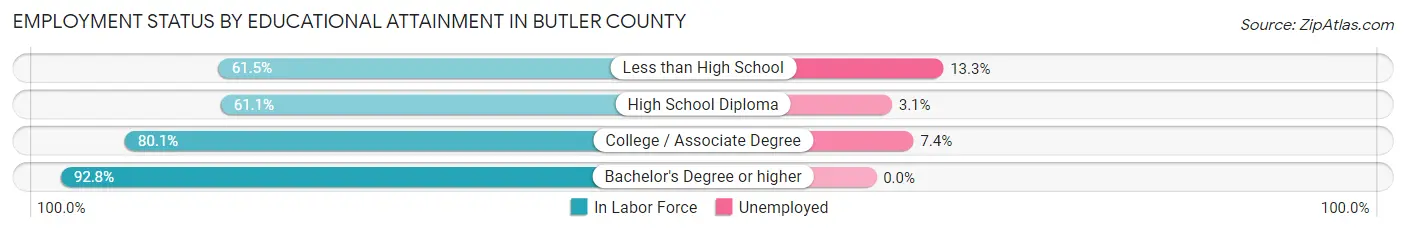
| Educational Attainment | In Labor Force | Unemployed |
| Less than High School | 640 (61.5%) | 138 (13.3%) |
| High School Diploma | 2,710 (61.1%) | 137 (3.1%) |
| College / Associate Degree | 2,031 (80.1%) | 188 (7.4%) |
| Bachelor's Degree or higher | 1,145 (92.8%) | 0 (0.0%) |
| Total | 6,527 (70.6%) | 453 (4.9%) |
Employment Occupations by Sex in Butler County
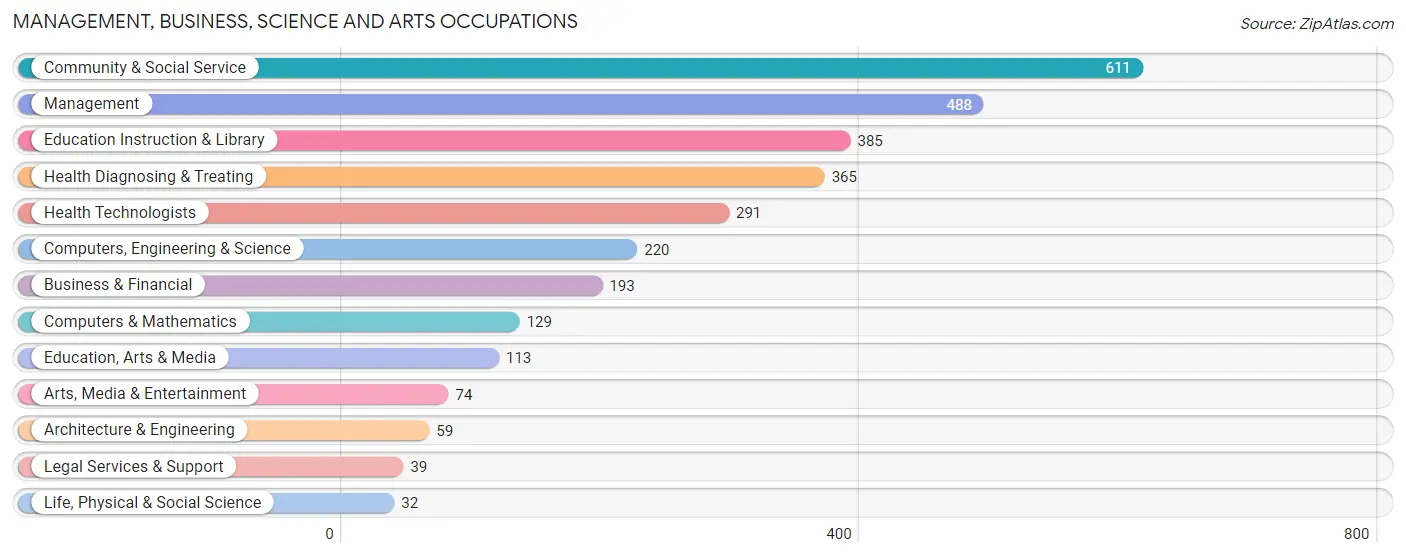
Management, Business, Science and Arts Occupations
The most common Management, Business, Science and Arts occupations in Butler County are Community & Social Service (611 | 8.2%), Management (488 | 6.5%), Education Instruction & Library (385 | 5.1%), Health Diagnosing & Treating (365 | 4.9%), and Health Technologists (291 | 3.9%).
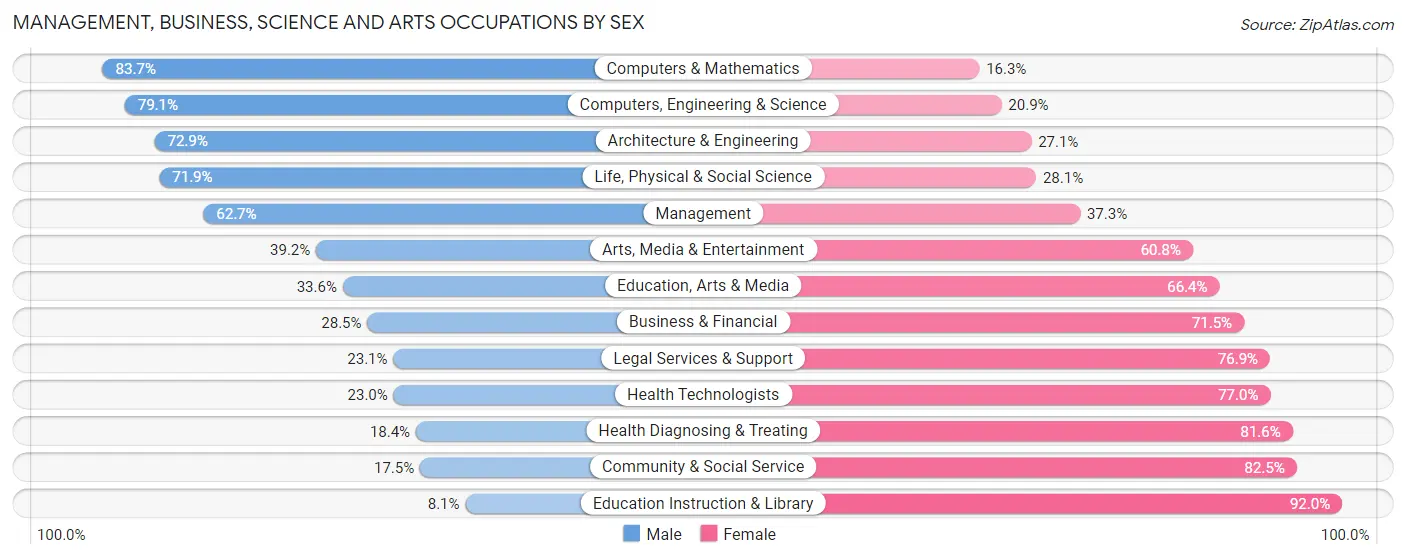
Management, Business, Science and Arts Occupations by Sex
Within the Management, Business, Science and Arts occupations in Butler County, the most male-oriented occupations are Computers & Mathematics (83.7%), Computers, Engineering & Science (79.1%), and Architecture & Engineering (72.9%), while the most female-oriented occupations are Education Instruction & Library (91.9%), Community & Social Service (82.5%), and Health Diagnosing & Treating (81.6%).
| Occupation | Male | Female |
| Management | 306 (62.7%) | 182 (37.3%) |
| Business & Financial | 55 (28.5%) | 138 (71.5%) |
| Computers, Engineering & Science | 174 (79.1%) | 46 (20.9%) |
| Computers & Mathematics | 108 (83.7%) | 21 (16.3%) |
| Architecture & Engineering | 43 (72.9%) | 16 (27.1%) |
| Life, Physical & Social Science | 23 (71.9%) | 9 (28.1%) |
| Community & Social Service | 107 (17.5%) | 504 (82.5%) |
| Education, Arts & Media | 38 (33.6%) | 75 (66.4%) |
| Legal Services & Support | 9 (23.1%) | 30 (76.9%) |
| Education Instruction & Library | 31 (8.1%) | 354 (91.9%) |
| Arts, Media & Entertainment | 29 (39.2%) | 45 (60.8%) |
| Health Diagnosing & Treating | 67 (18.4%) | 298 (81.6%) |
| Health Technologists | 67 (23.0%) | 224 (77.0%) |
| Total (Category) | 709 (37.8%) | 1,168 (62.2%) |
| Total (Overall) | 3,541 (47.2%) | 3,954 (52.8%) |
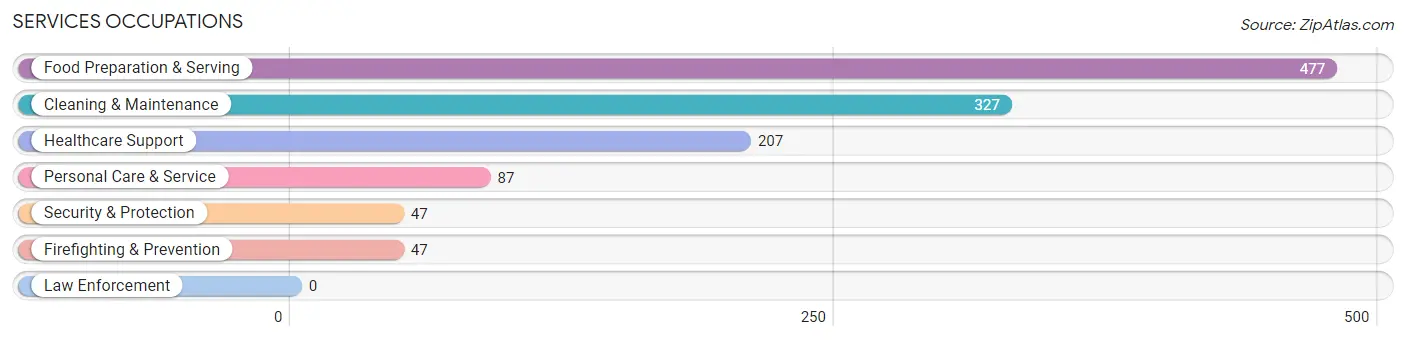
Services Occupations
The most common Services occupations in Butler County are Food Preparation & Serving (477 | 6.4%), Cleaning & Maintenance (327 | 4.4%), Healthcare Support (207 | 2.8%), Personal Care & Service (87 | 1.2%), and Security & Protection (47 | 0.6%).
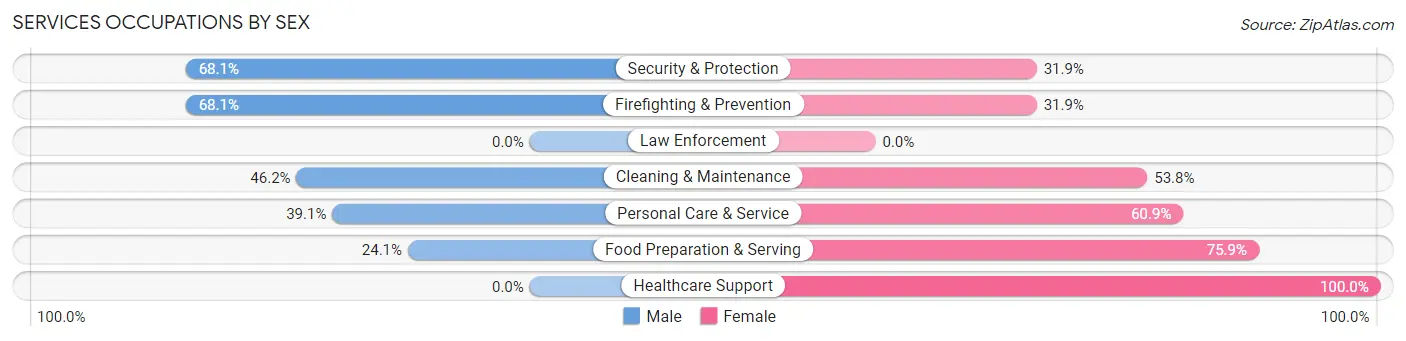
Services Occupations by Sex
Within the Services occupations in Butler County, the most male-oriented occupations are Security & Protection (68.1%), Firefighting & Prevention (68.1%), and Cleaning & Maintenance (46.2%), while the most female-oriented occupations are Healthcare Support (100.0%), Food Preparation & Serving (75.9%), and Personal Care & Service (60.9%).
| Occupation | Male | Female |
| Healthcare Support | 0 (0.0%) | 207 (100.0%) |
| Security & Protection | 32 (68.1%) | 15 (31.9%) |
| Firefighting & Prevention | 32 (68.1%) | 15 (31.9%) |
| Law Enforcement | 0 (0.0%) | 0 (0.0%) |
| Food Preparation & Serving | 115 (24.1%) | 362 (75.9%) |
| Cleaning & Maintenance | 151 (46.2%) | 176 (53.8%) |
| Personal Care & Service | 34 (39.1%) | 53 (60.9%) |
| Total (Category) | 332 (29.0%) | 813 (71.0%) |
| Total (Overall) | 3,541 (47.2%) | 3,954 (52.8%) |
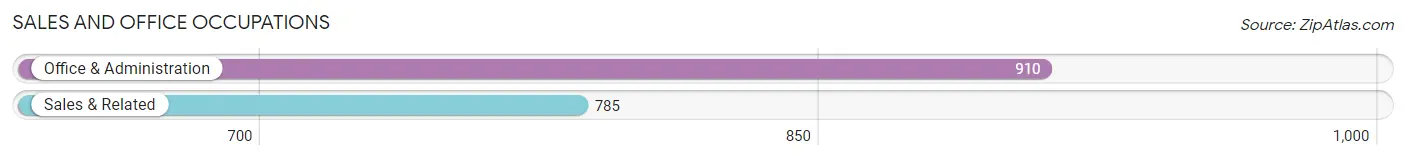
Sales and Office Occupations
The most common Sales and Office occupations in Butler County are Office & Administration (910 | 12.1%), and Sales & Related (785 | 10.5%).
Sales and Office Occupations by Sex
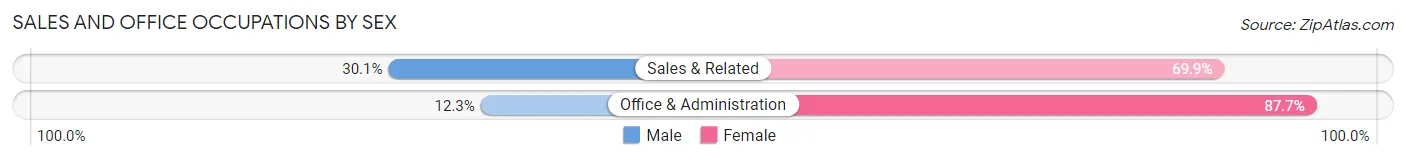
| Occupation | Male | Female |
| Sales & Related | 236 (30.1%) | 549 (69.9%) |
| Office & Administration | 112 (12.3%) | 798 (87.7%) |
| Total (Category) | 348 (20.5%) | 1,347 (79.5%) |
| Total (Overall) | 3,541 (47.2%) | 3,954 (52.8%) |
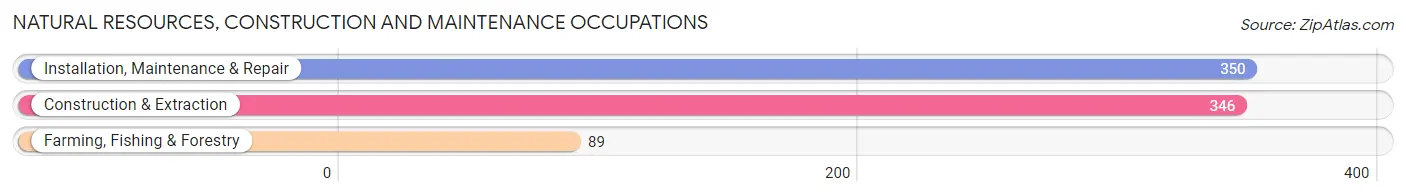
Natural Resources, Construction and Maintenance Occupations
The most common Natural Resources, Construction and Maintenance occupations in Butler County are Installation, Maintenance & Repair (350 | 4.7%), Construction & Extraction (346 | 4.6%), and Farming, Fishing & Forestry (89 | 1.2%).
Natural Resources, Construction and Maintenance Occupations by Sex
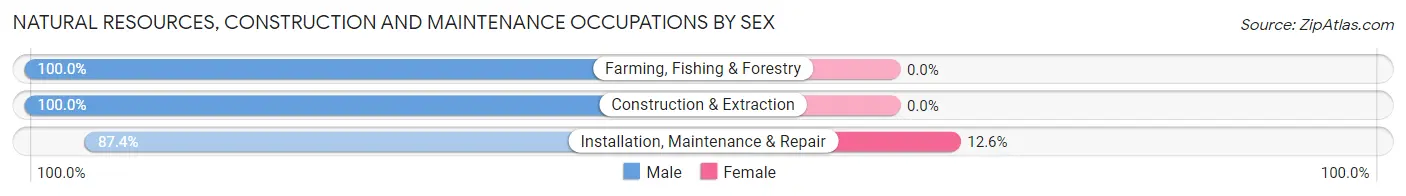
| Occupation | Male | Female |
| Farming, Fishing & Forestry | 89 (100.0%) | 0 (0.0%) |
| Construction & Extraction | 346 (100.0%) | 0 (0.0%) |
| Installation, Maintenance & Repair | 306 (87.4%) | 44 (12.6%) |
| Total (Category) | 741 (94.4%) | 44 (5.6%) |
| Total (Overall) | 3,541 (47.2%) | 3,954 (52.8%) |
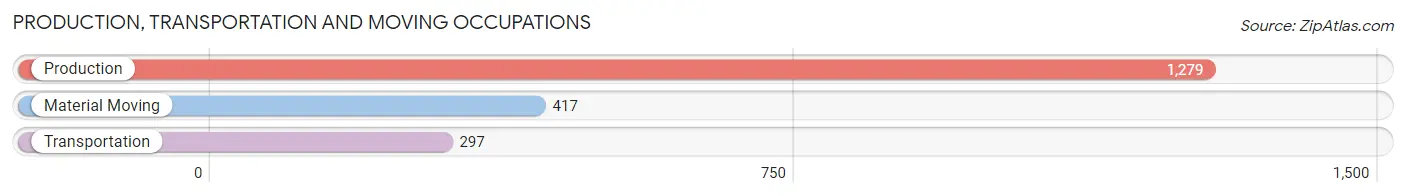
Production, Transportation and Moving Occupations
The most common Production, Transportation and Moving occupations in Butler County are Production (1,279 | 17.1%), Material Moving (417 | 5.6%), and Transportation (297 | 4.0%).
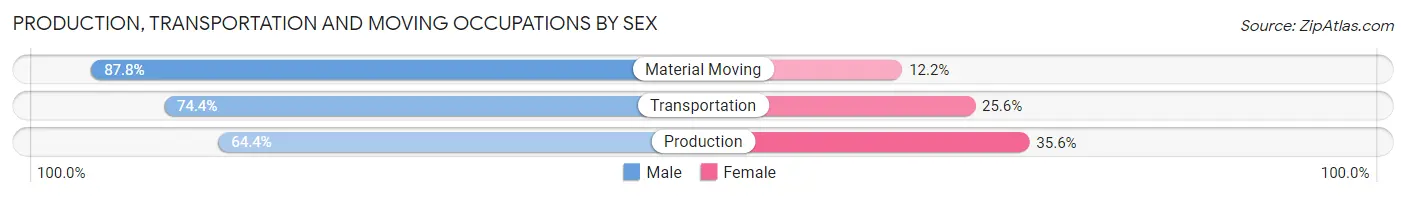
Production, Transportation and Moving Occupations by Sex
| Occupation | Male | Female |
| Production | 824 (64.4%) | 455 (35.6%) |
| Transportation | 221 (74.4%) | 76 (25.6%) |
| Material Moving | 366 (87.8%) | 51 (12.2%) |
| Total (Category) | 1,411 (70.8%) | 582 (29.2%) |
| Total (Overall) | 3,541 (47.2%) | 3,954 (52.8%) |
Employment Industries by Sex in Butler County
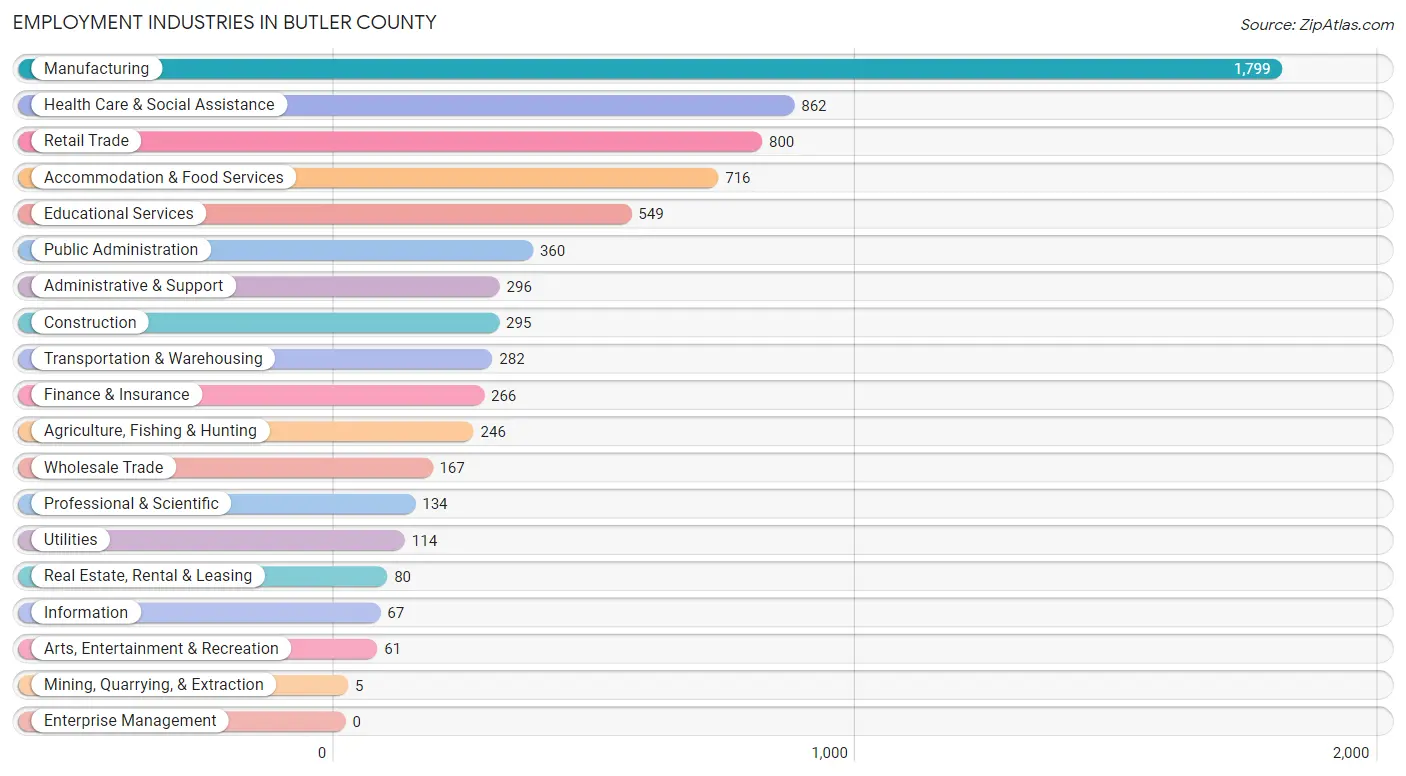
Employment Industries in Butler County
The major employment industries in Butler County include Manufacturing (1,799 | 24.0%), Health Care & Social Assistance (862 | 11.5%), Retail Trade (800 | 10.7%), Accommodation & Food Services (716 | 9.6%), and Educational Services (549 | 7.3%).
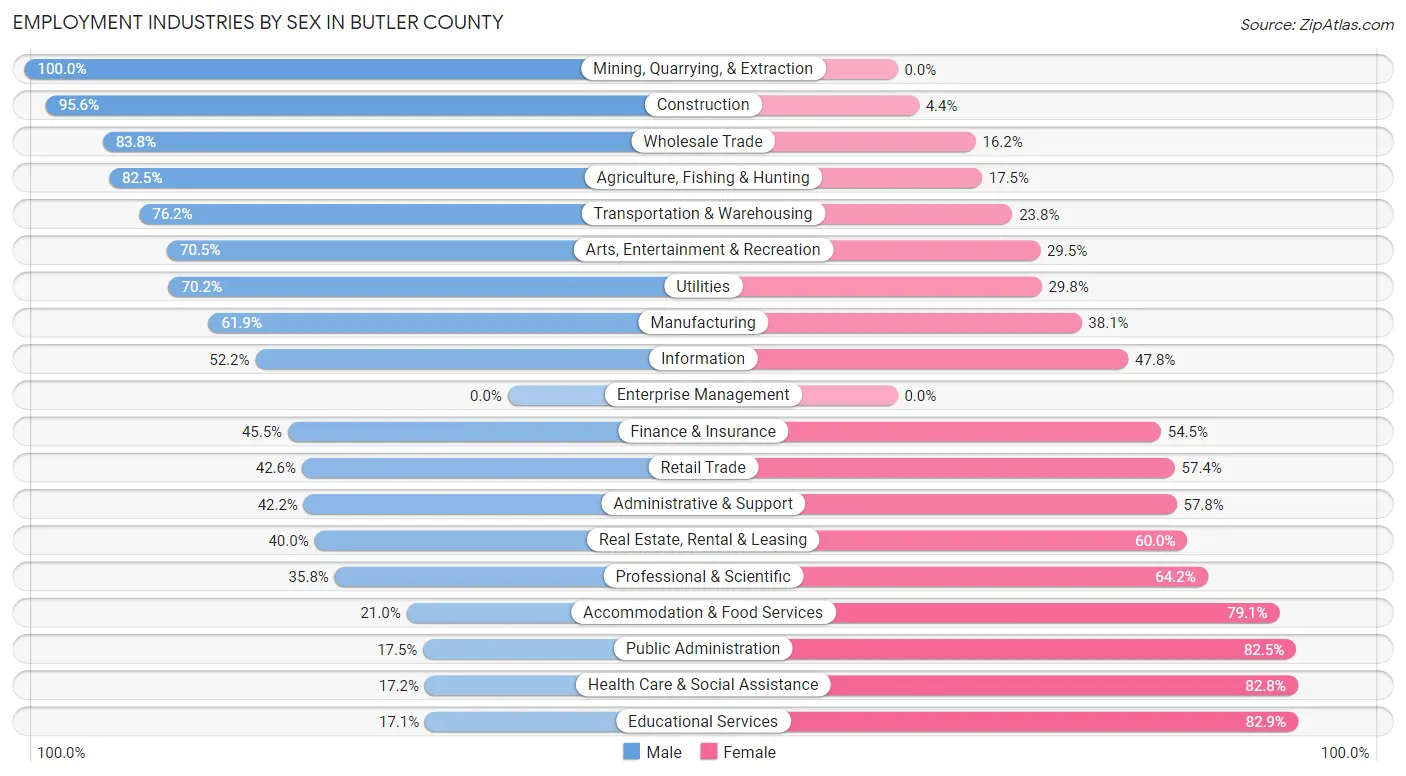
Employment Industries by Sex in Butler County
The Butler County industries that see more men than women are Mining, Quarrying, & Extraction (100.0%), Construction (95.6%), and Wholesale Trade (83.8%), whereas the industries that tend to have a higher number of women are Educational Services (82.9%), Health Care & Social Assistance (82.8%), and Public Administration (82.5%).
| Industry | Male | Female |
| Agriculture, Fishing & Hunting | 203 (82.5%) | 43 (17.5%) |
| Mining, Quarrying, & Extraction | 5 (100.0%) | 0 (0.0%) |
| Construction | 282 (95.6%) | 13 (4.4%) |
| Manufacturing | 1,114 (61.9%) | 685 (38.1%) |
| Wholesale Trade | 140 (83.8%) | 27 (16.2%) |
| Retail Trade | 341 (42.6%) | 459 (57.4%) |
| Transportation & Warehousing | 215 (76.2%) | 67 (23.8%) |
| Utilities | 80 (70.2%) | 34 (29.8%) |
| Information | 35 (52.2%) | 32 (47.8%) |
| Finance & Insurance | 121 (45.5%) | 145 (54.5%) |
| Real Estate, Rental & Leasing | 32 (40.0%) | 48 (60.0%) |
| Professional & Scientific | 48 (35.8%) | 86 (64.2%) |
| Enterprise Management | 0 (0.0%) | 0 (0.0%) |
| Administrative & Support | 125 (42.2%) | 171 (57.8%) |
| Educational Services | 94 (17.1%) | 455 (82.9%) |
| Health Care & Social Assistance | 148 (17.2%) | 714 (82.8%) |
| Arts, Entertainment & Recreation | 43 (70.5%) | 18 (29.5%) |
| Accommodation & Food Services | 150 (20.9%) | 566 (79.0%) |
| Public Administration | 63 (17.5%) | 297 (82.5%) |
| Total | 3,541 (47.2%) | 3,954 (52.8%) |
Education in Butler County
School Enrollment in Butler County
The most common levels of schooling among the 3,965 students in Butler County are middle school (1,026 | 25.9%), high school (939 | 23.7%), and elementary school (936 | 23.6%).
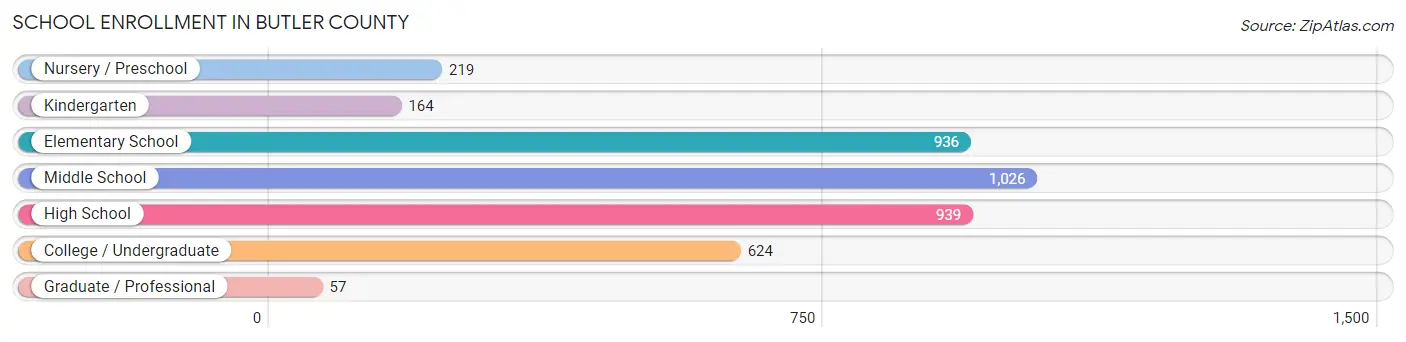
| School Level | # Students | % Students |
| Nursery / Preschool | 219 | 5.5% |
| Kindergarten | 164 | 4.1% |
| Elementary School | 936 | 23.6% |
| Middle School | 1,026 | 25.9% |
| High School | 939 | 23.7% |
| College / Undergraduate | 624 | 15.7% |
| Graduate / Professional | 57 | 1.4% |
| Total | 3,965 | 100.0% |
School Enrollment by Age by Funding Source in Butler County
Out of a total of 3,965 students who are enrolled in schools in Butler County, 726 (18.3%) attend a private institution, while the remaining 3,239 (81.7%) are enrolled in public schools. The age group of 3 to 4 year olds has the highest likelihood of being enrolled in private schools, with 53 (36.0% in the age bracket) enrolled. Conversely, the age group of 25 to 34 year olds has the lowest likelihood of being enrolled in a private school, with 124 (98.4% in the age bracket) attending a public institution.
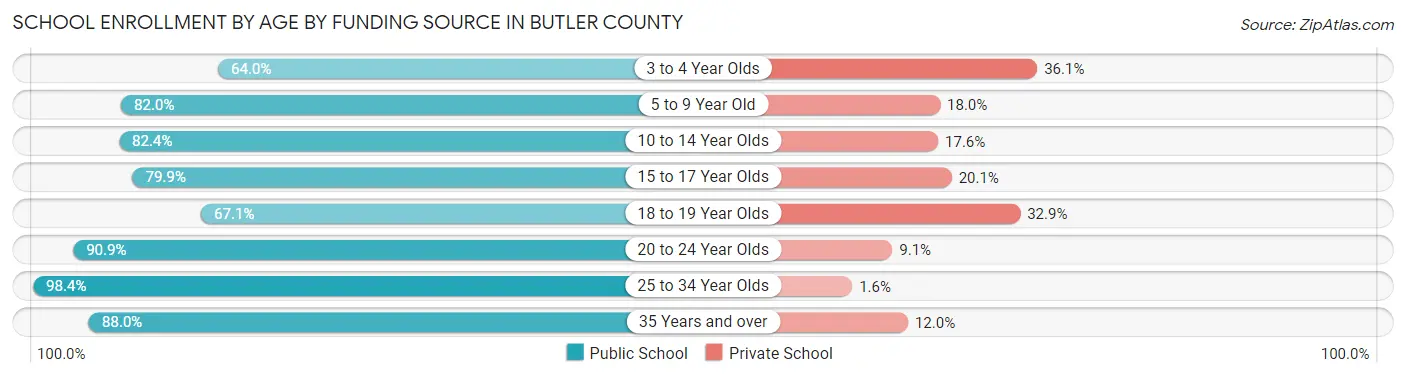
| Age Bracket | Public School | Private School |
| 3 to 4 Year Olds | 94 (63.9%) | 53 (36.0%) |
| 5 to 9 Year Old | 827 (82.0%) | 181 (18.0%) |
| 10 to 14 Year Olds | 1,068 (82.4%) | 228 (17.6%) |
| 15 to 17 Year Olds | 544 (79.9%) | 137 (20.1%) |
| 18 to 19 Year Olds | 151 (67.1%) | 74 (32.9%) |
| 20 to 24 Year Olds | 241 (90.9%) | 24 (9.1%) |
| 25 to 34 Year Olds | 124 (98.4%) | 2 (1.6%) |
| 35 Years and over | 191 (88.0%) | 26 (12.0%) |
| Total | 3,239 (81.7%) | 726 (18.3%) |
Educational Attainment by Field of Study in Butler County
Education (427 | 22.8%), business (417 | 22.3%), science & technology (292 | 15.6%), arts & humanities (179 | 9.6%), and bio, nature & agricultural (140 | 7.5%) are the most common fields of study among 1,872 individuals in Butler County who have obtained a bachelor's degree or higher.
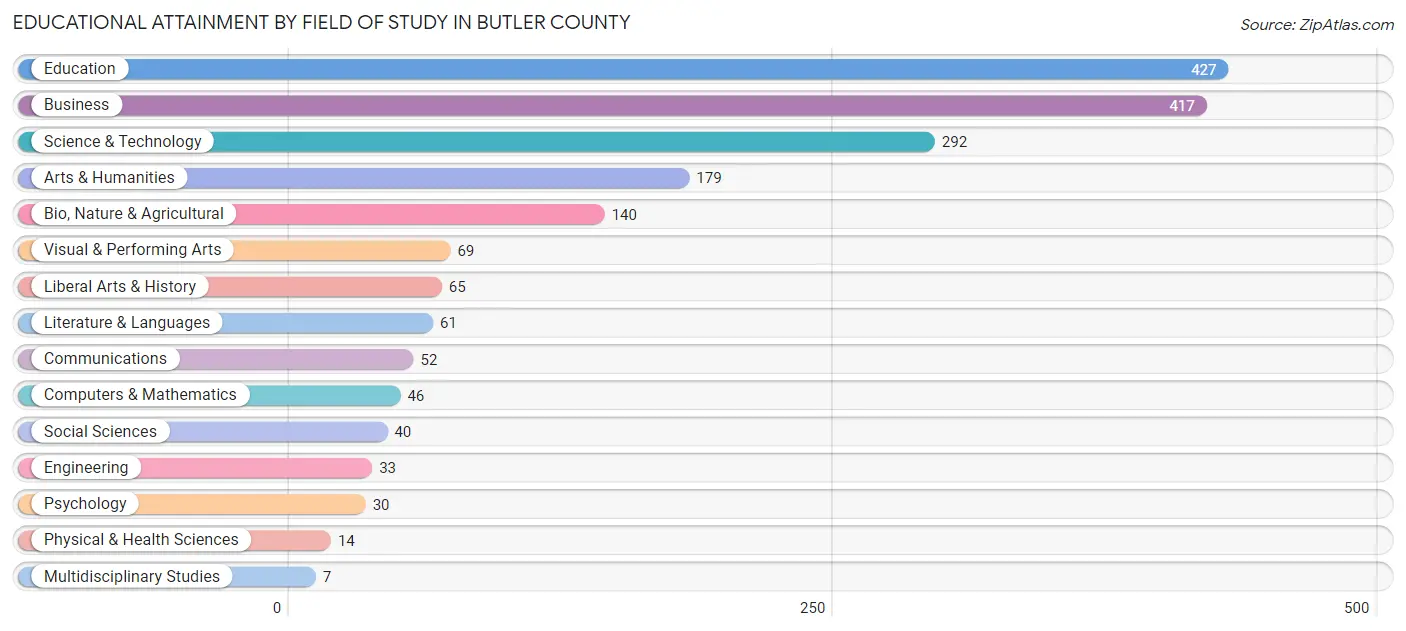
| Field of Study | # Graduates | % Graduates |
| Computers & Mathematics | 46 | 2.5% |
| Bio, Nature & Agricultural | 140 | 7.5% |
| Physical & Health Sciences | 14 | 0.7% |
| Psychology | 30 | 1.6% |
| Social Sciences | 40 | 2.1% |
| Engineering | 33 | 1.8% |
| Multidisciplinary Studies | 7 | 0.4% |
| Science & Technology | 292 | 15.6% |
| Business | 417 | 22.3% |
| Education | 427 | 22.8% |
| Literature & Languages | 61 | 3.3% |
| Liberal Arts & History | 65 | 3.5% |
| Visual & Performing Arts | 69 | 3.7% |
| Communications | 52 | 2.8% |
| Arts & Humanities | 179 | 9.6% |
| Total | 1,872 | 100.0% |
Transportation & Commute in Butler County
Vehicle Availability by Sex in Butler County
The most prevalent vehicle ownership categories in Butler County are males with 2 vehicles (1,347, accounting for 38.4%) and females with 2 vehicles (1,544, making up 34.6%).
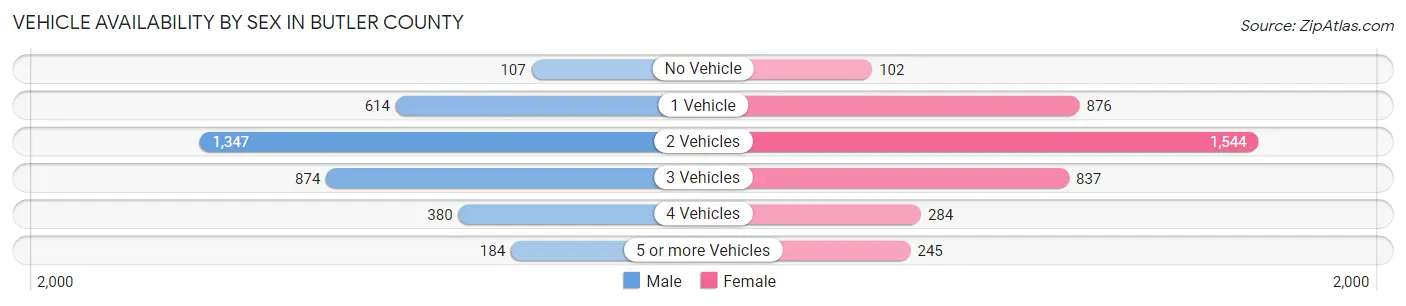
| Vehicles Available | Male | Female |
| No Vehicle | 107 (3.0%) | 102 (2.6%) |
| 1 Vehicle | 614 (17.5%) | 876 (22.5%) |
| 2 Vehicles | 1,347 (38.4%) | 1,544 (39.7%) |
| 3 Vehicles | 874 (24.9%) | 837 (21.5%) |
| 4 Vehicles | 380 (10.8%) | 284 (7.3%) |
| 5 or more Vehicles | 184 (5.2%) | 245 (6.3%) |
| Total | 3,506 (100.0%) | 3,888 (100.0%) |
Commute Time in Butler County
The most frequently occuring commute durations in Butler County are 5 to 9 minutes (1,152 commuters, 16.2%), 15 to 19 minutes (981 commuters, 13.8%), and 30 to 34 minutes (965 commuters, 13.6%).
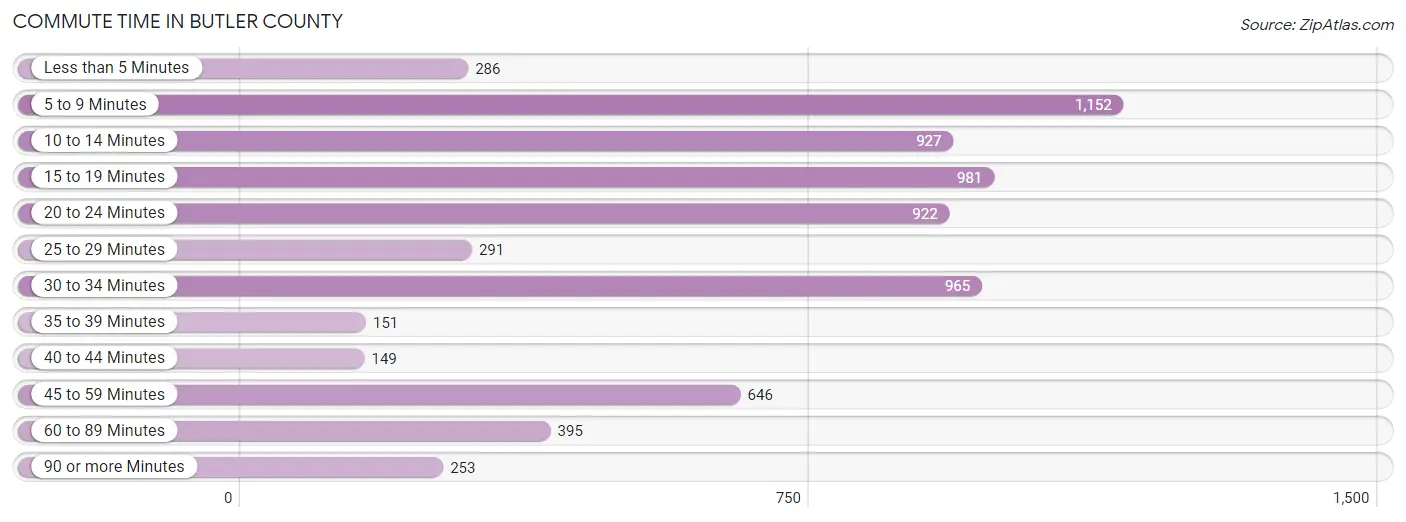
| Commute Time | # Commuters | % Commuters |
| Less than 5 Minutes | 286 | 4.0% |
| 5 to 9 Minutes | 1,152 | 16.2% |
| 10 to 14 Minutes | 927 | 13.0% |
| 15 to 19 Minutes | 981 | 13.8% |
| 20 to 24 Minutes | 922 | 13.0% |
| 25 to 29 Minutes | 291 | 4.1% |
| 30 to 34 Minutes | 965 | 13.6% |
| 35 to 39 Minutes | 151 | 2.1% |
| 40 to 44 Minutes | 149 | 2.1% |
| 45 to 59 Minutes | 646 | 9.1% |
| 60 to 89 Minutes | 395 | 5.6% |
| 90 or more Minutes | 253 | 3.5% |
Commute Time by Sex in Butler County
The most common commute times in Butler County are 5 to 9 minutes (576 commuters, 17.1%) for males and 20 to 24 minutes (624 commuters, 16.6%) for females.
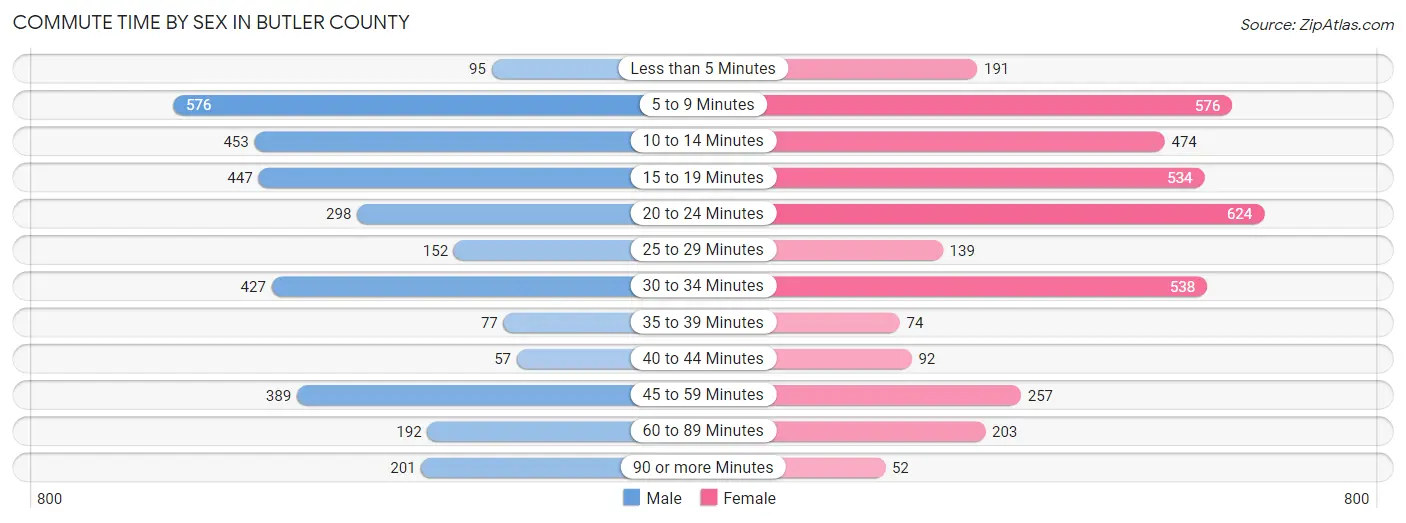
| Commute Time | Male | Female |
| Less than 5 Minutes | 95 (2.8%) | 191 (5.1%) |
| 5 to 9 Minutes | 576 (17.1%) | 576 (15.3%) |
| 10 to 14 Minutes | 453 (13.5%) | 474 (12.6%) |
| 15 to 19 Minutes | 447 (13.3%) | 534 (14.2%) |
| 20 to 24 Minutes | 298 (8.9%) | 624 (16.6%) |
| 25 to 29 Minutes | 152 (4.5%) | 139 (3.7%) |
| 30 to 34 Minutes | 427 (12.7%) | 538 (14.3%) |
| 35 to 39 Minutes | 77 (2.3%) | 74 (2.0%) |
| 40 to 44 Minutes | 57 (1.7%) | 92 (2.5%) |
| 45 to 59 Minutes | 389 (11.6%) | 257 (6.9%) |
| 60 to 89 Minutes | 192 (5.7%) | 203 (5.4%) |
| 90 or more Minutes | 201 (6.0%) | 52 (1.4%) |
Time of Departure to Work by Sex in Butler County
The most frequent times of departure to work in Butler County are 7:00 AM to 7:29 AM (629, 18.7%) for males and 7:00 AM to 7:29 AM (800, 21.3%) for females.
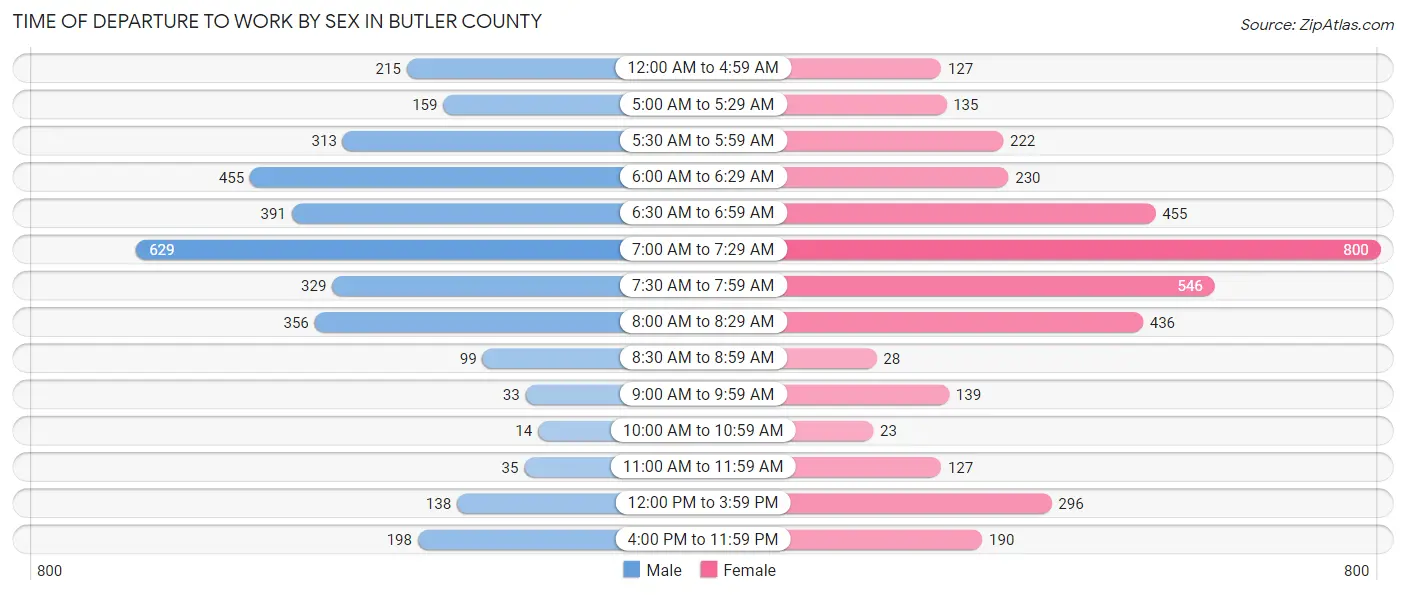
| Time of Departure | Male | Female |
| 12:00 AM to 4:59 AM | 215 (6.4%) | 127 (3.4%) |
| 5:00 AM to 5:29 AM | 159 (4.7%) | 135 (3.6%) |
| 5:30 AM to 5:59 AM | 313 (9.3%) | 222 (5.9%) |
| 6:00 AM to 6:29 AM | 455 (13.5%) | 230 (6.1%) |
| 6:30 AM to 6:59 AM | 391 (11.6%) | 455 (12.1%) |
| 7:00 AM to 7:29 AM | 629 (18.7%) | 800 (21.3%) |
| 7:30 AM to 7:59 AM | 329 (9.8%) | 546 (14.5%) |
| 8:00 AM to 8:29 AM | 356 (10.6%) | 436 (11.6%) |
| 8:30 AM to 8:59 AM | 99 (2.9%) | 28 (0.7%) |
| 9:00 AM to 9:59 AM | 33 (1.0%) | 139 (3.7%) |
| 10:00 AM to 10:59 AM | 14 (0.4%) | 23 (0.6%) |
| 11:00 AM to 11:59 AM | 35 (1.0%) | 127 (3.4%) |
| 12:00 PM to 3:59 PM | 138 (4.1%) | 296 (7.9%) |
| 4:00 PM to 11:59 PM | 198 (5.9%) | 190 (5.1%) |
| Total | 3,364 (100.0%) | 3,754 (100.0%) |
Housing Occupancy in Butler County
Occupancy by Ownership in Butler County
Of the total 7,131 dwellings in Butler County, owner-occupied units account for 5,047 (70.8%), while renter-occupied units make up 2,084 (29.2%).
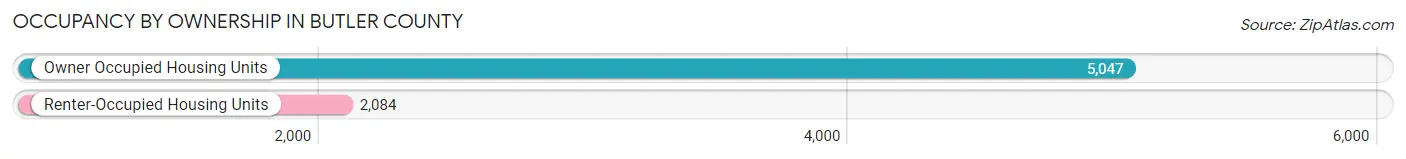
| Occupancy | # Housing Units | % Housing Units |
| Owner Occupied Housing Units | 5,047 | 70.8% |
| Renter-Occupied Housing Units | 2,084 | 29.2% |
| Total Occupied Housing Units | 7,131 | 100.0% |
Occupancy by Household Size in Butler County
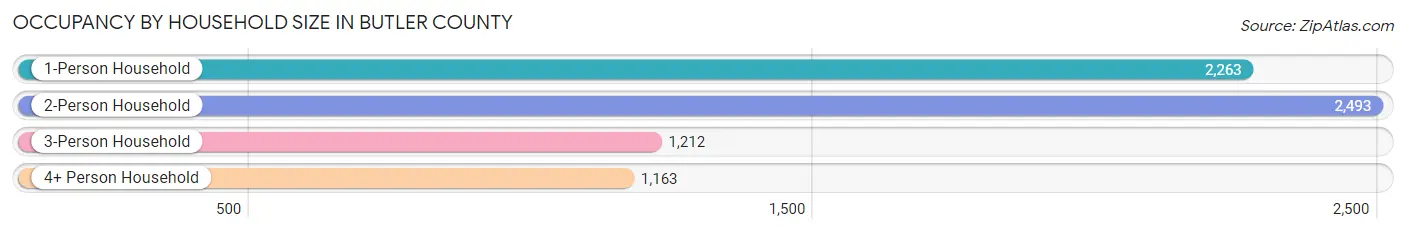
| Household Size | # Housing Units | % Housing Units |
| 1-Person Household | 2,263 | 31.7% |
| 2-Person Household | 2,493 | 35.0% |
| 3-Person Household | 1,212 | 17.0% |
| 4+ Person Household | 1,163 | 16.3% |
| Total Housing Units | 7,131 | 100.0% |
Occupancy by Ownership by Household Size in Butler County
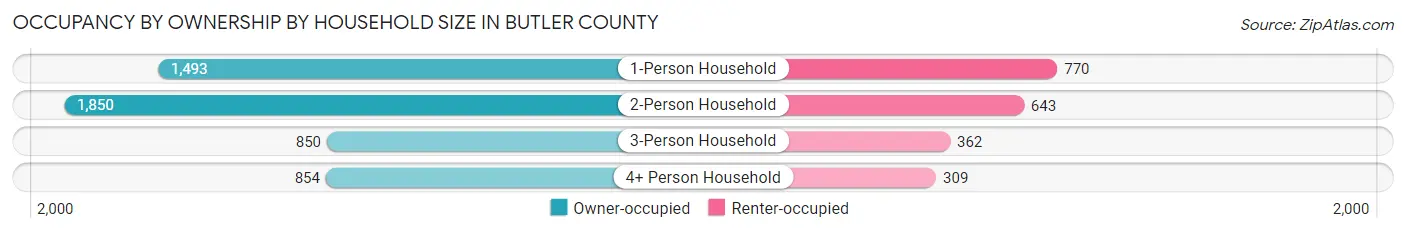
| Household Size | Owner-occupied | Renter-occupied |
| 1-Person Household | 1,493 (66.0%) | 770 (34.0%) |
| 2-Person Household | 1,850 (74.2%) | 643 (25.8%) |
| 3-Person Household | 850 (70.1%) | 362 (29.9%) |
| 4+ Person Household | 854 (73.4%) | 309 (26.6%) |
| Total Housing Units | 5,047 (70.8%) | 2,084 (29.2%) |
Occupancy by Educational Attainment in Butler County
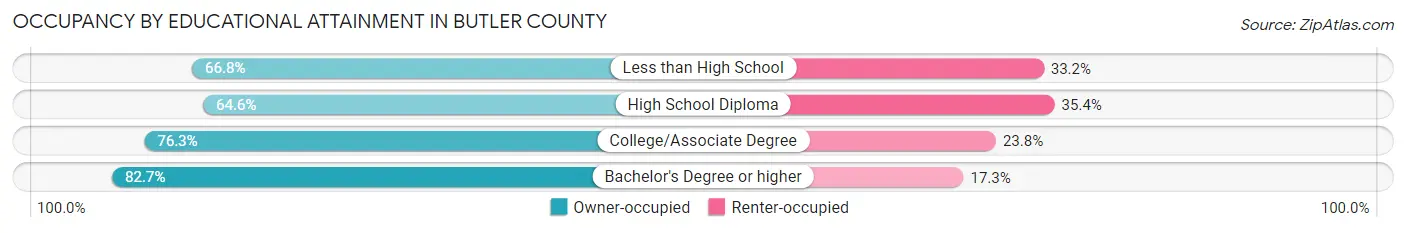
| Household Size | Owner-occupied | Renter-occupied |
| Less than High School | 452 (66.8%) | 225 (33.2%) |
| High School Diploma | 2,169 (64.6%) | 1,188 (35.4%) |
| College/Associate Degree | 1,596 (76.2%) | 497 (23.7%) |
| Bachelor's Degree or higher | 830 (82.7%) | 174 (17.3%) |
Occupancy by Age of Householder in Butler County
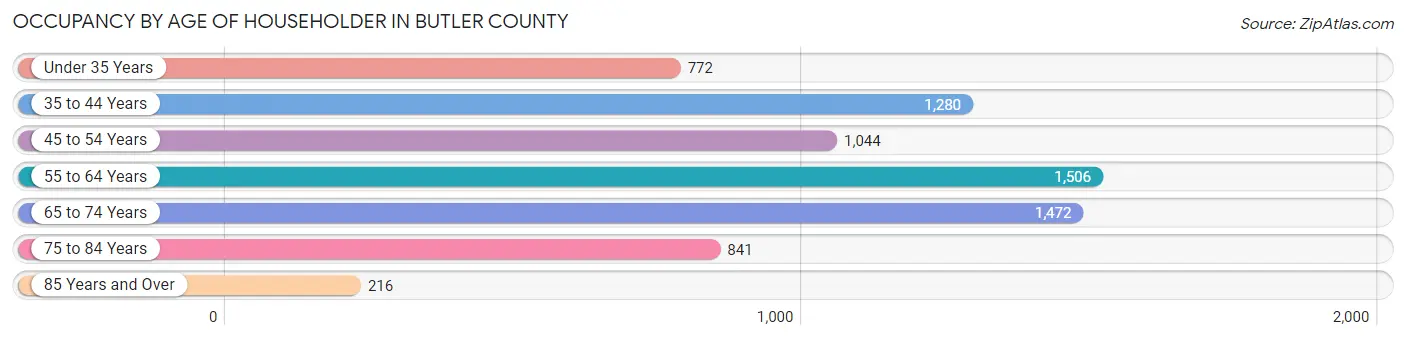
| Age Bracket | # Households | % Households |
| Under 35 Years | 772 | 10.8% |
| 35 to 44 Years | 1,280 | 17.9% |
| 45 to 54 Years | 1,044 | 14.6% |
| 55 to 64 Years | 1,506 | 21.1% |
| 65 to 74 Years | 1,472 | 20.6% |
| 75 to 84 Years | 841 | 11.8% |
| 85 Years and Over | 216 | 3.0% |
| Total | 7,131 | 100.0% |
Housing Finances in Butler County
Median Income by Occupancy in Butler County
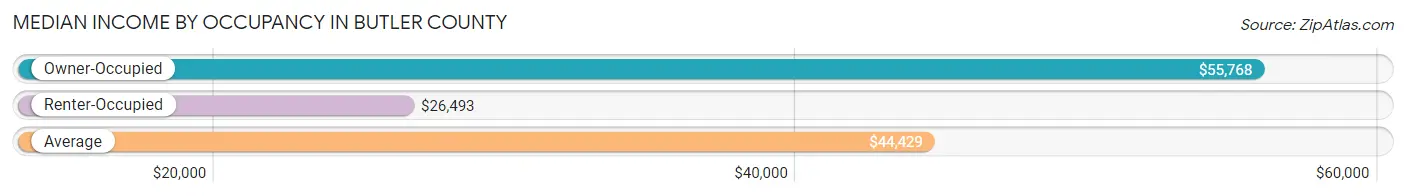
| Occupancy Type | # Households | Median Income |
| Owner-Occupied | 5,047 (70.8%) | $55,768 |
| Renter-Occupied | 2,084 (29.2%) | $26,493 |
| Average | 7,131 (100.0%) | $44,429 |
Occupancy by Householder Income Bracket in Butler County
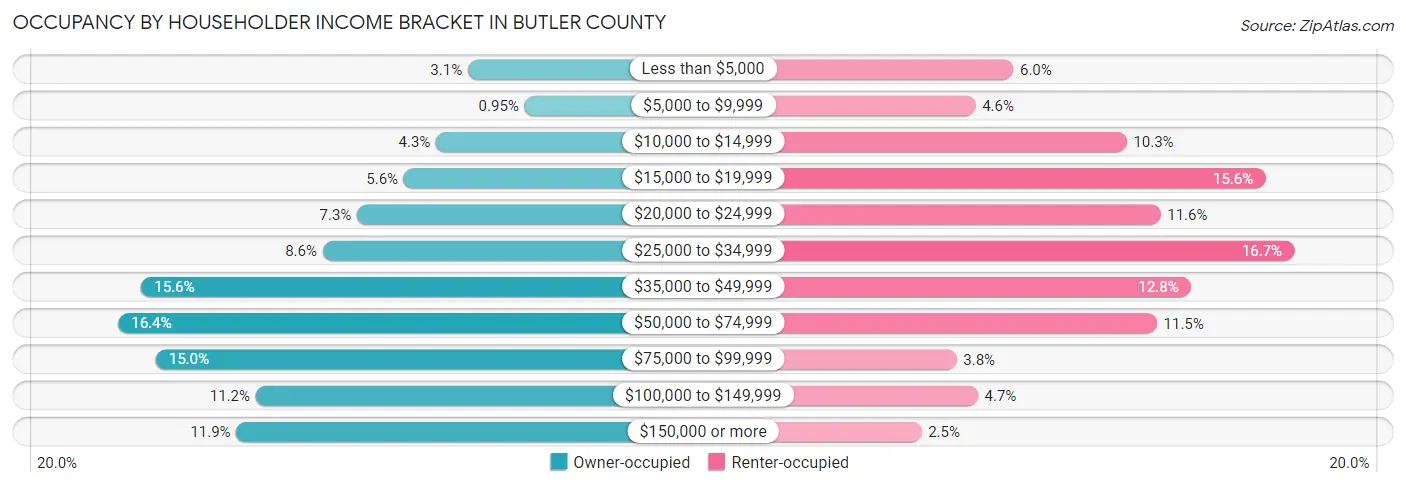
| Income Bracket | Owner-occupied | Renter-occupied |
| Less than $5,000 | 157 (3.1%) | 125 (6.0%) |
| $5,000 to $9,999 | 48 (0.9%) | 95 (4.6%) |
| $10,000 to $14,999 | 218 (4.3%) | 215 (10.3%) |
| $15,000 to $19,999 | 280 (5.6%) | 325 (15.6%) |
| $20,000 to $24,999 | 370 (7.3%) | 242 (11.6%) |
| $25,000 to $34,999 | 436 (8.6%) | 348 (16.7%) |
| $35,000 to $49,999 | 785 (15.5%) | 266 (12.8%) |
| $50,000 to $74,999 | 829 (16.4%) | 239 (11.5%) |
| $75,000 to $99,999 | 757 (15.0%) | 80 (3.8%) |
| $100,000 to $149,999 | 565 (11.2%) | 97 (4.6%) |
| $150,000 or more | 602 (11.9%) | 52 (2.5%) |
| Total | 5,047 (100.0%) | 2,084 (100.0%) |
Monthly Housing Cost Tiers in Butler County
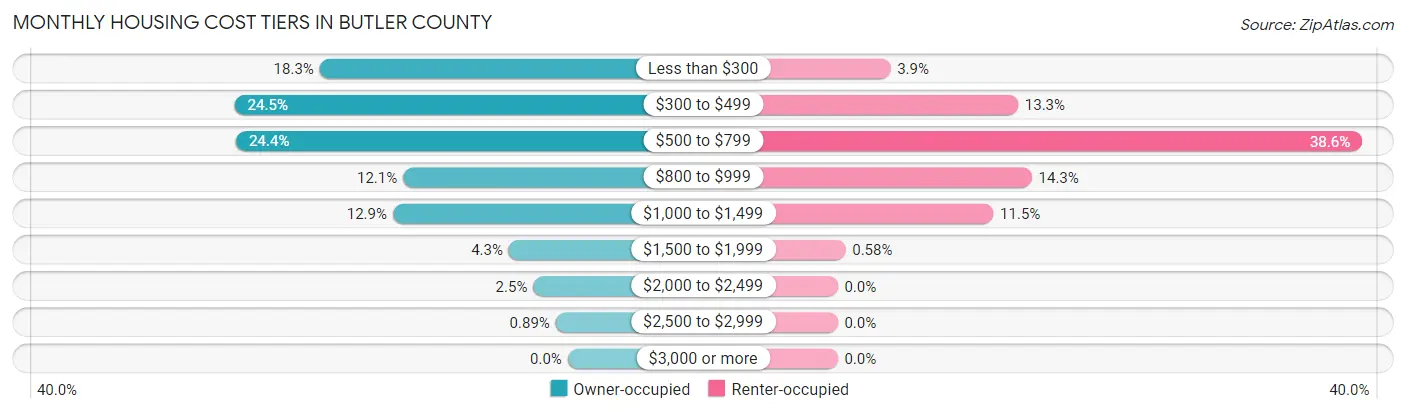
| Monthly Cost | Owner-occupied | Renter-occupied |
| Less than $300 | 922 (18.3%) | 81 (3.9%) |
| $300 to $499 | 1,238 (24.5%) | 277 (13.3%) |
| $500 to $799 | 1,233 (24.4%) | 805 (38.6%) |
| $800 to $999 | 612 (12.1%) | 298 (14.3%) |
| $1,000 to $1,499 | 650 (12.9%) | 239 (11.5%) |
| $1,500 to $1,999 | 219 (4.3%) | 12 (0.6%) |
| $2,000 to $2,499 | 128 (2.5%) | 0 (0.0%) |
| $2,500 to $2,999 | 45 (0.9%) | 0 (0.0%) |
| $3,000 or more | 0 (0.0%) | 0 (0.0%) |
| Total | 5,047 (100.0%) | 2,084 (100.0%) |
Physical Housing Characteristics in Butler County
Housing Structures in Butler County
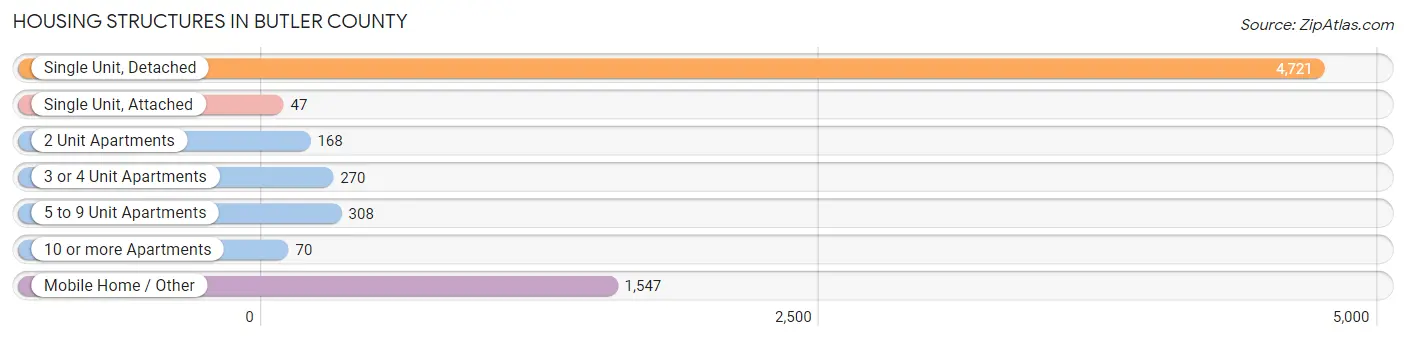
| Structure Type | # Housing Units | % Housing Units |
| Single Unit, Detached | 4,721 | 66.2% |
| Single Unit, Attached | 47 | 0.7% |
| 2 Unit Apartments | 168 | 2.4% |
| 3 or 4 Unit Apartments | 270 | 3.8% |
| 5 to 9 Unit Apartments | 308 | 4.3% |
| 10 or more Apartments | 70 | 1.0% |
| Mobile Home / Other | 1,547 | 21.7% |
| Total | 7,131 | 100.0% |
Housing Structures by Occupancy in Butler County
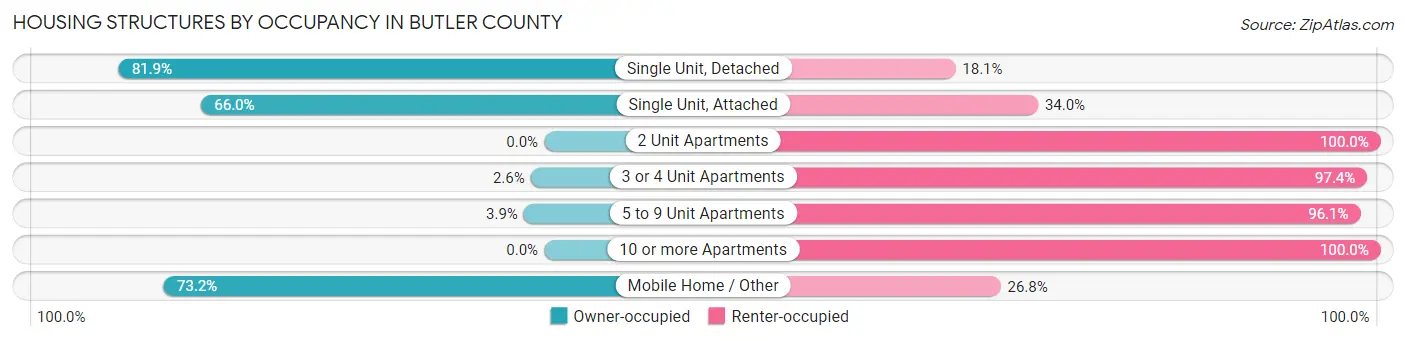
| Structure Type | Owner-occupied | Renter-occupied |
| Single Unit, Detached | 3,865 (81.9%) | 856 (18.1%) |
| Single Unit, Attached | 31 (66.0%) | 16 (34.0%) |
| 2 Unit Apartments | 0 (0.0%) | 168 (100.0%) |
| 3 or 4 Unit Apartments | 7 (2.6%) | 263 (97.4%) |
| 5 to 9 Unit Apartments | 12 (3.9%) | 296 (96.1%) |
| 10 or more Apartments | 0 (0.0%) | 70 (100.0%) |
| Mobile Home / Other | 1,132 (73.2%) | 415 (26.8%) |
| Total | 5,047 (70.8%) | 2,084 (29.2%) |
Housing Structures by Number of Rooms in Butler County
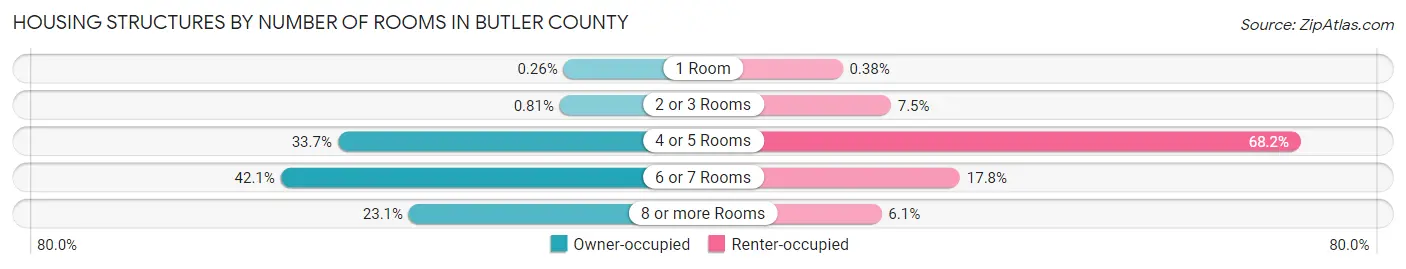
| Number of Rooms | Owner-occupied | Renter-occupied |
| 1 Room | 13 (0.3%) | 8 (0.4%) |
| 2 or 3 Rooms | 41 (0.8%) | 157 (7.5%) |
| 4 or 5 Rooms | 1,699 (33.7%) | 1,421 (68.2%) |
| 6 or 7 Rooms | 2,126 (42.1%) | 370 (17.7%) |
| 8 or more Rooms | 1,168 (23.1%) | 128 (6.1%) |
| Total | 5,047 (100.0%) | 2,084 (100.0%) |
Housing Structure by Heating Type in Butler County
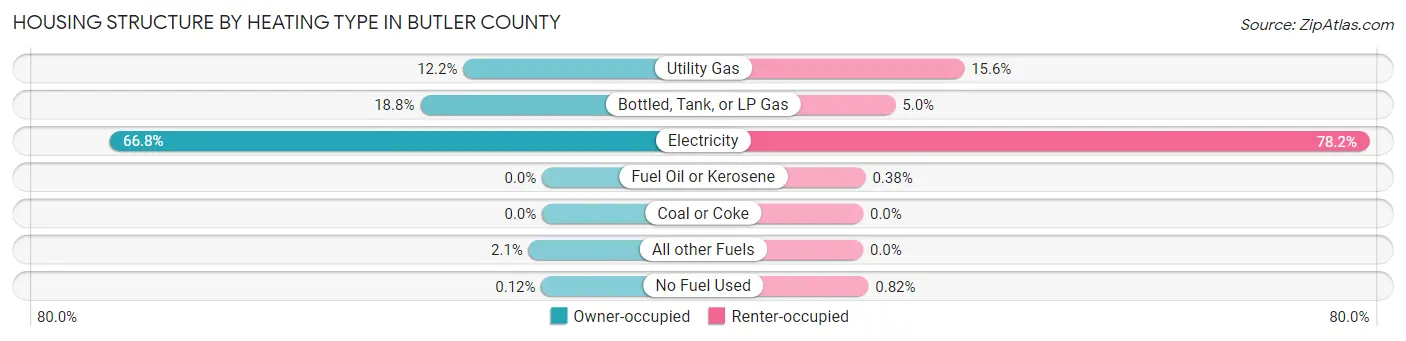
| Heating Type | Owner-occupied | Renter-occupied |
| Utility Gas | 615 (12.2%) | 326 (15.6%) |
| Bottled, Tank, or LP Gas | 951 (18.8%) | 104 (5.0%) |
| Electricity | 3,370 (66.8%) | 1,629 (78.2%) |
| Fuel Oil or Kerosene | 0 (0.0%) | 8 (0.4%) |
| Coal or Coke | 0 (0.0%) | 0 (0.0%) |
| All other Fuels | 105 (2.1%) | 0 (0.0%) |
| No Fuel Used | 6 (0.1%) | 17 (0.8%) |
| Total | 5,047 (100.0%) | 2,084 (100.0%) |
Household Vehicle Usage in Butler County
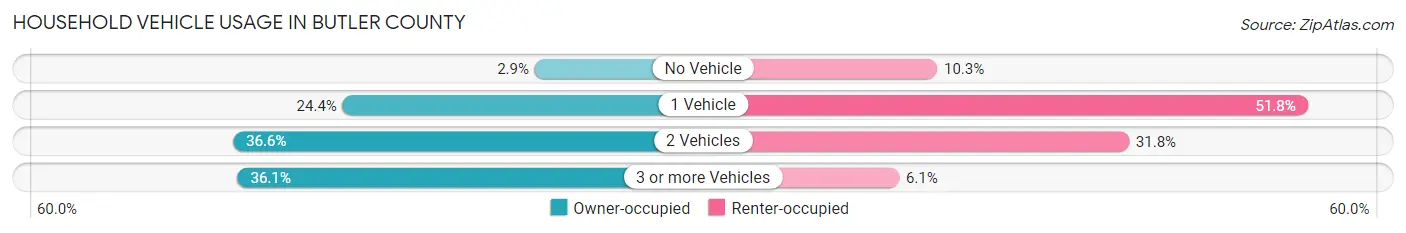
| Vehicles per Household | Owner-occupied | Renter-occupied |
| No Vehicle | 144 (2.9%) | 215 (10.3%) |
| 1 Vehicle | 1,230 (24.4%) | 1,080 (51.8%) |
| 2 Vehicles | 1,849 (36.6%) | 663 (31.8%) |
| 3 or more Vehicles | 1,824 (36.1%) | 126 (6.0%) |
| Total | 5,047 (100.0%) | 2,084 (100.0%) |
Real Estate & Mortgages in Butler County
Real Estate and Mortgage Overview in Butler County
| Characteristic | Without Mortgage | With Mortgage |
| Housing Units | 3,192 | 1,855 |
| Median Property Value | $92,900 | $98,200 |
| Median Household Income | $48,833 | $234 |
| Monthly Housing Costs | $414 | $0 |
| Real Estate Taxes | $272 | $405 |
Property Value by Mortgage Status in Butler County
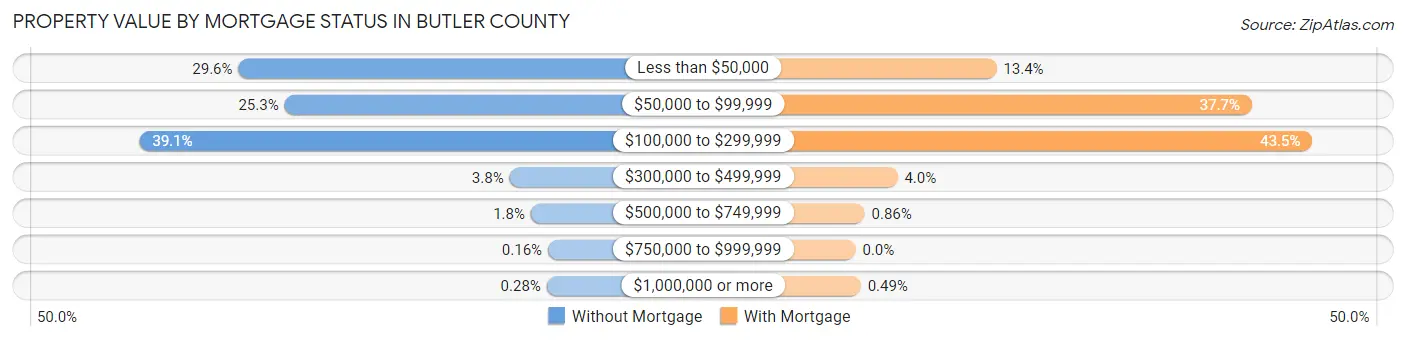
| Property Value | Without Mortgage | With Mortgage |
| Less than $50,000 | 946 (29.6%) | 249 (13.4%) |
| $50,000 to $99,999 | 806 (25.3%) | 700 (37.7%) |
| $100,000 to $299,999 | 1,247 (39.1%) | 807 (43.5%) |
| $300,000 to $499,999 | 122 (3.8%) | 74 (4.0%) |
| $500,000 to $749,999 | 57 (1.8%) | 16 (0.9%) |
| $750,000 to $999,999 | 5 (0.2%) | 0 (0.0%) |
| $1,000,000 or more | 9 (0.3%) | 9 (0.5%) |
| Total | 3,192 (100.0%) | 1,855 (100.0%) |
Household Income by Mortgage Status in Butler County
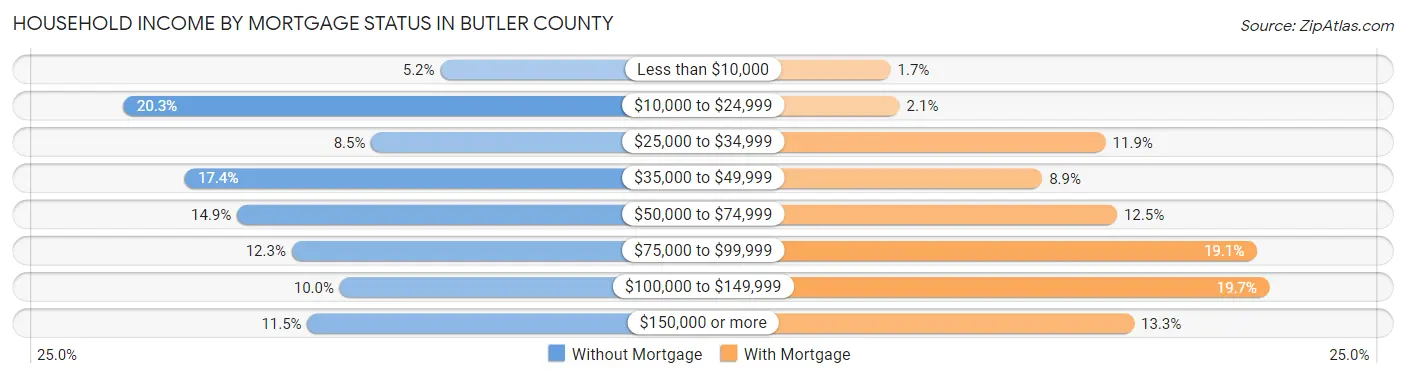
| Household Income | Without Mortgage | With Mortgage |
| Less than $10,000 | 166 (5.2%) | 31 (1.7%) |
| $10,000 to $24,999 | 647 (20.3%) | 39 (2.1%) |
| $25,000 to $34,999 | 271 (8.5%) | 221 (11.9%) |
| $35,000 to $49,999 | 554 (17.4%) | 165 (8.9%) |
| $50,000 to $74,999 | 475 (14.9%) | 231 (12.4%) |
| $75,000 to $99,999 | 392 (12.3%) | 354 (19.1%) |
| $100,000 to $149,999 | 319 (10.0%) | 365 (19.7%) |
| $150,000 or more | 368 (11.5%) | 246 (13.3%) |
| Total | 3,192 (100.0%) | 1,855 (100.0%) |
Property Value to Household Income Ratio in Butler County
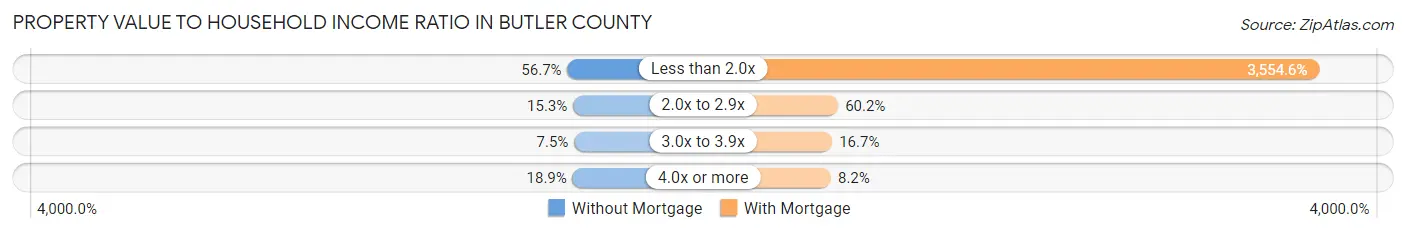
| Value-to-Income Ratio | Without Mortgage | With Mortgage |
| Less than 2.0x | 1,811 (56.7%) | 65,938 (3,554.6%) |
| 2.0x to 2.9x | 488 (15.3%) | 1,116 (60.2%) |
| 3.0x to 3.9x | 240 (7.5%) | 309 (16.7%) |
| 4.0x or more | 603 (18.9%) | 152 (8.2%) |
| Total | 3,192 (100.0%) | 1,855 (100.0%) |
Real Estate Taxes by Mortgage Status in Butler County
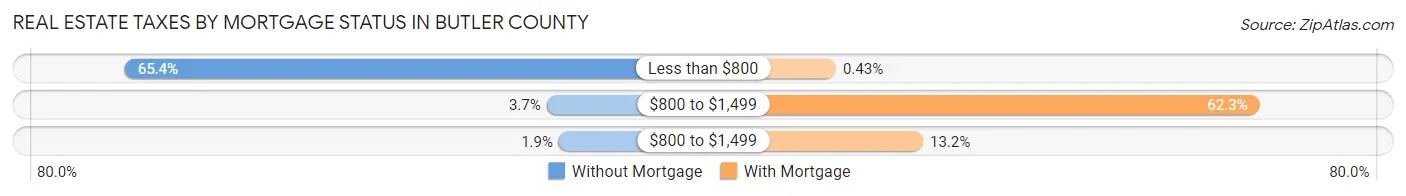
| Property Taxes | Without Mortgage | With Mortgage |
| Less than $800 | 2,086 (65.3%) | 8 (0.4%) |
| $800 to $1,499 | 119 (3.7%) | 1,156 (62.3%) |
| $800 to $1,499 | 62 (1.9%) | 244 (13.2%) |
| Total | 3,192 (100.0%) | 1,855 (100.0%) |
Health & Disability in Butler County
Health Insurance Coverage by Age in Butler County
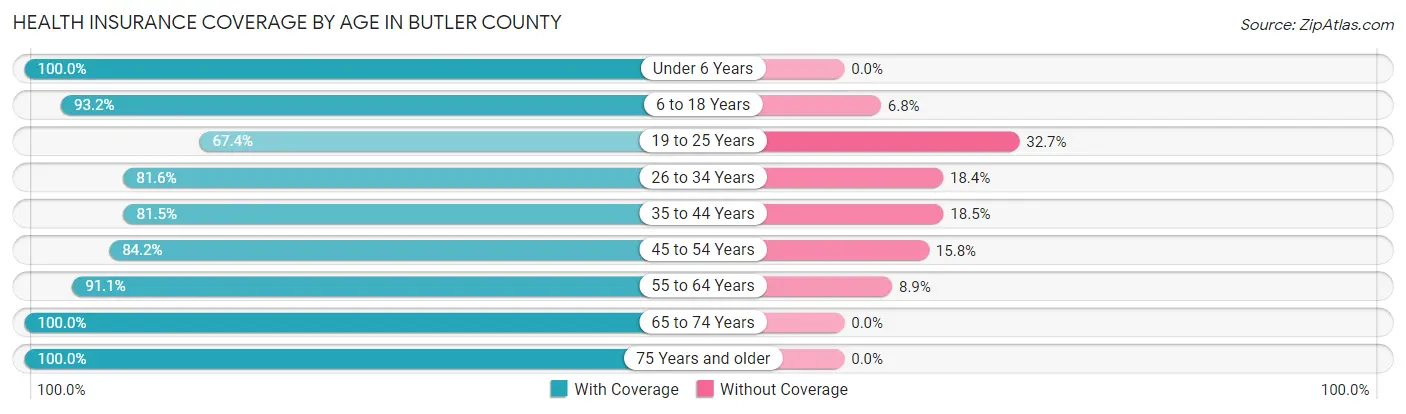
| Age Bracket | With Coverage | Without Coverage |
| Under 6 Years | 1,236 (100.0%) | 0 (0.0%) |
| 6 to 18 Years | 2,936 (93.2%) | 215 (6.8%) |
| 19 to 25 Years | 990 (67.3%) | 480 (32.7%) |
| 26 to 34 Years | 1,573 (81.6%) | 355 (18.4%) |
| 35 to 44 Years | 1,936 (81.5%) | 439 (18.5%) |
| 45 to 54 Years | 1,820 (84.2%) | 341 (15.8%) |
| 55 to 64 Years | 2,282 (91.1%) | 223 (8.9%) |
| 65 to 74 Years | 2,234 (100.0%) | 0 (0.0%) |
| 75 Years and older | 1,626 (100.0%) | 0 (0.0%) |
| Total | 16,633 (89.0%) | 2,053 (11.0%) |
Health Insurance Coverage by Citizenship Status in Butler County
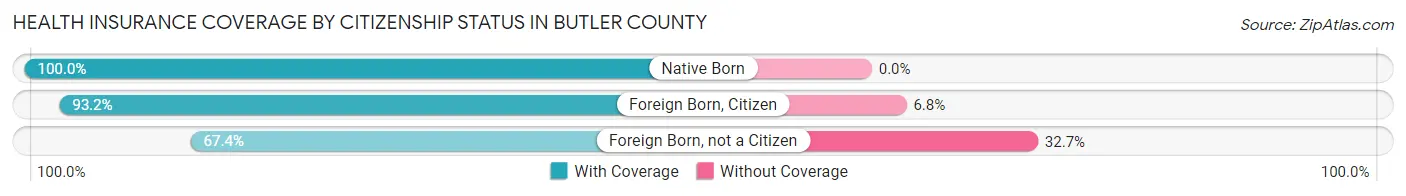
| Citizenship Status | With Coverage | Without Coverage |
| Native Born | 1,236 (100.0%) | 0 (0.0%) |
| Foreign Born, Citizen | 2,936 (93.2%) | 215 (6.8%) |
| Foreign Born, not a Citizen | 990 (67.3%) | 480 (32.7%) |
Health Insurance Coverage by Household Income in Butler County
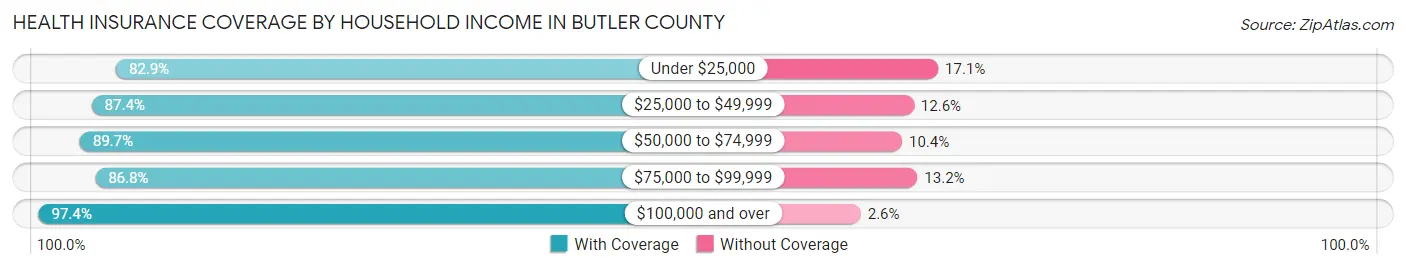
| Household Income | With Coverage | Without Coverage |
| Under $25,000 | 3,346 (82.9%) | 691 (17.1%) |
| $25,000 to $49,999 | 4,140 (87.4%) | 595 (12.6%) |
| $50,000 to $74,999 | 2,426 (89.6%) | 280 (10.3%) |
| $75,000 to $99,999 | 2,315 (86.8%) | 353 (13.2%) |
| $100,000 and over | 4,378 (97.4%) | 118 (2.6%) |
Public vs Private Health Insurance Coverage by Age in Butler County
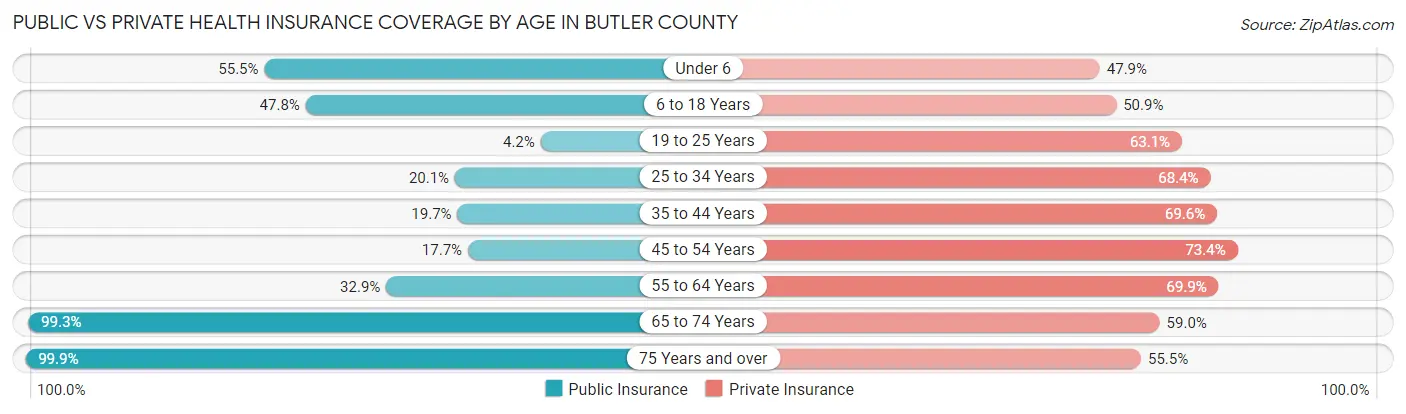
| Age Bracket | Public Insurance | Private Insurance |
| Under 6 | 686 (55.5%) | 592 (47.9%) |
| 6 to 18 Years | 1,507 (47.8%) | 1,605 (50.9%) |
| 19 to 25 Years | 62 (4.2%) | 928 (63.1%) |
| 25 to 34 Years | 388 (20.1%) | 1,319 (68.4%) |
| 35 to 44 Years | 467 (19.7%) | 1,654 (69.6%) |
| 45 to 54 Years | 383 (17.7%) | 1,587 (73.4%) |
| 55 to 64 Years | 824 (32.9%) | 1,752 (69.9%) |
| 65 to 74 Years | 2,219 (99.3%) | 1,318 (59.0%) |
| 75 Years and over | 1,624 (99.9%) | 903 (55.5%) |
| Total | 8,160 (43.7%) | 11,658 (62.4%) |
Disability Status by Sex by Age in Butler County
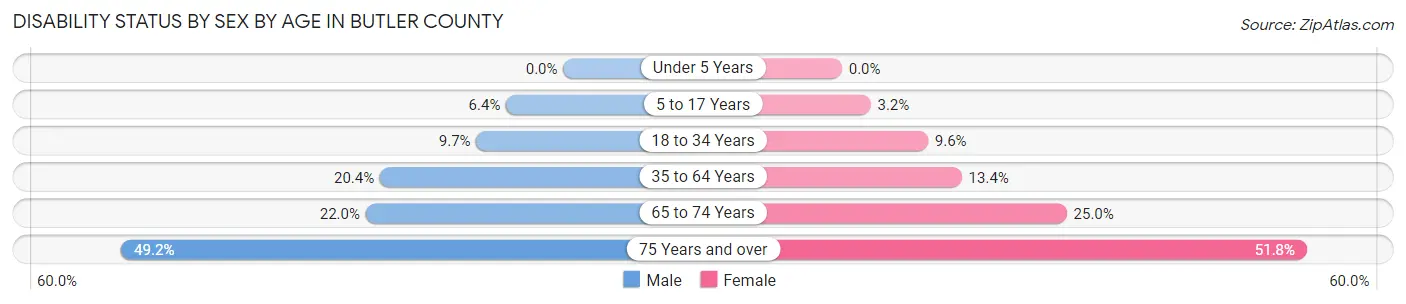
| Age Bracket | Male | Female |
| Under 5 Years | 0 (0.0%) | 0 (0.0%) |
| 5 to 17 Years | 109 (6.4%) | 47 (3.2%) |
| 18 to 34 Years | 169 (9.7%) | 173 (9.6%) |
| 35 to 64 Years | 654 (20.4%) | 512 (13.4%) |
| 65 to 74 Years | 220 (22.0%) | 309 (25.0%) |
| 75 Years and over | 293 (49.2%) | 534 (51.8%) |
Disability Class by Sex by Age in Butler County
Disability Class: Hearing Difficulty
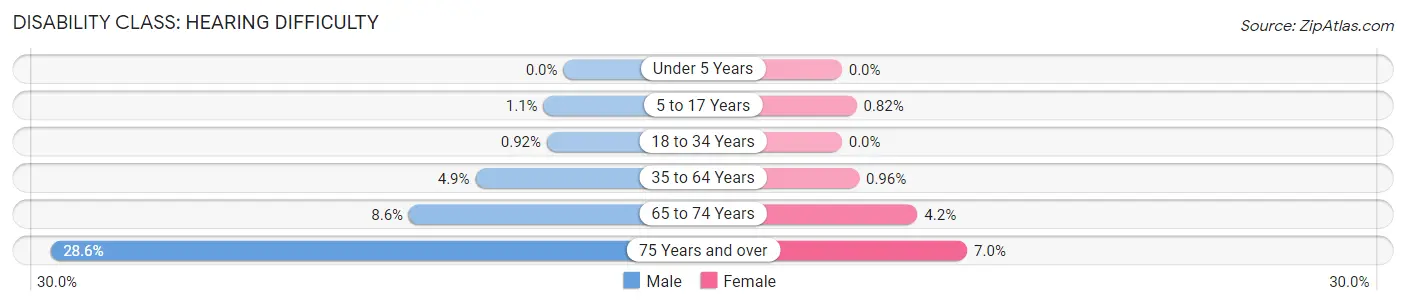
| Age Bracket | Male | Female |
| Under 5 Years | 0 (0.0%) | 0 (0.0%) |
| 5 to 17 Years | 19 (1.1%) | 12 (0.8%) |
| 18 to 34 Years | 16 (0.9%) | 0 (0.0%) |
| 35 to 64 Years | 157 (4.9%) | 37 (1.0%) |
| 65 to 74 Years | 86 (8.6%) | 52 (4.2%) |
| 75 Years and over | 170 (28.6%) | 72 (7.0%) |
Disability Class: Vision Difficulty
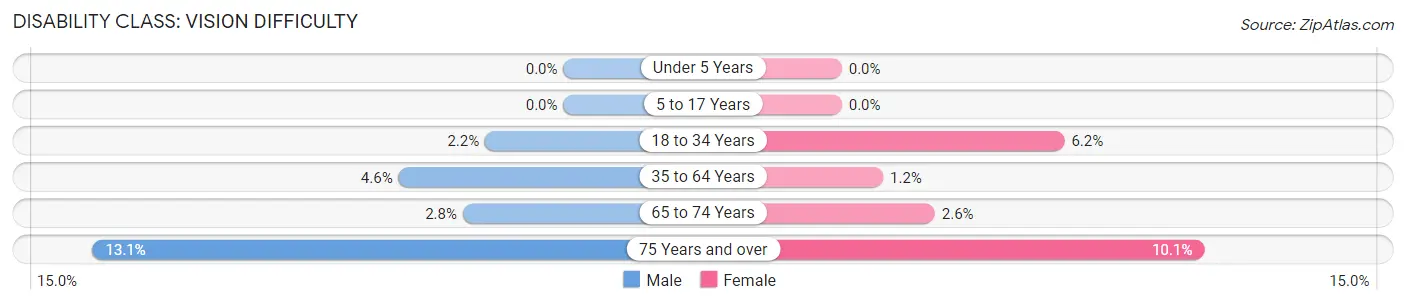
| Age Bracket | Male | Female |
| Under 5 Years | 0 (0.0%) | 0 (0.0%) |
| 5 to 17 Years | 0 (0.0%) | 0 (0.0%) |
| 18 to 34 Years | 38 (2.2%) | 112 (6.2%) |
| 35 to 64 Years | 147 (4.6%) | 44 (1.1%) |
| 65 to 74 Years | 28 (2.8%) | 32 (2.6%) |
| 75 Years and over | 78 (13.1%) | 104 (10.1%) |
Disability Class: Cognitive Difficulty
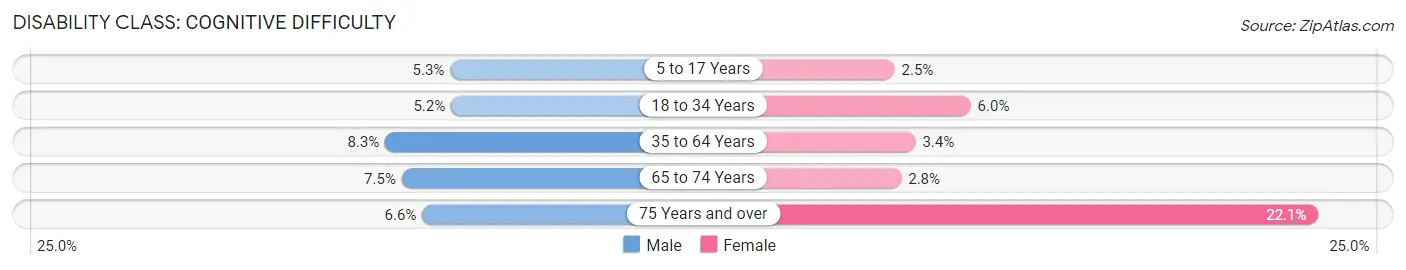
| Age Bracket | Male | Female |
| 5 to 17 Years | 90 (5.2%) | 36 (2.5%) |
| 18 to 34 Years | 91 (5.2%) | 108 (6.0%) |
| 35 to 64 Years | 265 (8.3%) | 131 (3.4%) |
| 65 to 74 Years | 75 (7.5%) | 34 (2.8%) |
| 75 Years and over | 39 (6.6%) | 228 (22.1%) |
Disability Class: Ambulatory Difficulty
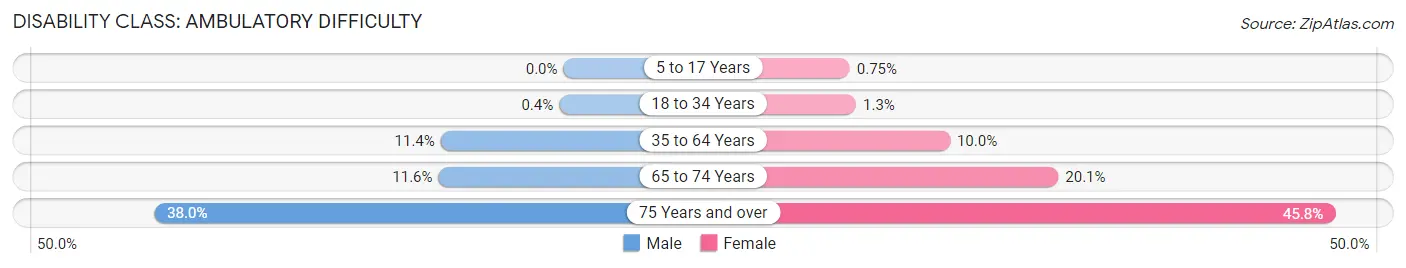
| Age Bracket | Male | Female |
| 5 to 17 Years | 0 (0.0%) | 11 (0.7%) |
| 18 to 34 Years | 7 (0.4%) | 24 (1.3%) |
| 35 to 64 Years | 365 (11.4%) | 385 (10.0%) |
| 65 to 74 Years | 116 (11.6%) | 248 (20.1%) |
| 75 Years and over | 226 (38.0%) | 472 (45.8%) |
Disability Class: Self-Care Difficulty
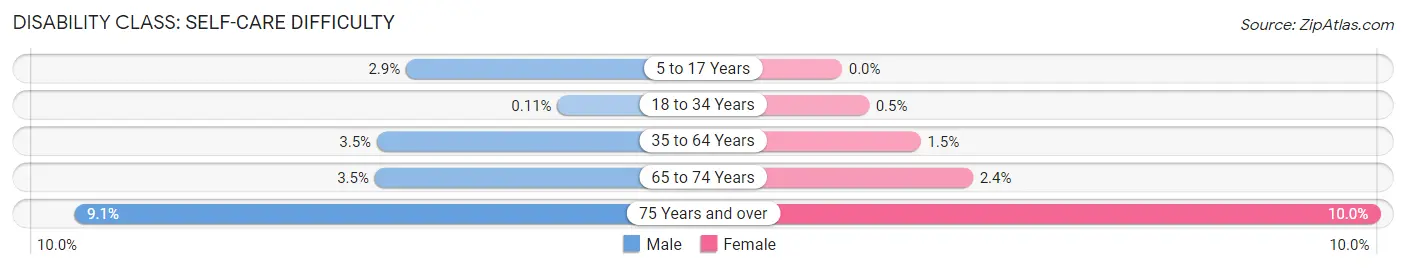
| Age Bracket | Male | Female |
| 5 to 17 Years | 50 (2.9%) | 0 (0.0%) |
| 18 to 34 Years | 2 (0.1%) | 9 (0.5%) |
| 35 to 64 Years | 111 (3.5%) | 56 (1.5%) |
| 65 to 74 Years | 35 (3.5%) | 30 (2.4%) |
| 75 Years and over | 54 (9.1%) | 103 (10.0%) |
Technology Access in Butler County
Computing Device Access in Butler County
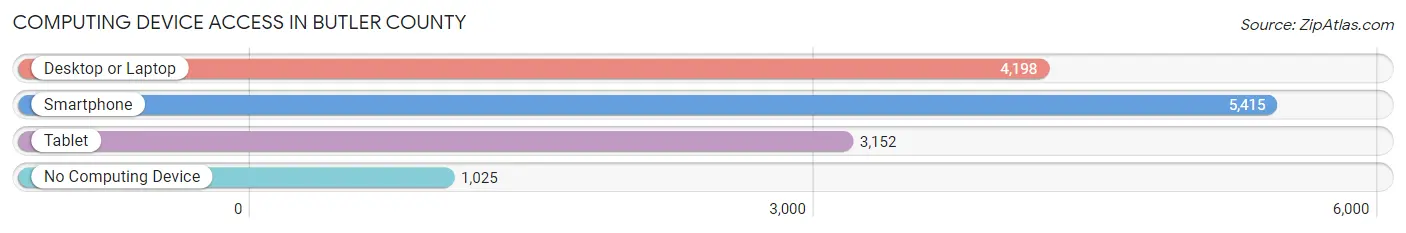
| Device Type | # Households | % Households |
| Desktop or Laptop | 4,198 | 58.9% |
| Smartphone | 5,415 | 75.9% |
| Tablet | 3,152 | 44.2% |
| No Computing Device | 1,025 | 14.4% |
| Total | 7,131 | 100.0% |
Internet Access in Butler County
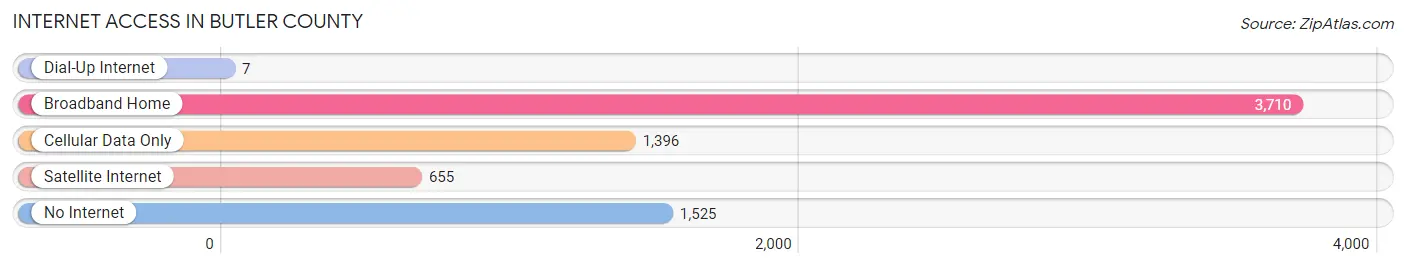
| Internet Type | # Households | % Households |
| Dial-Up Internet | 7 | 0.1% |
| Broadband Home | 3,710 | 52.0% |
| Cellular Data Only | 1,396 | 19.6% |
| Satellite Internet | 655 | 9.2% |
| No Internet | 1,525 | 21.4% |
| Total | 7,131 | 100.0% |
Butler County Summary
Butler County is located in the southeastern corner of Alabama, and is bordered by Conecuh County to the north, Crenshaw County to the east, Covington County to the south, and Monroe County to the west. The county seat is Greenville, and the county has a total area of 602 square miles.
History
Butler County was established in 1819, and was named for Captain William Butler, a Revolutionary War hero. The county was originally part of the Creek Nation, and was ceded to the United States in 1814. The first settlers arrived in the area in 1817, and the county was officially organized in 1819.
The county was largely agricultural in its early years, with cotton being the primary crop. The county was also home to several sawmills and gristmills, which provided lumber and grain for the local population.
During the Civil War, Butler County was largely pro-Confederate, and several battles were fought in the area. After the war, the county experienced a period of economic decline, as the cotton industry was devastated by the war.
Geography
Butler County is located in the southeastern corner of Alabama, and is bordered by Conecuh County to the north, Crenshaw County to the east, Covington County to the south, and Monroe County to the west. The county has a total area of 602 square miles, and is mostly rural.
The terrain of the county is mostly flat, with some rolling hills in the northern part of the county. The Choctawhatchee River runs through the county, and there are several small lakes and ponds scattered throughout the area. The county is mostly covered in pine and hardwood forests, with some areas of open farmland.
Economy
Butler County’s economy is largely based on agriculture, with cotton, soybeans, corn, and peanuts being the primary crops. The county also has a thriving timber industry, and there are several sawmills and wood-processing plants in the area.
The county is also home to several manufacturing plants, including a paper mill, a furniture factory, and a plastics plant. The county also has a growing tourism industry, with several hunting and fishing lodges located in the area.
Demographics
As of the 2010 census, Butler County had a population of 20,947. The population was 54.3% white, 42.2% African American, 0.7% Native American, 0.3% Asian, 0.1% Pacific Islander, 1.2% from other races, and 1.2% from two or more races. Hispanic or Latino of any race were 2.3% of the population.
The median household income in the county was $30,945, and the median family income was $37,945. The per capita income was $16,845. About 22.2% of the population was below the poverty line.
Common Questions
What is Per Capita Income in Butler County?
Per Capita income in Butler County is $26,334.
What is the Median Family Income in Butler County?
Median Family Income in Butler County is $59,217.
What is the Median Household income in Butler County?
Median Household Income in Butler County is $44,429.
What is Income or Wage Gap in Butler County?
Income or Wage Gap in Butler County is 33.5%.
Women in Butler County earn 66.5 cents for every dollar earned by a man.
What is Family Income Deficit in Butler County?
Family Income Deficit in Butler County is $8,395.
Families that are below poverty line in Butler County earn $8,395 less on average than the poverty threshold level.
What is Inequality or Gini Index in Butler County?
Inequality or Gini Index in Butler County is 0.48.
What is the Total Population of Butler County?
Total Population of Butler County is 18,981.
What is the Total Male Population of Butler County?
Total Male Population of Butler County is 8,928.
What is the Total Female Population of Butler County?
Total Female Population of Butler County is 10,053.
What is the Ratio of Males per 100 Females in Butler County?
There are 88.81 Males per 100 Females in Butler County.
What is the Ratio of Females per 100 Males in Butler County?
There are 112.60 Females per 100 Males in Butler County.
What is the Median Population Age in Butler County?
Median Population Age in Butler County is 41.6 Years.
What is the Average Family Size in Butler County
Average Family Size in Butler County is 3.3 People.
What is the Average Household Size in Butler County
Average Household Size in Butler County is 2.6 People.
How Large is the Labor Force in Butler County?
There are 8,042 People in the Labor Forcein in Butler County.
What is the Percentage of People in the Labor Force in Butler County?
52.9% of People are in the Labor Force in Butler County.
What is the Unemployment Rate in Butler County?
Unemployment Rate in Butler County is 6.8%.