Welsh Female Disability
COMPARE
Welsh
Select to Compare
Female Disability
Welsh Female Disability
13.1%
DISABILITY | FEMALES
0.0/ 100
METRIC RATING
282nd/ 347
METRIC RANK
Welsh Female Disability Correlation Chart
The statistical analysis conducted on geographies consisting of 528,453,595 people shows a substantial positive correlation between the proportion of Welsh and percentage of females with a disability in the United States with a correlation coefficient (R) of 0.501 and weighted average of 13.1%. On average, for every 1% (one percent) increase in Welsh within a typical geography, there is an increase of 0.62% in percentage of females with a disability.
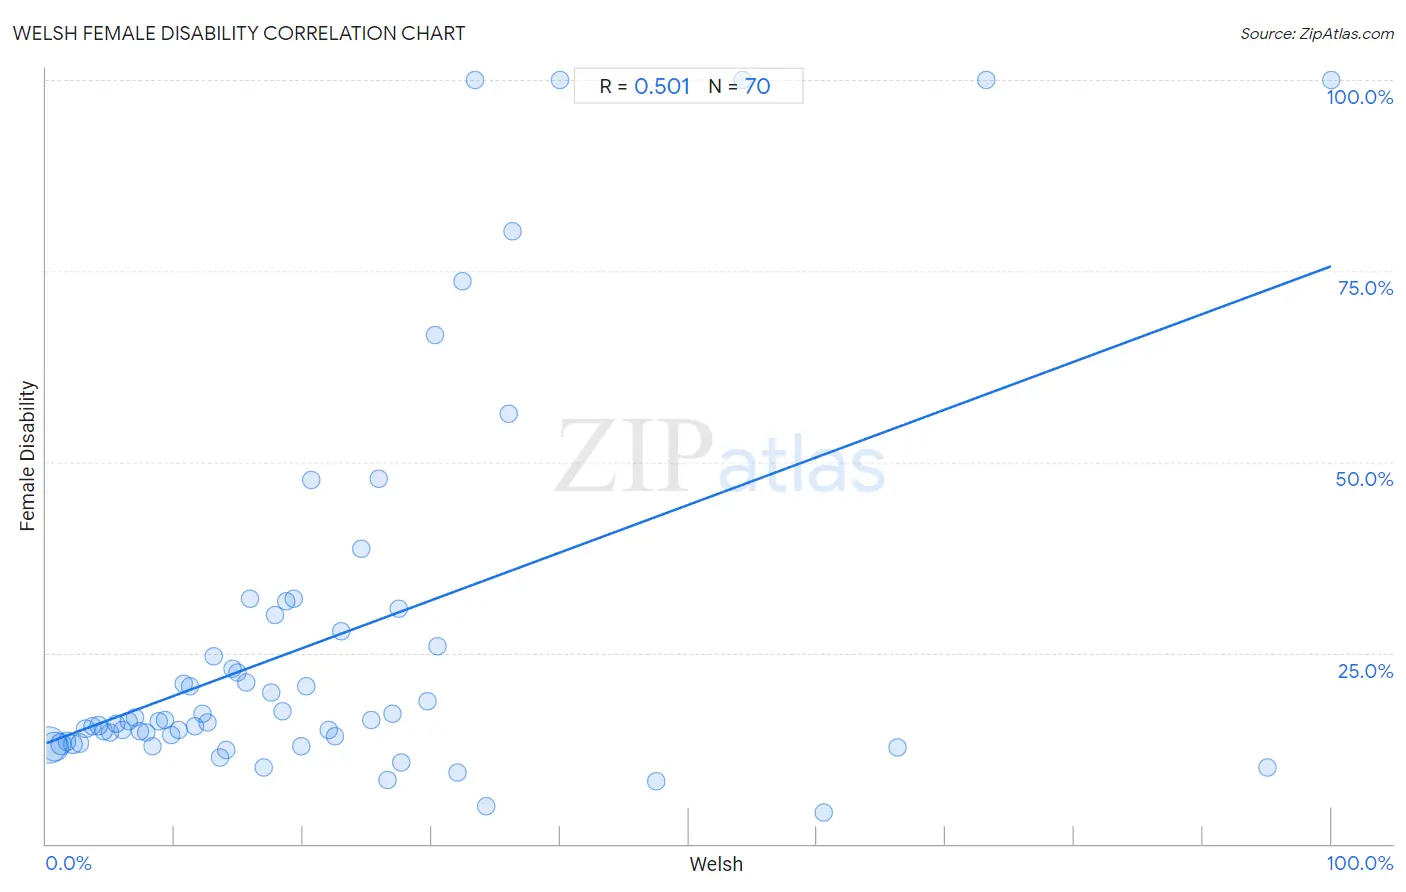
It is essential to understand that the correlation between the percentage of Welsh and percentage of females with a disability does not imply a direct cause-and-effect relationship. It remains uncertain whether the presence of Welsh influences an upward or downward trend in the level of percentage of females with a disability within an area, or if Welsh simply ended up residing in those areas with higher or lower levels of percentage of females with a disability due to other factors.
Demographics Similar to Welsh by Female Disability
In terms of female disability, the demographic groups most similar to Welsh are English (13.1%, a difference of 0.0%), U.S. Virgin Islander (13.1%, a difference of 0.080%), Irish (13.1%, a difference of 0.11%), Hmong (13.1%, a difference of 0.14%), and Bangladeshi (13.1%, a difference of 0.19%).
| Demographics | Rating | Rank | Female Disability |
| Cheyenne | 0.1 /100 | #275 | Tragic 13.0% |
| Immigrants from Dominica | 0.1 /100 | #276 | Tragic 13.0% |
| Spanish | 0.1 /100 | #277 | Tragic 13.0% |
| Scottish | 0.1 /100 | #278 | Tragic 13.0% |
| Arapaho | 0.1 /100 | #279 | Tragic 13.0% |
| Irish | 0.1 /100 | #280 | Tragic 13.1% |
| U.S. Virgin Islanders | 0.1 /100 | #281 | Tragic 13.1% |
| Welsh | 0.0 /100 | #282 | Tragic 13.1% |
| English | 0.0 /100 | #283 | Tragic 13.1% |
| Hmong | 0.0 /100 | #284 | Tragic 13.1% |
| Bangladeshis | 0.0 /100 | #285 | Tragic 13.1% |
| Fijians | 0.0 /100 | #286 | Tragic 13.1% |
| Yaqui | 0.0 /100 | #287 | Tragic 13.2% |
| Whites/Caucasians | 0.0 /100 | #288 | Tragic 13.2% |
| Tlingit-Haida | 0.0 /100 | #289 | Tragic 13.2% |
Welsh Female Disability Correlation Summary
| Measurement | Welsh Data | Female Disability Data |
| Minimum | 0.24% | 4.2% |
| Maximum | 100.0% | 100.0% |
| Range | 99.8% | 95.8% |
| Mean | 21.8% | 26.8% |
| Median | 17.2% | 16.1% |
| Interquartile 25% (IQ1) | 8.3% | 13.2% |
| Interquartile 75% (IQ3) | 27.6% | 27.8% |
| Interquartile Range (IQR) | 19.3% | 14.7% |
| Standard Deviation (Sample) | 20.2% | 25.2% |
| Standard Deviation (Population) | 20.1% | 25.0% |
Correlation Details
| Welsh Percentile | Sample Size | Female Disability |
[ 0.0% - 0.5% ] 0.24% | 288,586,464 | 12.9% |
[ 0.5% - 1.0% ] 0.67% | 161,935,597 | 12.7% |
[ 1.0% - 1.5% ] 1.13% | 48,060,490 | 13.0% |
[ 1.5% - 2.0% ] 1.62% | 15,840,943 | 13.4% |
[ 2.0% - 2.5% ] 2.09% | 6,555,461 | 13.0% |
[ 2.5% - 3.0% ] 2.59% | 3,356,602 | 13.2% |
[ 3.0% - 3.5% ] 3.06% | 1,344,761 | 15.1% |
[ 3.5% - 4.0% ] 3.56% | 901,258 | 15.3% |
[ 4.0% - 4.5% ] 4.04% | 441,373 | 15.5% |
[ 4.0% - 4.5% ] 4.49% | 285,506 | 14.7% |
[ 4.5% - 5.0% ] 4.97% | 361,569 | 14.5% |
[ 5.0% - 5.5% ] 5.46% | 205,528 | 15.7% |
[ 5.5% - 6.0% ] 5.92% | 106,868 | 14.9% |
[ 6.0% - 6.5% ] 6.40% | 97,018 | 16.0% |
[ 6.5% - 7.0% ] 6.91% | 68,963 | 16.5% |
[ 7.0% - 7.5% ] 7.32% | 52,257 | 14.8% |
[ 7.5% - 8.0% ] 7.80% | 58,365 | 14.5% |
[ 8.0% - 8.5% ] 8.29% | 21,326 | 12.8% |
[ 8.5% - 9.0% ] 8.75% | 20,608 | 16.1% |
[ 9.0% - 9.5% ] 9.26% | 18,602 | 16.3% |
[ 9.5% - 10.0% ] 9.75% | 20,334 | 14.2% |
[ 10.0% - 10.5% ] 10.27% | 10,703 | 14.9% |
[ 10.5% - 11.0% ] 10.71% | 10,311 | 20.9% |
[ 11.0% - 11.5% ] 11.17% | 5,094 | 20.6% |
[ 11.5% - 12.0% ] 11.62% | 14,356 | 15.4% |
[ 12.0% - 12.5% ] 12.20% | 14,289 | 17.1% |
[ 12.5% - 13.0% ] 12.55% | 2,965 | 15.9% |
[ 13.0% - 13.5% ] 13.01% | 2,199 | 24.6% |
[ 13.0% - 13.5% ] 13.47% | 7,726 | 11.3% |
[ 13.5% - 14.0% ] 13.99% | 4,919 | 12.3% |
[ 14.5% - 15.0% ] 14.53% | 8,153 | 22.9% |
[ 14.5% - 15.0% ] 14.88% | 2,164 | 22.5% |
[ 15.5% - 16.0% ] 15.53% | 3,663 | 21.1% |
[ 15.5% - 16.0% ] 15.85% | 2,751 | 32.0% |
[ 16.5% - 17.0% ] 16.90% | 1,361 | 9.9% |
[ 17.5% - 18.0% ] 17.50% | 1,097 | 19.8% |
[ 17.5% - 18.0% ] 17.83% | 1,593 | 29.9% |
[ 18.0% - 18.5% ] 18.43% | 9,039 | 17.4% |
[ 18.5% - 19.0% ] 18.68% | 91 | 31.8% |
[ 19.0% - 19.5% ] 19.24% | 577 | 32.1% |
[ 19.5% - 20.0% ] 19.81% | 429 | 12.8% |
[ 20.0% - 20.5% ] 20.28% | 143 | 20.7% |
[ 20.5% - 21.0% ] 20.63% | 2,031 | 47.7% |
[ 21.5% - 22.0% ] 22.00% | 1,600 | 14.9% |
[ 22.5% - 23.0% ] 22.52% | 3,033 | 14.0% |
[ 22.5% - 23.0% ] 22.92% | 144 | 27.8% |
[ 24.5% - 25.0% ] 24.55% | 497 | 38.6% |
[ 25.0% - 25.5% ] 25.33% | 75 | 16.3% |
[ 25.5% - 26.0% ] 25.84% | 89 | 47.7% |
[ 26.5% - 27.0% ] 26.56% | 64 | 8.3% |
[ 26.5% - 27.0% ] 26.94% | 219 | 17.0% |
[ 27.0% - 27.5% ] 27.43% | 175 | 30.8% |
[ 27.5% - 28.0% ] 27.62% | 105 | 10.6% |
[ 29.5% - 30.0% ] 29.70% | 202 | 18.6% |
[ 30.0% - 30.5% ] 30.23% | 43 | 66.7% |
[ 30.0% - 30.5% ] 30.48% | 105 | 25.9% |
[ 32.0% - 32.5% ] 32.05% | 390 | 9.3% |
[ 32.0% - 32.5% ] 32.43% | 37 | 73.7% |
[ 33.0% - 33.5% ] 33.33% | 30 | 100.0% |
[ 34.0% - 34.5% ] 34.23% | 222 | 4.9% |
[ 36.0% - 36.5% ] 36.00% | 25 | 56.2% |
[ 36.0% - 36.5% ] 36.30% | 146 | 80.2% |
[ 40.0% - 40.5% ] 40.00% | 15 | 100.0% |
[ 47.0% - 47.5% ] 47.47% | 375 | 8.2% |
[ 54.0% - 54.5% ] 54.17% | 24 | 100.0% |
[ 60.0% - 60.5% ] 60.47% | 43 | 4.2% |
[ 66.0% - 66.5% ] 66.25% | 240 | 12.6% |
[ 73.0% - 73.5% ] 73.17% | 41 | 100.0% |
[ 95.0% - 95.5% ] 95.00% | 100 | 10.0% |
[ 99.5% - 100.0% ] 100.00% | 9 | 100.0% |