Welsh Self-Care Disability
COMPARE
Welsh
Select to Compare
Self-Care Disability
Welsh Self-Care Disability
2.5%
SELF-CARE DISABILITY
50.0/ 100
METRIC RATING
174th/ 347
METRIC RANK
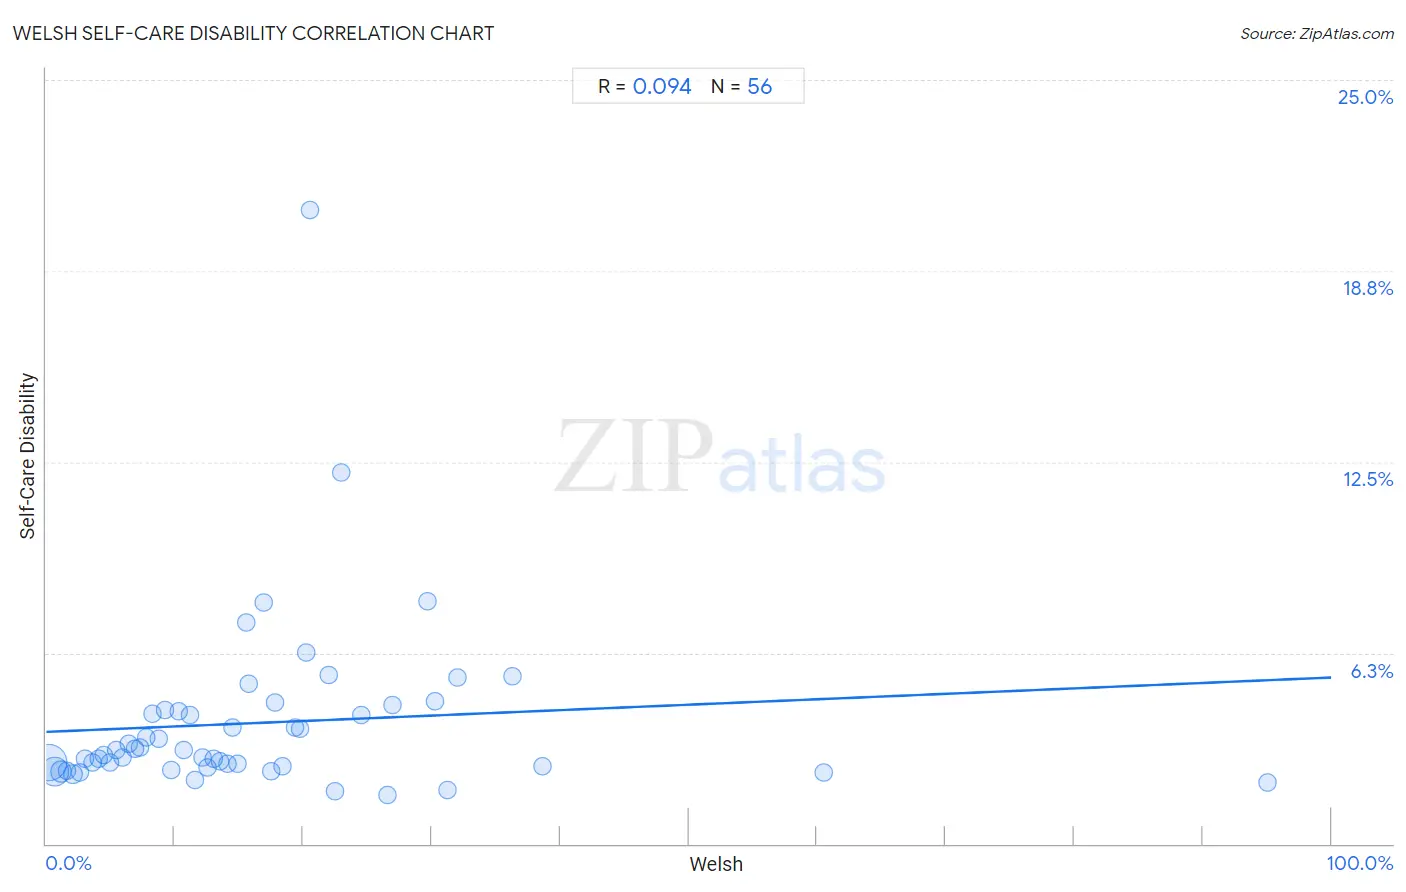
Welsh Self-Care Disability Correlation Chart
The statistical analysis conducted on geographies consisting of 527,151,887 people shows a slight positive correlation between the proportion of Welsh and percentage of population with self-care disability in the United States with a correlation coefficient (R) of 0.094 and weighted average of 2.5%. On average, for every 1% (one percent) increase in Welsh within a typical geography, there is an increase of 0.018% in percentage of population with self-care disability.
It is essential to understand that the correlation between the percentage of Welsh and percentage of population with self-care disability does not imply a direct cause-and-effect relationship. It remains uncertain whether the presence of Welsh influences an upward or downward trend in the level of percentage of population with self-care disability within an area, or if Welsh simply ended up residing in those areas with higher or lower levels of percentage of population with self-care disability due to other factors.
Demographics Similar to Welsh by Self-Care Disability
In terms of self-care disability, the demographic groups most similar to Welsh are Immigrants from Bosnia and Herzegovina (2.5%, a difference of 0.020%), Immigrants from Afghanistan (2.5%, a difference of 0.11%), Immigrants from Burma/Myanmar (2.5%, a difference of 0.13%), Immigrants from Kazakhstan (2.5%, a difference of 0.16%), and Pennsylvania German (2.5%, a difference of 0.17%).
| Demographics | Rating | Rank | Self-Care Disability |
| Immigrants from Greece | 57.3 /100 | #167 | Average 2.5% |
| Ute | 57.1 /100 | #168 | Average 2.5% |
| Immigrants from Somalia | 55.9 /100 | #169 | Average 2.5% |
| Scottish | 54.3 /100 | #170 | Average 2.5% |
| Pennsylvania Germans | 53.5 /100 | #171 | Average 2.5% |
| Czechoslovakians | 53.5 /100 | #172 | Average 2.5% |
| Immigrants from Burma/Myanmar | 52.8 /100 | #173 | Average 2.5% |
| Welsh | 50.0 /100 | #174 | Average 2.5% |
| Immigrants from Bosnia and Herzegovina | 49.6 /100 | #175 | Average 2.5% |
| Immigrants from Afghanistan | 47.6 /100 | #176 | Average 2.5% |
| Immigrants from Kazakhstan | 46.7 /100 | #177 | Average 2.5% |
| English | 46.2 /100 | #178 | Average 2.5% |
| Hungarians | 45.5 /100 | #179 | Average 2.5% |
| Indonesians | 41.2 /100 | #180 | Average 2.5% |
| Ghanaians | 40.4 /100 | #181 | Average 2.5% |
Welsh Self-Care Disability Correlation Summary
| Measurement | Welsh Data | Self-Care Disability Data |
| Minimum | 0.24% | 1.6% |
| Maximum | 95.0% | 20.7% |
| Range | 94.8% | 19.1% |
| Mean | 16.5% | 4.0% |
| Median | 13.2% | 3.0% |
| Interquartile 25% (IQ1) | 6.7% | 2.5% |
| Interquartile 75% (IQ3) | 21.3% | 4.4% |
| Interquartile Range (IQR) | 14.6% | 1.8% |
| Standard Deviation (Sample) | 15.6% | 2.9% |
| Standard Deviation (Population) | 15.5% | 2.9% |
Correlation Details
| Welsh Percentile | Sample Size | Self-Care Disability |
[ 0.0% - 0.5% ] 0.24% | 288,198,187 | 2.7% |
[ 0.5% - 1.0% ] 0.67% | 161,644,096 | 2.4% |
[ 1.0% - 1.5% ] 1.13% | 47,882,026 | 2.4% |
[ 1.5% - 2.0% ] 1.62% | 15,690,636 | 2.4% |
[ 2.0% - 2.5% ] 2.09% | 6,490,501 | 2.3% |
[ 2.5% - 3.0% ] 2.59% | 3,289,833 | 2.3% |
[ 3.0% - 3.5% ] 3.06% | 1,296,133 | 2.8% |
[ 3.5% - 4.0% ] 3.56% | 875,397 | 2.7% |
[ 4.0% - 4.5% ] 4.04% | 427,402 | 2.8% |
[ 4.0% - 4.5% ] 4.49% | 273,748 | 2.9% |
[ 4.5% - 5.0% ] 4.97% | 351,609 | 2.7% |
[ 5.0% - 5.5% ] 5.46% | 201,001 | 3.1% |
[ 5.5% - 6.0% ] 5.92% | 104,943 | 2.8% |
[ 6.0% - 6.5% ] 6.40% | 91,551 | 3.3% |
[ 6.5% - 7.0% ] 6.91% | 62,795 | 3.1% |
[ 7.0% - 7.5% ] 7.32% | 48,086 | 3.1% |
[ 7.5% - 8.0% ] 7.79% | 54,979 | 3.5% |
[ 8.0% - 8.5% ] 8.29% | 18,819 | 4.2% |
[ 8.5% - 9.0% ] 8.75% | 18,803 | 3.4% |
[ 9.0% - 9.5% ] 9.24% | 16,224 | 4.4% |
[ 9.5% - 10.0% ] 9.77% | 18,781 | 2.4% |
[ 10.0% - 10.5% ] 10.31% | 6,858 | 4.3% |
[ 10.5% - 11.0% ] 10.72% | 9,088 | 3.1% |
[ 11.0% - 11.5% ] 11.18% | 3,964 | 4.2% |
[ 11.5% - 12.0% ] 11.62% | 14,074 | 2.1% |
[ 12.0% - 12.5% ] 12.20% | 12,947 | 2.8% |
[ 12.5% - 13.0% ] 12.55% | 2,510 | 2.5% |
[ 12.5% - 13.0% ] 12.99% | 1,724 | 2.8% |
[ 13.0% - 13.5% ] 13.48% | 7,113 | 2.7% |
[ 14.0% - 14.5% ] 14.06% | 2,645 | 2.6% |
[ 14.5% - 15.0% ] 14.54% | 8,007 | 3.8% |
[ 14.5% - 15.0% ] 14.88% | 2,030 | 2.6% |
[ 15.5% - 16.0% ] 15.55% | 2,894 | 7.2% |
[ 15.5% - 16.0% ] 15.79% | 1,704 | 5.2% |
[ 16.5% - 17.0% ] 16.93% | 1,181 | 7.9% |
[ 17.5% - 18.0% ] 17.51% | 1,051 | 2.4% |
[ 17.5% - 18.0% ] 17.83% | 1,593 | 4.6% |
[ 18.0% - 18.5% ] 18.43% | 9,039 | 2.5% |
[ 19.0% - 19.5% ] 19.31% | 378 | 3.8% |
[ 19.5% - 20.0% ] 19.78% | 278 | 3.8% |
[ 20.0% - 20.5% ] 20.28% | 143 | 6.2% |
[ 20.5% - 21.0% ] 20.56% | 1,595 | 20.7% |
[ 21.5% - 22.0% ] 21.96% | 1,366 | 5.5% |
[ 22.0% - 22.5% ] 22.49% | 2,219 | 1.7% |
[ 22.5% - 23.0% ] 22.97% | 74 | 12.2% |
[ 24.5% - 25.0% ] 24.56% | 285 | 4.2% |
[ 26.5% - 27.0% ] 26.56% | 64 | 1.6% |
[ 26.5% - 27.0% ] 26.94% | 219 | 4.5% |
[ 29.5% - 30.0% ] 29.70% | 202 | 7.9% |
[ 30.0% - 30.5% ] 30.23% | 43 | 4.7% |
[ 31.0% - 31.5% ] 31.21% | 173 | 1.8% |
[ 32.0% - 32.5% ] 32.05% | 390 | 5.5% |
[ 36.0% - 36.5% ] 36.30% | 146 | 5.5% |
[ 38.5% - 39.0% ] 38.58% | 197 | 2.5% |
[ 60.0% - 60.5% ] 60.47% | 43 | 2.3% |
[ 95.0% - 95.5% ] 95.00% | 100 | 2.0% |