Welsh Receiving Food Stamps

COMPARE

Welsh
Race
Ancestry
AfghanAfricanAlaska NativeAlaskan AthabascanAlbanianAleutAlsatianAmericanApacheArabArapahoArgentineanArmenianAssyrian/Chaldean/SyriacAustralianAustrianBahamianBangladeshiBarbadianBasqueBelgianBelizeanBermudanBhutaneseBlackfeetBolivianBrazilianBritishBritish West IndianBulgarianBurmeseCajunCambodianCanadianCape VerdeanCarpatho RusynCelticCentral AmericanCentral American IndianCherokeeCheyenneChickasawChileanChineseChippewaChoctawColombianColvilleComancheCosta RicanCreeCreekCroatianCrowCubanCypriotCzechCzechoslovakianDanishDelawareDominicanDutchDutch West IndianEastern EuropeanEcuadorianEgyptianEnglishEstonianEthiopianEuropeanFijianFilipinoFinnishFrenchFrench American IndianFrench CanadianGermanGerman RussianGhanaianGreekGuamanian/ChamorroGuatemalanGuyaneseHaitianHmongHonduranHopiHoumaHungarianIcelanderIndian (Asian)IndonesianInupiatIranianIraqiIrishIroquoisIsraeliItalianJamaicanJapaneseJordanianKenyanKiowaKoreanLaotianLatvianLebaneseLiberianLithuanianLumbeeLuxembourgerMacedonianMalaysianMalteseMarshalleseMenomineeMexicanMexican American IndianMongolianMoroccanNative HawaiianNavajoNepaleseNew ZealanderNicaraguanNigerianNorthern EuropeanNorwegianOkinawanOsageOttawaPaiutePakistaniPalestinianPanamanianParaguayanPennsylvania GermanPeruvianPimaPolishPortuguesePotawatomiPuebloPuerto RicanPuget Sound SalishRomanianRussianSalvadoranSamoanScandinavianScotch-IrishScottishSeminoleSenegaleseSerbianShoshoneSierra LeoneanSiouxSlavicSlovakSloveneSomaliSouth AfricanSouth AmericanSouth American IndianSoviet UnionSpaniardSpanishSpanish AmericanSpanish American IndianSri LankanSubsaharan AfricanSudaneseSwedishSwissSyrianTaiwaneseThaiTlingit-HaidaTohono O'OdhamTonganTrinidadian and TobagonianTsimshianTurkishU.S. Virgin IslanderUgandanUkrainianUruguayanUteVenezuelanVietnameseWelshWest IndianYakamaYaquiYugoslavianYumanYup'ikZimbabwean
Immigration
NonimmigrantsImmigrantsAfghanistanAfricaAlbaniaArgentinaArmeniaAsiaAustraliaAustriaBahamasBangladeshBarbadosBelarusBelgiumBelizeBoliviaBosnia and HerzegovinaBrazilBulgariaBurma/MyanmarCabo VerdeCambodiaCameroonCanadaCaribbeanCentral AmericaChileChinaColombiaCongoCosta RicaCroatiaCubaCzechoslovakiaDenmarkDominicaDominican RepublicEastern AfricaEastern AsiaEastern EuropeEcuadorEgyptEl SalvadorEnglandEritreaEthiopiaEuropeFijiFranceGermanyGhanaGreeceGrenadaGuatemalaGuyanaHaitiHondurasHong KongHungaryIndiaIndonesiaIranIraqIrelandIsraelItalyJamaicaJapanJordanKazakhstanKenyaKoreaKuwaitLaosLatin AmericaLatviaLebanonLiberiaLithuaniaMalaysiaMexicoMicronesiaMiddle AfricaMoldovaMoroccoNepalNetherlandsNicaraguaNigeriaNorth AmericaNorth MacedoniaNorthern AfricaNorthern EuropeNorwayOceaniaPakistanPanamaPeruPhilippinesPolandPortugalRomaniaRussiaSaudi ArabiaScotlandSenegalSerbiaSierra LeoneSingaporeSomaliaSouth AfricaSouth AmericaSouth Central AsiaSouth Eastern AsiaSouthern EuropeSpainSri LankaSt. Vincent and the GrenadinesSudanSwedenSwitzerlandSyriaTaiwanThailandTrinidad and TobagoTurkeyUgandaUkraineUruguayUzbekistanVenezuelaVietnamWest IndiesWestern AfricaWestern AsiaWestern EuropeYemenZaireZimbabweAzores
Select to Compare
Race
Ancestry
AfghanAfricanAlaska NativeAlaskan AthabascanAlbanianAleutAlsatianAmericanApacheArabArapahoArgentineanArmenianAssyrian/Chaldean/SyriacAustralianAustrianBahamianBangladeshiBarbadianBasqueBelgianBelizeanBermudanBhutaneseBlackfeetBolivianBrazilianBritishBritish West IndianBulgarianBurmeseCajunCambodianCanadianCape VerdeanCarpatho RusynCelticCentral AmericanCentral American IndianCherokeeCheyenneChickasawChileanChineseChippewaChoctawColombianColvilleComancheCosta RicanCreeCreekCroatianCrowCubanCypriotCzechCzechoslovakianDanishDelawareDominicanDutchDutch West IndianEastern EuropeanEcuadorianEgyptianEnglishEstonianEthiopianEuropeanFijianFilipinoFinnishFrenchFrench American IndianFrench CanadianGermanGerman RussianGhanaianGreekGuamanian/ChamorroGuatemalanGuyaneseHaitianHmongHonduranHopiHoumaHungarianIcelanderIndian (Asian)IndonesianInupiatIranianIraqiIrishIroquoisIsraeliItalianJamaicanJapaneseJordanianKenyanKiowaKoreanLaotianLatvianLebaneseLiberianLithuanianLumbeeLuxembourgerMacedonianMalaysianMalteseMarshalleseMenomineeMexicanMexican American IndianMongolianMoroccanNative HawaiianNavajoNepaleseNew ZealanderNicaraguanNigerianNorthern EuropeanNorwegianOkinawanOsageOttawaPaiutePakistaniPalestinianPanamanianParaguayanPennsylvania GermanPeruvianPimaPolishPortuguesePotawatomiPuebloPuerto RicanPuget Sound SalishRomanianRussianSalvadoranSamoanScandinavianScotch-IrishScottishSeminoleSenegaleseSerbianShoshoneSierra LeoneanSiouxSlavicSlovakSloveneSomaliSouth AfricanSouth AmericanSouth American IndianSoviet UnionSpaniardSpanishSpanish AmericanSpanish American IndianSri LankanSubsaharan AfricanSudaneseSwedishSwissSyrianTaiwaneseThaiTlingit-HaidaTohono O'OdhamTonganTrinidadian and TobagonianTsimshianTurkishU.S. Virgin IslanderUgandanUkrainianUruguayanUteVenezuelanVietnameseWest IndianYakamaYaquiYugoslavianYumanYup'ikZimbabwean
Immigration
NonimmigrantsImmigrantsAfghanistanAfricaAlbaniaArgentinaArmeniaAsiaAustraliaAustriaBahamasBangladeshBarbadosBelarusBelgiumBelizeBoliviaBosnia and HerzegovinaBrazilBulgariaBurma/MyanmarCabo VerdeCambodiaCameroonCanadaCaribbeanCentral AmericaChileChinaColombiaCongoCosta RicaCroatiaCubaCzechoslovakiaDenmarkDominicaDominican RepublicEastern AfricaEastern AsiaEastern EuropeEcuadorEgyptEl SalvadorEnglandEritreaEthiopiaEuropeFijiFranceGermanyGhanaGreeceGrenadaGuatemalaGuyanaHaitiHondurasHong KongHungaryIndiaIndonesiaIranIraqIrelandIsraelItalyJamaicaJapanJordanKazakhstanKenyaKoreaKuwaitLaosLatin AmericaLatviaLebanonLiberiaLithuaniaMalaysiaMexicoMicronesiaMiddle AfricaMoldovaMoroccoNepalNetherlandsNicaraguaNigeriaNorth AmericaNorth MacedoniaNorthern AfricaNorthern EuropeNorwayOceaniaPakistanPanamaPeruPhilippinesPolandPortugalRomaniaRussiaSaudi ArabiaScotlandSenegalSerbiaSierra LeoneSingaporeSomaliaSouth AfricaSouth AmericaSouth Central AsiaSouth Eastern AsiaSouthern EuropeSpainSri LankaSt. Vincent and the GrenadinesSudanSwedenSwitzerlandSyriaTaiwanThailandTrinidad and TobagoTurkeyUgandaUkraineUruguayUzbekistanVenezuelaVietnamWest IndiesWestern AfricaWestern AsiaWestern EuropeYemenZaireZimbabweAzores
Receiving Food Stamps
Income
Poverty
Unemployment
Labor Participation
Family Structure
Vehicle Availability
Education Level
Disability

Welsh Receiving Food Stamps
Exceptional

10.3%
PUBLIC INCOME | FOOD STAMPS
97.3/ 100
METRIC RATING
96th/ 347
METRIC RANK

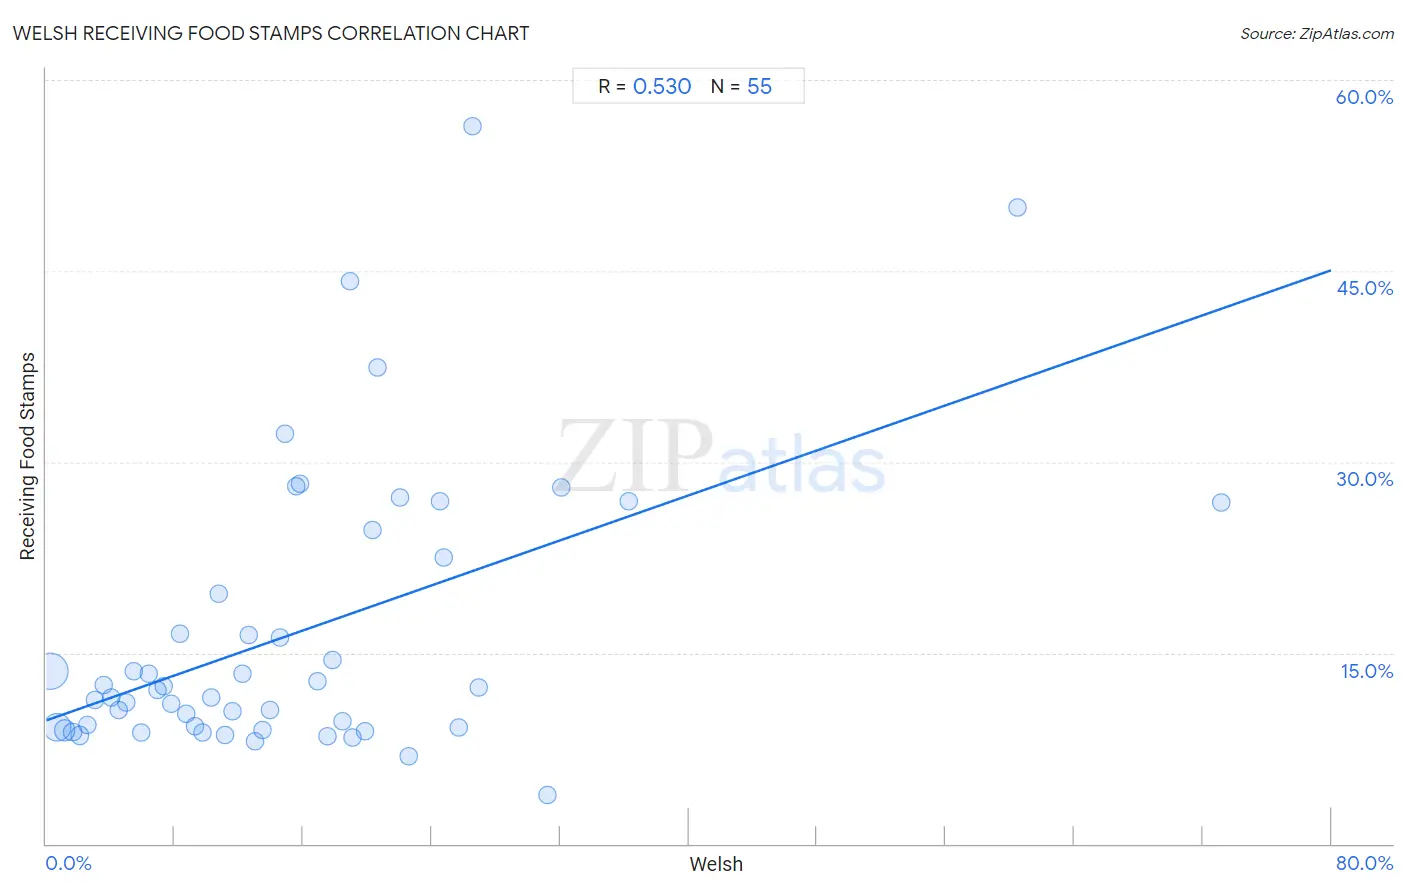
Welsh Receiving Food Stamps Correlation Chart

The statistical analysis conducted on geographies consisting of 526,059,303 people shows a substantial positive correlation between the proportion of Welsh and percentage of population receiving government assistance and/or food stamps in the United States with a correlation coefficient (R) of 0.530 and weighted average of 10.3%. On average, for every 1% (one percent) increase in Welsh within a typical geography, there is an increase of 0.44% in percentage of population receiving government assistance and/or food stamps.
Welsh Receiving Food Stamps
It is essential to understand that the correlation between the percentage of Welsh and percentage of population receiving government assistance and/or food stamps does not imply a direct cause-and-effect relationship. It remains uncertain whether the presence of Welsh influences an upward or downward trend in the level of percentage of population receiving government assistance and/or food stamps within an area, or if Welsh simply ended up residing in those areas with higher or lower levels of percentage of population receiving government assistance and/or food stamps due to other factors.

Demographics Similar to Welsh by Receiving Food Stamps

In terms of receiving food stamps, the demographic groups most similar to Welsh are Basque (10.3%, a difference of 0.050%), Immigrants from Greece (10.3%, a difference of 0.080%), Czechoslovakian (10.3%, a difference of 0.26%), Immigrants from Egypt (10.3%, a difference of 0.31%), and Serbian (10.3%, a difference of 0.49%).
DemographicsRating | RankReceiving Food Stamps
Immigrants from France
98.3
/100
|
#89
Exceptional
10.1%
Finns
97.9
/100
|
#90
Exceptional
10.2%
Jordanians
97.9
/100
|
#91
Exceptional
10.2%
Irish
97.9
/100
|
#92
Exceptional
10.2%
Belgians
97.7
/100
|
#93
Exceptional
10.2%
Immigrants from Greece
97.4
/100
|
#94
Exceptional
10.3%
Basques
97.4
/100
|
#95
Exceptional
10.3%
Welsh
97.3
/100
|
#96
Exceptional
10.3%
Czechoslovakians
97.2
/100
|
#97
Exceptional
10.3%
Immigrants from Egypt
97.1
/100
|
#98
Exceptional
10.3%
Serbians
97.0
/100
|
#99
Exceptional
10.3%
Immigrants from Western Europe
96.9
/100
|
#100
Exceptional
10.3%
Palestinians
96.9
/100
|
#101
Exceptional
10.3%
Immigrants from Europe
96.8
/100
|
#102
Exceptional
10.3%
Immigrants from Latvia
96.8
/100
|
#103
Exceptional
10.3%

Welsh Receiving Food Stamps Correlation Summary

MeasurementWelsh DataReceiving Food Stamps Data
Minimum0.24%3.8%
Maximum73.2%56.4%
Range72.9%52.6%
Mean15.4%16.5%
Median13.0%12.1%
Interquartile 25% (IQ1)6.4%9.1%
Interquartile 75% (IQ3)20.3%22.5%
Interquartile Range (IQR)13.9%13.4%
Standard Deviation (Sample)13.4%11.2%
Standard Deviation (Population)13.2%11.1%

Correlation Details

Welsh PercentileSample SizeReceiving Food Stamps
[
0.0%
-
0.5%
]
0.24%
287,712,26413.6%
[
0.5%
-
1.0%
]
0.67%
161,193,7379.2%
[
1.0%
-
1.5%
]
1.13%
47,760,0098.9%
[
1.5%
-
2.0%
]
1.62%
15,690,8098.8%
[
2.0%
-
2.5%
]
2.09%
6,448,9398.5%
[
2.5%
-
3.0%
]
2.59%
3,288,7379.3%
[
3.0%
-
3.5%
]
3.06%
1,311,11911.3%
[
3.5%
-
4.0%
]
3.56%
886,47012.5%
[
4.0%
-
4.5%
]
4.04%
423,18411.5%
[
4.0%
-
4.5%
]
4.49%
272,57210.5%
[
4.5%
-
5.0%
]
4.97%
342,17911.1%
[
5.0%
-
5.5%
]
5.46%
188,55713.6%
[
5.5%
-
6.0%
]
5.92%
105,1028.8%
[
6.0%
-
6.5%
]
6.40%
94,12013.3%
[
6.5%
-
7.0%
]
6.91%
63,48712.1%
[
7.0%
-
7.5%
]
7.32%
50,03012.3%
[
7.5%
-
8.0%
]
7.80%
52,98311.0%
[
8.0%
-
8.5%
]
8.29%
19,65916.5%
[
8.5%
-
9.0%
]
8.74%
18,73510.3%
[
9.0%
-
9.5%
]
9.25%
17,2579.2%
[
9.5%
-
10.0%
]
9.76%
18,2388.8%
[
10.0%
-
10.5%
]
10.26%
8,04911.5%
[
10.5%
-
11.0%
]
10.71%
10,14919.6%
[
11.0%
-
11.5%
]
11.16%
4,5878.6%
[
11.5%
-
12.0%
]
11.62%
14,33910.4%
[
12.0%
-
12.5%
]
12.20%
13,46013.3%
[
12.5%
-
13.0%
]
12.59%
1,62816.4%
[
13.0%
-
13.5%
]
13.01%
1,5538.1%
[
13.0%
-
13.5%
]
13.48%
6,9668.9%
[
13.5%
-
14.0%
]
13.96%
3,86010.5%
[
14.5%
-
15.0%
]
14.54%
7,88316.2%
[
14.5%
-
15.0%
]
14.87%
1,80932.2%
[
15.5%
-
16.0%
]
15.55%
3,19028.1%
[
15.5%
-
16.0%
]
15.80%
1,81028.3%
[
16.5%
-
17.0%
]
16.92%
1,04612.8%
[
17.5%
-
18.0%
]
17.51%
1,0518.4%
[
17.5%
-
18.0%
]
17.83%
1,72214.4%
[
18.0%
-
18.5%
]
18.43%
9,0399.6%
[
18.5%
-
19.0%
]
18.89%
9044.2%
[
19.0%
-
19.5%
]
19.10%
898.3%
[
19.5%
-
20.0%
]
19.81%
4298.9%
[
20.0%
-
20.5%
]
20.28%
14324.6%
[
20.5%
-
21.0%
]
20.63%
2,03137.5%
[
21.5%
-
22.0%
]
21.99%
1,85527.2%
[
22.5%
-
23.0%
]
22.53%
2,6326.8%
[
24.5%
-
25.0%
]
24.53%
42826.9%
[
24.5%
-
25.0%
]
24.74%
9722.5%
[
25.5%
-
26.0%
]
25.71%
1059.1%
[
26.5%
-
27.0%
]
26.56%
6456.4%
[
26.5%
-
27.0%
]
26.94%
21912.3%
[
31.0%
-
31.5%
]
31.21%
1733.8%
[
32.0%
-
32.5%
]
32.05%
39028.0%
[
36.0%
-
36.5%
]
36.30%
14626.9%
[
60.0%
-
60.5%
]
60.47%
4350.0%
[
73.0%
-
73.5%
]
73.17%
4126.8%