Lebanese Female Disability
COMPARE
Lebanese
Select to Compare
Female Disability
Lebanese Female Disability
12.2%
DISABILITY | FEMALES
58.1/ 100
METRIC RATING
169th/ 347
METRIC RANK
Lebanese Female Disability Correlation Chart
The statistical analysis conducted on geographies consisting of 401,580,579 people shows a substantial positive correlation between the proportion of Lebanese and percentage of females with a disability in the United States with a correlation coefficient (R) of 0.569 and weighted average of 12.2%. On average, for every 1% (one percent) increase in Lebanese within a typical geography, there is an increase of 0.45% in percentage of females with a disability.
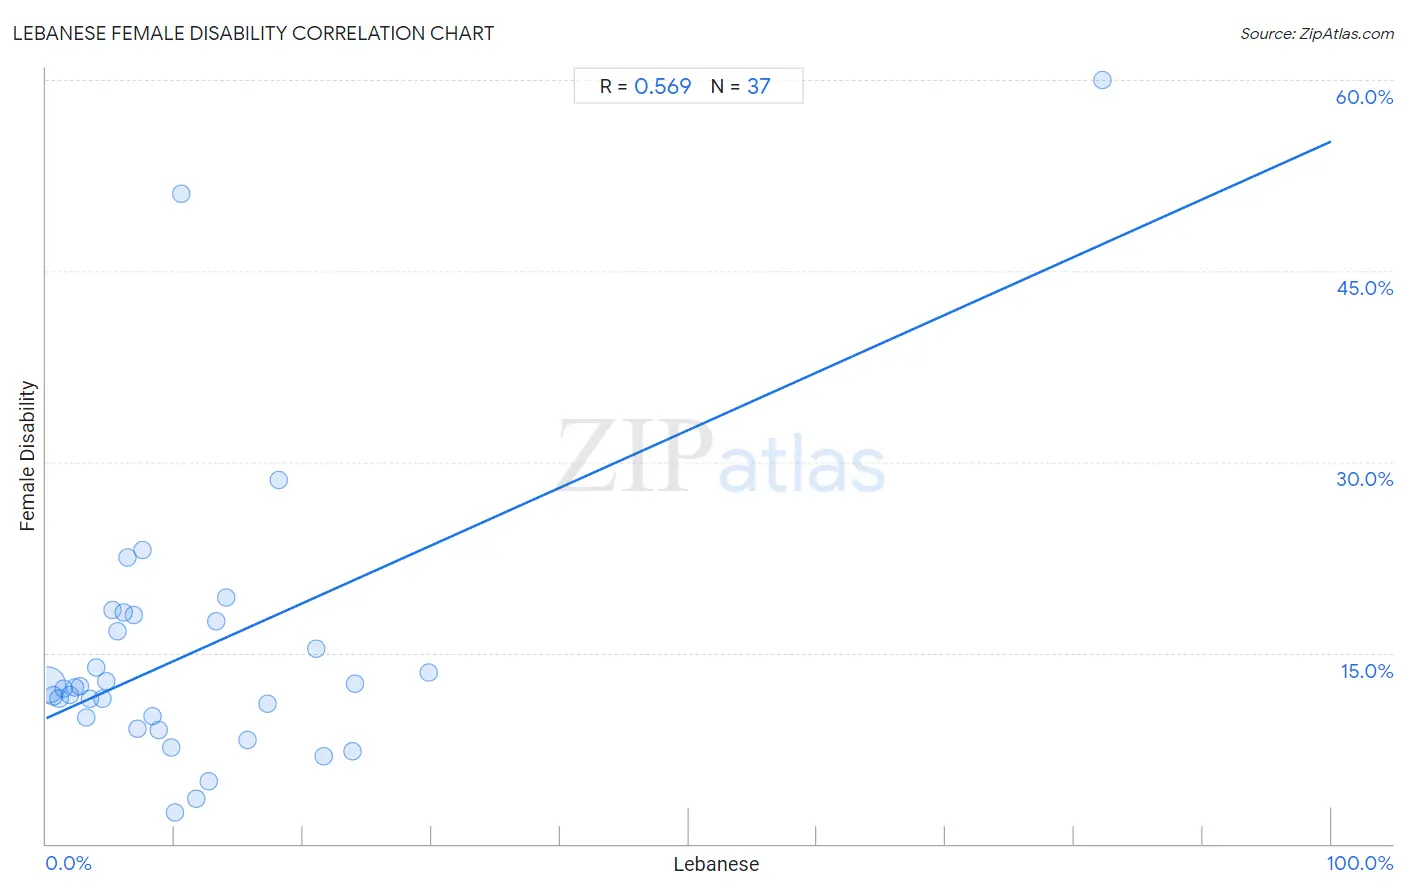
It is essential to understand that the correlation between the percentage of Lebanese and percentage of females with a disability does not imply a direct cause-and-effect relationship. It remains uncertain whether the presence of Lebanese influences an upward or downward trend in the level of percentage of females with a disability within an area, or if Lebanese simply ended up residing in those areas with higher or lower levels of percentage of females with a disability due to other factors.
Demographics Similar to Lebanese by Female Disability
In terms of female disability, the demographic groups most similar to Lebanese are Immigrants from Haiti (12.2%, a difference of 0.030%), Immigrants from Latin America (12.2%, a difference of 0.040%), Maltese (12.2%, a difference of 0.040%), Lithuanian (12.2%, a difference of 0.050%), and Immigrants from Southern Europe (12.2%, a difference of 0.070%).
| Demographics | Rating | Rank | Female Disability |
| Immigrants from Ukraine | 64.3 /100 | #162 | Good 12.1% |
| Guatemalans | 63.8 /100 | #163 | Good 12.1% |
| Czechs | 63.6 /100 | #164 | Good 12.1% |
| Immigrants from Oceania | 61.8 /100 | #165 | Good 12.1% |
| Lithuanians | 59.5 /100 | #166 | Average 12.2% |
| Immigrants from Latin America | 59.0 /100 | #167 | Average 12.2% |
| Immigrants from Haiti | 58.8 /100 | #168 | Average 12.2% |
| Lebanese | 58.1 /100 | #169 | Average 12.2% |
| Maltese | 57.0 /100 | #170 | Average 12.2% |
| Immigrants from Southern Europe | 56.3 /100 | #171 | Average 12.2% |
| Haitians | 51.9 /100 | #172 | Average 12.2% |
| Immigrants from Mexico | 50.8 /100 | #173 | Average 12.2% |
| Immigrants from England | 50.0 /100 | #174 | Average 12.2% |
| Immigrants from St. Vincent and the Grenadines | 49.7 /100 | #175 | Average 12.2% |
| Immigrants from Guyana | 43.1 /100 | #176 | Average 12.2% |
Lebanese Female Disability Correlation Summary
| Measurement | Lebanese Data | Female Disability Data |
| Minimum | 0.14% | 2.4% |
| Maximum | 82.2% | 60.0% |
| Range | 82.1% | 57.6% |
| Mean | 11.5% | 15.1% |
| Median | 7.5% | 12.3% |
| Interquartile 25% (IQ1) | 3.7% | 9.5% |
| Interquartile 75% (IQ3) | 14.8% | 17.8% |
| Interquartile Range (IQR) | 11.1% | 8.3% |
| Standard Deviation (Sample) | 14.1% | 11.2% |
| Standard Deviation (Population) | 13.9% | 11.1% |
Correlation Details
| Lebanese Percentile | Sample Size | Female Disability |
[ 0.0% - 0.5% ] 0.14% | 348,625,317 | 12.5% |
[ 0.5% - 1.0% ] 0.55% | 37,688,637 | 11.6% |
[ 0.5% - 1.0% ] 0.99% | 8,842,785 | 11.4% |
[ 1.0% - 1.5% ] 1.39% | 3,368,307 | 12.2% |
[ 1.5% - 2.0% ] 1.84% | 1,215,794 | 11.7% |
[ 2.0% - 2.5% ] 2.21% | 622,487 | 12.3% |
[ 2.5% - 3.0% ] 2.60% | 425,130 | 12.4% |
[ 3.0% - 3.5% ] 3.10% | 160,906 | 9.9% |
[ 3.0% - 3.5% ] 3.42% | 83,826 | 11.4% |
[ 3.5% - 4.0% ] 3.90% | 132,253 | 13.8% |
[ 4.0% - 4.5% ] 4.35% | 14,447 | 11.4% |
[ 4.5% - 5.0% ] 4.70% | 19,352 | 12.8% |
[ 5.0% - 5.5% ] 5.16% | 31,752 | 18.3% |
[ 5.5% - 6.0% ] 5.51% | 11,179 | 16.7% |
[ 6.0% - 6.5% ] 6.08% | 1,728 | 18.1% |
[ 6.0% - 6.5% ] 6.34% | 1,231 | 22.5% |
[ 6.5% - 7.0% ] 6.78% | 8,720 | 18.0% |
[ 7.0% - 7.5% ] 7.08% | 7,982 | 9.0% |
[ 7.5% - 8.0% ] 7.52% | 1,277 | 23.1% |
[ 8.0% - 8.5% ] 8.31% | 34,371 | 10.1% |
[ 8.5% - 9.0% ] 8.72% | 470 | 8.9% |
[ 9.5% - 10.0% ] 9.72% | 1,039 | 7.6% |
[ 10.0% - 10.5% ] 10.02% | 479 | 2.4% |
[ 10.5% - 11.0% ] 10.53% | 361 | 51.1% |
[ 11.5% - 12.0% ] 11.67% | 180 | 3.5% |
[ 12.5% - 13.0% ] 12.67% | 2,359 | 5.0% |
[ 13.0% - 13.5% ] 13.22% | 469 | 17.5% |
[ 13.5% - 14.0% ] 13.97% | 229 | 19.4% |
[ 15.5% - 16.0% ] 15.63% | 531 | 8.1% |
[ 17.0% - 17.5% ] 17.21% | 108,414 | 11.0% |
[ 18.0% - 18.5% ] 18.09% | 94 | 28.6% |
[ 21.0% - 21.5% ] 21.06% | 62,474 | 15.3% |
[ 21.5% - 22.0% ] 21.57% | 51 | 6.9% |
[ 23.5% - 24.0% ] 23.82% | 12,405 | 7.3% |
[ 24.0% - 24.5% ] 24.07% | 53,044 | 12.5% |
[ 29.5% - 30.0% ] 29.74% | 40,392 | 13.5% |
[ 82.0% - 82.5% ] 82.24% | 107 | 60.0% |