Lebanese Disability
COMPARE
Lebanese
Select to Compare
Disability
Lebanese Disability
11.8%
DISABILITY
27.9/ 100
METRIC RATING
187th/ 347
METRIC RANK
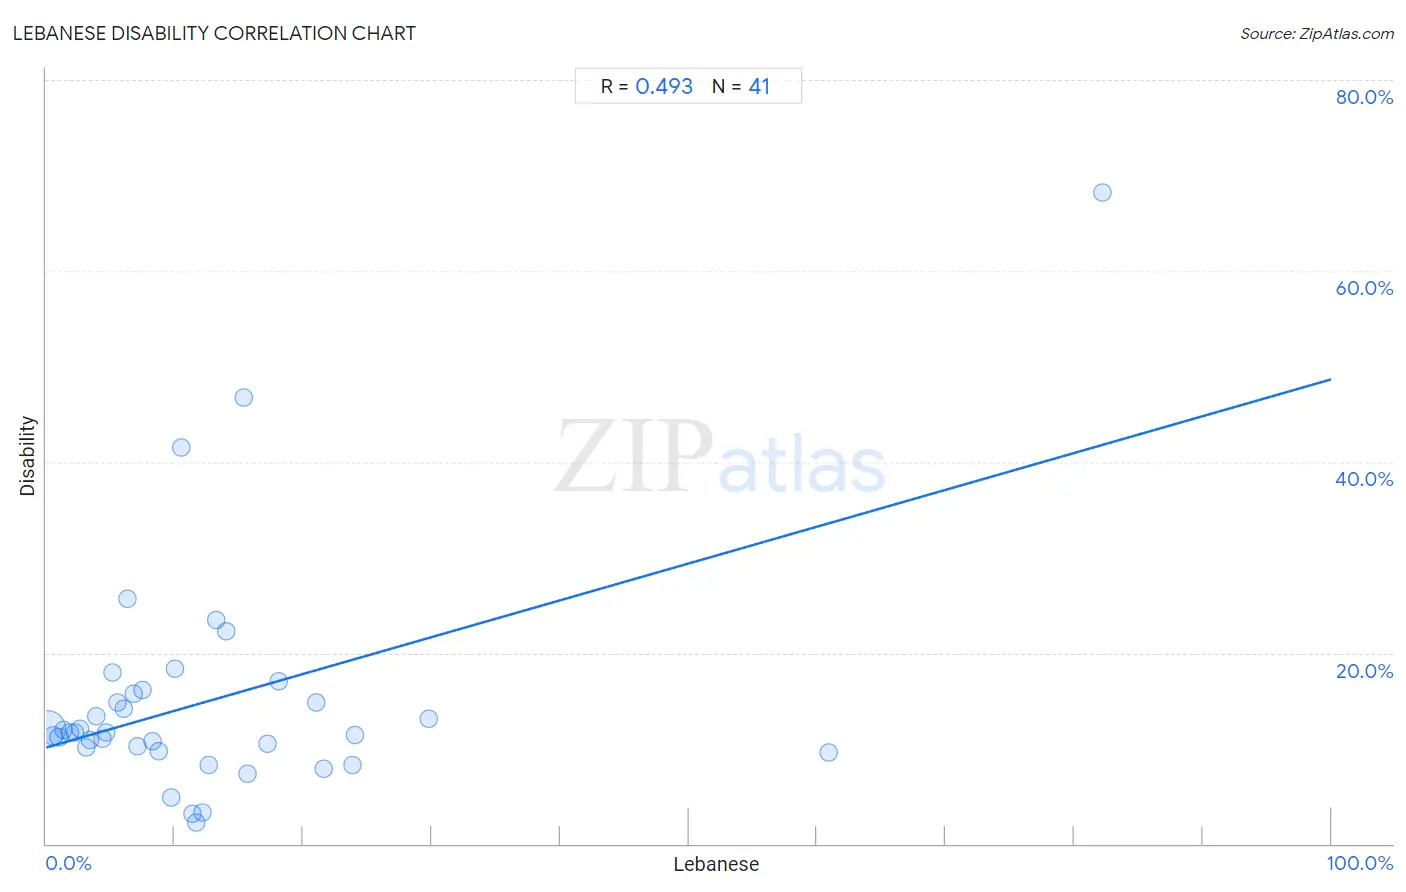
Lebanese Disability Correlation Chart
The statistical analysis conducted on geographies consisting of 401,592,225 people shows a moderate positive correlation between the proportion of Lebanese and percentage of population with a disability in the United States with a correlation coefficient (R) of 0.493 and weighted average of 11.8%. On average, for every 1% (one percent) increase in Lebanese within a typical geography, there is an increase of 0.39% in percentage of population with a disability.
It is essential to understand that the correlation between the percentage of Lebanese and percentage of population with a disability does not imply a direct cause-and-effect relationship. It remains uncertain whether the presence of Lebanese influences an upward or downward trend in the level of percentage of population with a disability within an area, or if Lebanese simply ended up residing in those areas with higher or lower levels of percentage of population with a disability due to other factors.
Demographics Similar to Lebanese by Disability
In terms of disability, the demographic groups most similar to Lebanese are Immigrants from Scotland (11.8%, a difference of 0.020%), Immigrants from Burma/Myanmar (11.8%, a difference of 0.030%), Iraqi (11.8%, a difference of 0.11%), Honduran (11.8%, a difference of 0.18%), and Immigrants from Mexico (11.9%, a difference of 0.24%).
| Demographics | Rating | Rank | Disability |
| Immigrants from Honduras | 37.8 /100 | #180 | Fair 11.8% |
| Immigrants from Oceania | 34.3 /100 | #181 | Fair 11.8% |
| Icelanders | 34.0 /100 | #182 | Fair 11.8% |
| Hondurans | 31.2 /100 | #183 | Fair 11.8% |
| Iraqis | 30.0 /100 | #184 | Fair 11.8% |
| Immigrants from Burma/Myanmar | 28.5 /100 | #185 | Fair 11.8% |
| Immigrants from Scotland | 28.2 /100 | #186 | Fair 11.8% |
| Lebanese | 27.9 /100 | #187 | Fair 11.8% |
| Immigrants from Mexico | 23.8 /100 | #188 | Fair 11.9% |
| Immigrants from Zaire | 21.8 /100 | #189 | Fair 11.9% |
| Immigrants from West Indies | 21.1 /100 | #190 | Fair 11.9% |
| Ute | 19.5 /100 | #191 | Poor 11.9% |
| Lithuanians | 18.8 /100 | #192 | Poor 11.9% |
| Immigrants from Bosnia and Herzegovina | 18.0 /100 | #193 | Poor 11.9% |
| Somalis | 17.3 /100 | #194 | Poor 11.9% |
Lebanese Disability Correlation Summary
| Measurement | Lebanese Data | Disability Data |
| Minimum | 0.14% | 2.2% |
| Maximum | 82.2% | 68.2% |
| Range | 82.1% | 66.0% |
| Mean | 12.8% | 15.0% |
| Median | 8.8% | 11.6% |
| Interquartile 25% (IQ1) | 4.1% | 9.9% |
| Interquartile 75% (IQ3) | 15.5% | 16.0% |
| Interquartile Range (IQR) | 11.4% | 6.0% |
| Standard Deviation (Sample) | 15.5% | 12.1% |
| Standard Deviation (Population) | 15.3% | 11.9% |
Correlation Details
| Lebanese Percentile | Sample Size | Disability |
[ 0.0% - 0.5% ] 0.14% | 348,626,905 | 12.1% |
[ 0.5% - 1.0% ] 0.55% | 37,689,912 | 11.3% |
[ 0.5% - 1.0% ] 0.99% | 8,844,018 | 11.2% |
[ 1.0% - 1.5% ] 1.39% | 3,369,433 | 11.9% |
[ 1.5% - 2.0% ] 1.84% | 1,218,414 | 11.6% |
[ 2.0% - 2.5% ] 2.21% | 622,669 | 11.7% |
[ 2.5% - 3.0% ] 2.60% | 425,130 | 12.0% |
[ 3.0% - 3.5% ] 3.10% | 160,906 | 10.1% |
[ 3.0% - 3.5% ] 3.42% | 83,909 | 10.9% |
[ 3.5% - 4.0% ] 3.90% | 132,801 | 13.4% |
[ 4.0% - 4.5% ] 4.35% | 14,447 | 11.0% |
[ 4.5% - 5.0% ] 4.70% | 19,352 | 11.6% |
[ 5.0% - 5.5% ] 5.16% | 31,752 | 18.0% |
[ 5.5% - 6.0% ] 5.51% | 11,382 | 14.7% |
[ 6.0% - 6.5% ] 6.08% | 1,728 | 14.1% |
[ 6.0% - 6.5% ] 6.34% | 1,231 | 25.7% |
[ 6.5% - 7.0% ] 6.78% | 8,720 | 15.7% |
[ 7.0% - 7.5% ] 7.08% | 7,982 | 10.2% |
[ 7.5% - 8.0% ] 7.52% | 1,277 | 16.2% |
[ 8.0% - 8.5% ] 8.31% | 34,676 | 10.8% |
[ 8.5% - 9.0% ] 8.76% | 639 | 9.7% |
[ 9.5% - 10.0% ] 9.72% | 1,039 | 4.8% |
[ 10.0% - 10.5% ] 10.02% | 479 | 18.3% |
[ 10.5% - 11.0% ] 10.53% | 361 | 41.5% |
[ 11.0% - 11.5% ] 11.40% | 772 | 3.1% |
[ 11.5% - 12.0% ] 11.67% | 180 | 2.2% |
[ 12.0% - 12.5% ] 12.12% | 726 | 3.3% |
[ 12.5% - 13.0% ] 12.67% | 2,359 | 8.2% |
[ 13.0% - 13.5% ] 13.22% | 469 | 23.5% |
[ 13.5% - 14.0% ] 13.97% | 229 | 22.3% |
[ 15.0% - 15.5% ] 15.38% | 156 | 46.8% |
[ 15.5% - 16.0% ] 15.63% | 531 | 7.3% |
[ 17.0% - 17.5% ] 17.21% | 108,414 | 10.5% |
[ 18.0% - 18.5% ] 18.09% | 94 | 17.0% |
[ 21.0% - 21.5% ] 21.06% | 62,474 | 14.7% |
[ 21.5% - 22.0% ] 21.57% | 51 | 7.8% |
[ 23.5% - 24.0% ] 23.82% | 12,405 | 8.2% |
[ 24.0% - 24.5% ] 24.07% | 53,044 | 11.4% |
[ 29.5% - 30.0% ] 29.74% | 40,392 | 13.1% |
[ 60.5% - 61.0% ] 60.91% | 660 | 9.5% |
[ 82.0% - 82.5% ] 82.24% | 107 | 68.2% |