Lebanese 4 or more Vehicles in Household
COMPARE
Lebanese
Select to Compare
4 or more Vehicles in Household
Lebanese 4 or more Vehicles in Household
6.4%
4+ VEHICLES AVAILABLE
55.8/ 100
METRIC RATING
168th/ 347
METRIC RANK
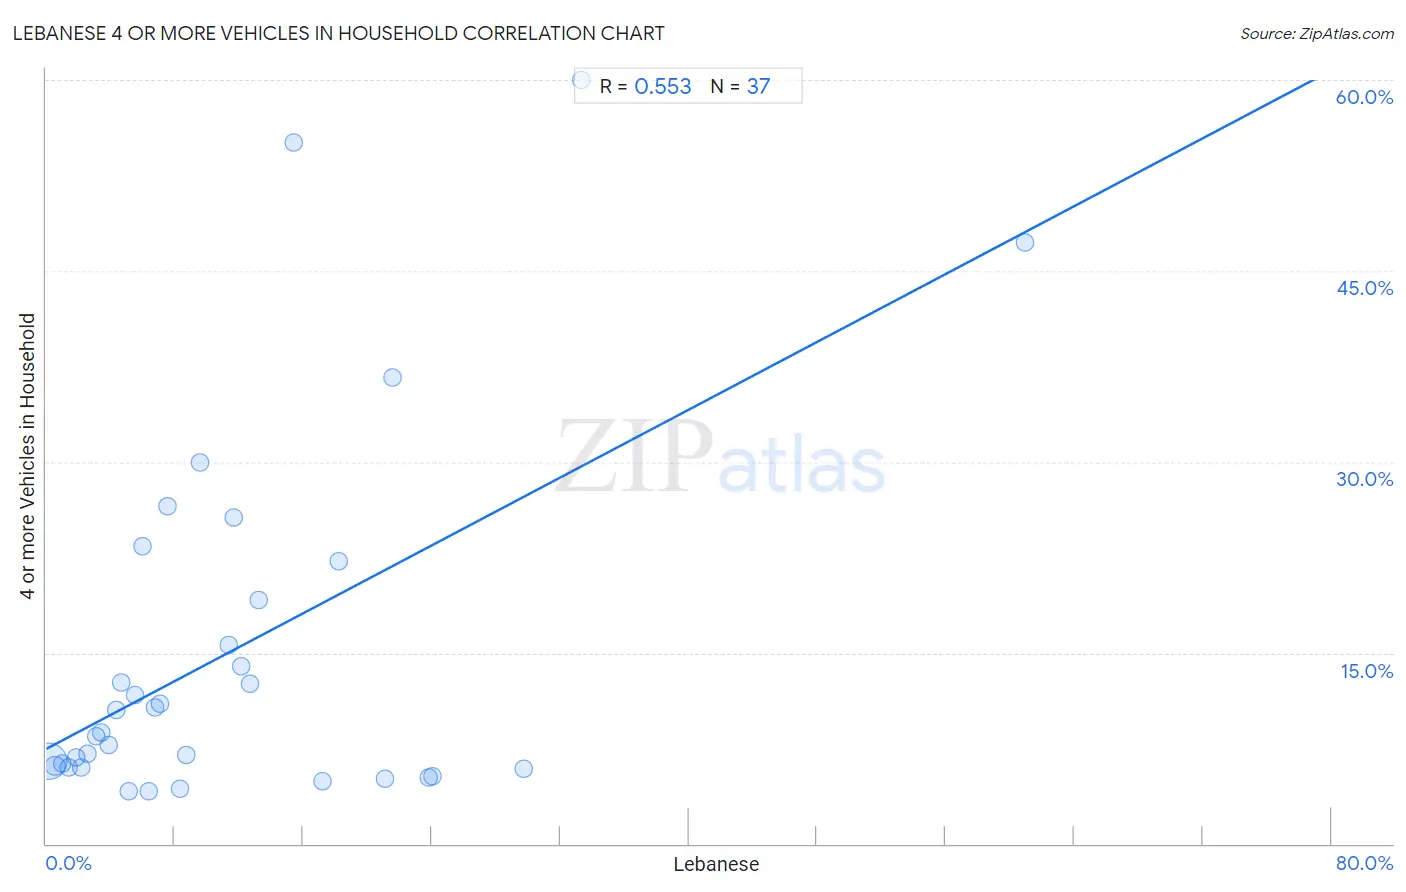
Lebanese 4 or more Vehicles in Household Correlation Chart
The statistical analysis conducted on geographies consisting of 399,865,958 people shows a substantial positive correlation between the proportion of Lebanese and percentage of households with 4 or more vehicles available in the United States with a correlation coefficient (R) of 0.553 and weighted average of 6.4%. On average, for every 1% (one percent) increase in Lebanese within a typical geography, there is an increase of 0.67% in percentage of households with 4 or more vehicles available.
It is essential to understand that the correlation between the percentage of Lebanese and percentage of households with 4 or more vehicles available does not imply a direct cause-and-effect relationship. It remains uncertain whether the presence of Lebanese influences an upward or downward trend in the level of percentage of households with 4 or more vehicles available within an area, or if Lebanese simply ended up residing in those areas with higher or lower levels of percentage of households with 4 or more vehicles available due to other factors.
Demographics Similar to Lebanese by 4 or more Vehicles in Household
In terms of 4 or more vehicles in household, the demographic groups most similar to Lebanese are Estonian (6.4%, a difference of 0.070%), Polish (6.4%, a difference of 0.11%), Immigrants from Denmark (6.4%, a difference of 0.20%), Immigrants from Syria (6.3%, a difference of 0.31%), and Immigrants from India (6.3%, a difference of 0.40%).
| Demographics | Rating | Rank | 4 or more Vehicles in Household |
| Immigrants from Cameroon | 64.4 /100 | #161 | Good 6.4% |
| Immigrants from Pakistan | 63.2 /100 | #162 | Good 6.4% |
| Chileans | 61.2 /100 | #163 | Good 6.4% |
| Hungarians | 61.1 /100 | #164 | Good 6.4% |
| Immigrants from Peru | 59.8 /100 | #165 | Average 6.4% |
| Immigrants from Denmark | 57.8 /100 | #166 | Average 6.4% |
| Poles | 56.9 /100 | #167 | Average 6.4% |
| Lebanese | 55.8 /100 | #168 | Average 6.4% |
| Estonians | 55.1 /100 | #169 | Average 6.4% |
| Immigrants from Syria | 52.8 /100 | #170 | Average 6.3% |
| Immigrants from India | 51.9 /100 | #171 | Average 6.3% |
| Immigrants from Lebanon | 51.7 /100 | #172 | Average 6.3% |
| Slovenes | 51.1 /100 | #173 | Average 6.3% |
| Lithuanians | 50.0 /100 | #174 | Average 6.3% |
| Immigrants from Western Europe | 48.8 /100 | #175 | Average 6.3% |
Lebanese 4 or more Vehicles in Household Correlation Summary
| Measurement | Lebanese Data | 4 or more Vehicles in Household Data |
| Minimum | 0.14% | 4.1% |
| Maximum | 60.9% | 60.0% |
| Range | 60.8% | 55.9% |
| Mean | 11.5% | 15.1% |
| Median | 7.5% | 8.8% |
| Interquartile 25% (IQ1) | 3.7% | 6.0% |
| Interquartile 75% (IQ3) | 16.3% | 20.7% |
| Interquartile Range (IQR) | 12.6% | 14.7% |
| Standard Deviation (Sample) | 11.9% | 14.3% |
| Standard Deviation (Population) | 11.7% | 14.1% |
Correlation Details
| Lebanese Percentile | Sample Size | 4 or more Vehicles in Household |
[ 0.0% - 0.5% ] 0.14% | 347,383,820 | 6.5% |
[ 0.5% - 1.0% ] 0.55% | 37,438,089 | 6.1% |
[ 0.5% - 1.0% ] 0.99% | 8,712,738 | 6.3% |
[ 1.0% - 1.5% ] 1.39% | 3,329,307 | 6.0% |
[ 1.5% - 2.0% ] 1.84% | 1,204,397 | 6.8% |
[ 2.0% - 2.5% ] 2.21% | 596,128 | 6.0% |
[ 2.5% - 3.0% ] 2.60% | 418,720 | 7.1% |
[ 3.0% - 3.5% ] 3.10% | 156,860 | 8.4% |
[ 3.0% - 3.5% ] 3.42% | 82,609 | 8.8% |
[ 3.5% - 4.0% ] 3.90% | 131,272 | 7.7% |
[ 4.0% - 4.5% ] 4.35% | 13,824 | 10.5% |
[ 4.5% - 5.0% ] 4.70% | 19,352 | 12.6% |
[ 5.0% - 5.5% ] 5.16% | 31,611 | 4.2% |
[ 5.5% - 6.0% ] 5.51% | 10,451 | 11.6% |
[ 6.0% - 6.5% ] 6.00% | 783 | 23.3% |
[ 6.0% - 6.5% ] 6.37% | 628 | 4.1% |
[ 6.5% - 7.0% ] 6.78% | 8,720 | 10.7% |
[ 7.0% - 7.5% ] 7.08% | 7,982 | 11.0% |
[ 7.5% - 8.0% ] 7.52% | 1,277 | 26.5% |
[ 8.0% - 8.5% ] 8.31% | 34,371 | 4.3% |
[ 8.5% - 9.0% ] 8.73% | 378 | 7.0% |
[ 9.5% - 10.0% ] 9.61% | 281 | 29.9% |
[ 11.0% - 11.5% ] 11.40% | 772 | 15.6% |
[ 11.5% - 12.0% ] 11.67% | 180 | 25.6% |
[ 12.0% - 12.5% ] 12.12% | 726 | 13.9% |
[ 12.5% - 13.0% ] 12.67% | 2,359 | 12.5% |
[ 13.0% - 13.5% ] 13.22% | 469 | 19.1% |
[ 15.0% - 15.5% ] 15.38% | 156 | 55.1% |
[ 17.0% - 17.5% ] 17.21% | 108,588 | 4.9% |
[ 18.0% - 18.5% ] 18.18% | 66 | 22.2% |
[ 21.0% - 21.5% ] 21.06% | 62,474 | 5.1% |
[ 21.5% - 22.0% ] 21.57% | 51 | 36.7% |
[ 23.5% - 24.0% ] 23.82% | 12,405 | 5.2% |
[ 24.0% - 24.5% ] 24.07% | 53,044 | 5.3% |
[ 29.5% - 30.0% ] 29.74% | 40,392 | 5.9% |
[ 33.0% - 33.5% ] 33.33% | 18 | 60.0% |
[ 60.5% - 61.0% ] 60.91% | 660 | 47.3% |