Jamaican Unemployment Among Women with Children Ages 6 to 17 years
COMPARE
Jamaican
Select to Compare
Unemployment Among Women with Children Ages 6 to 17 years
Jamaican Unemployment Among Women with Children Ages 6 to 17 years
9.8%
UNEMPLOYMENT | WOMEN W/ CHILDREN 6 TO 17
0.0/ 100
METRIC RATING
281st/ 347
METRIC RANK
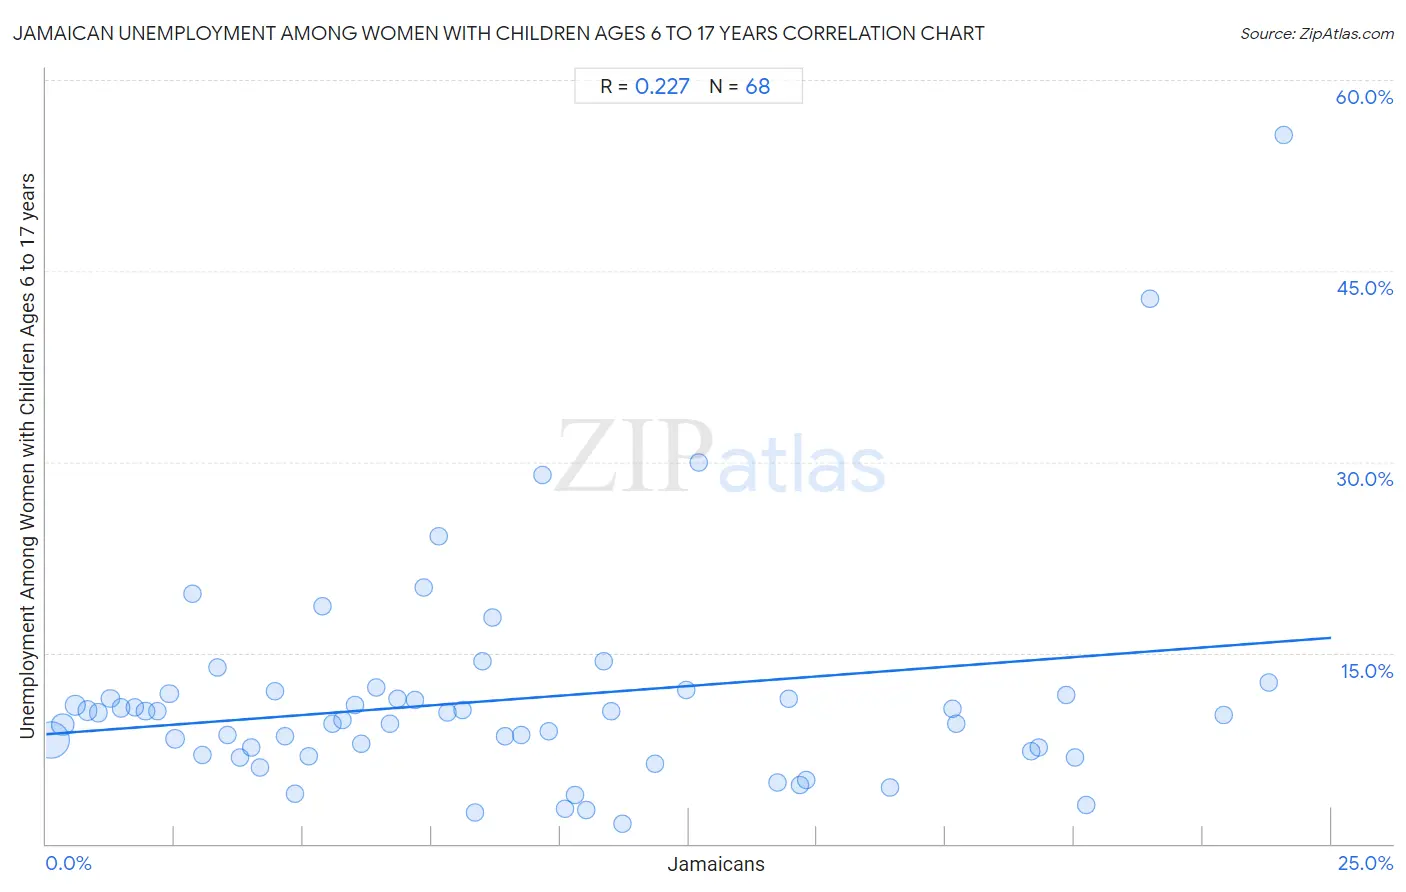
Jamaican Unemployment Among Women with Children Ages 6 to 17 years Correlation Chart
The statistical analysis conducted on geographies consisting of 272,557,643 people shows a weak positive correlation between the proportion of Jamaicans and unemployment rate among women with children between the ages 6 and 17 in the United States with a correlation coefficient (R) of 0.227 and weighted average of 9.8%. On average, for every 1% (one percent) increase in Jamaicans within a typical geography, there is an increase of 0.30% in unemployment rate among women with children between the ages 6 and 17.
It is essential to understand that the correlation between the percentage of Jamaicans and unemployment rate among women with children between the ages 6 and 17 does not imply a direct cause-and-effect relationship. It remains uncertain whether the presence of Jamaicans influences an upward or downward trend in the level of unemployment rate among women with children between the ages 6 and 17 within an area, or if Jamaicans simply ended up residing in those areas with higher or lower levels of unemployment rate among women with children between the ages 6 and 17 due to other factors.
Demographics Similar to Jamaicans by Unemployment Among Women with Children Ages 6 to 17 years
In terms of unemployment among women with children ages 6 to 17 years, the demographic groups most similar to Jamaicans are Slovak (9.8%, a difference of 0.23%), Seminole (9.7%, a difference of 0.53%), Scotch-Irish (9.7%, a difference of 0.72%), French (9.7%, a difference of 0.75%), and British West Indian (9.7%, a difference of 0.82%).
| Demographics | Rating | Rank | Unemployment Among Women with Children Ages 6 to 17 years |
| Aleuts | 0.1 /100 | #274 | Tragic 9.6% |
| U.S. Virgin Islanders | 0.1 /100 | #275 | Tragic 9.7% |
| Immigrants from Portugal | 0.1 /100 | #276 | Tragic 9.7% |
| British West Indians | 0.1 /100 | #277 | Tragic 9.7% |
| French | 0.1 /100 | #278 | Tragic 9.7% |
| Scotch-Irish | 0.1 /100 | #279 | Tragic 9.7% |
| Seminole | 0.1 /100 | #280 | Tragic 9.7% |
| Jamaicans | 0.0 /100 | #281 | Tragic 9.8% |
| Slovaks | 0.0 /100 | #282 | Tragic 9.8% |
| Central American Indians | 0.0 /100 | #283 | Tragic 9.9% |
| Yakama | 0.0 /100 | #284 | Tragic 9.9% |
| Hispanics or Latinos | 0.0 /100 | #285 | Tragic 9.9% |
| Choctaw | 0.0 /100 | #286 | Tragic 9.9% |
| Sierra Leoneans | 0.0 /100 | #287 | Tragic 9.9% |
| Shoshone | 0.0 /100 | #288 | Tragic 10.0% |
Jamaican Unemployment Among Women with Children Ages 6 to 17 years Correlation Summary
| Measurement | Jamaican Data | Unemployment Among Women with Children Ages 6 to 17 years Data |
| Minimum | 0.099% | 1.6% |
| Maximum | 24.1% | 55.7% |
| Range | 24.0% | 54.1% |
| Mean | 9.0% | 11.3% |
| Median | 7.7% | 10.2% |
| Interquartile 25% (IQ1) | 3.9% | 7.2% |
| Interquartile 75% (IQ3) | 12.6% | 11.8% |
| Interquartile Range (IQR) | 8.7% | 4.6% |
| Standard Deviation (Sample) | 6.5% | 8.6% |
| Standard Deviation (Population) | 6.4% | 8.6% |
Correlation Details
| Jamaican Percentile | Sample Size | Unemployment Among Women with Children Ages 6 to 17 years |
[ 0.0% - 0.5% ] 0.099% | 162,593,861 | 8.1% |
[ 0.0% - 0.5% ] 0.33% | 39,135,170 | 9.4% |
[ 0.5% - 1.0% ] 0.57% | 16,783,514 | 10.9% |
[ 0.5% - 1.0% ] 0.80% | 11,973,950 | 10.5% |
[ 1.0% - 1.5% ] 1.01% | 6,995,505 | 10.3% |
[ 1.0% - 1.5% ] 1.24% | 4,248,834 | 11.4% |
[ 1.0% - 1.5% ] 1.46% | 4,072,871 | 10.7% |
[ 1.5% - 2.0% ] 1.72% | 2,822,028 | 10.7% |
[ 1.5% - 2.0% ] 1.93% | 2,055,015 | 10.4% |
[ 2.0% - 2.5% ] 2.15% | 1,913,252 | 10.4% |
[ 2.0% - 2.5% ] 2.39% | 877,082 | 11.8% |
[ 2.5% - 3.0% ] 2.51% | 9,532,408 | 8.2% |
[ 2.5% - 3.0% ] 2.86% | 499,988 | 19.7% |
[ 3.0% - 3.5% ] 3.05% | 873,269 | 7.0% |
[ 3.0% - 3.5% ] 3.32% | 994,190 | 13.9% |
[ 3.5% - 4.0% ] 3.53% | 344,803 | 8.5% |
[ 3.5% - 4.0% ] 3.76% | 388,643 | 6.8% |
[ 3.5% - 4.0% ] 3.99% | 283,591 | 7.6% |
[ 4.0% - 4.5% ] 4.16% | 214,431 | 6.0% |
[ 4.0% - 4.5% ] 4.44% | 529,531 | 12.0% |
[ 4.5% - 5.0% ] 4.65% | 518,620 | 8.4% |
[ 4.5% - 5.0% ] 4.85% | 394,906 | 3.9% |
[ 5.0% - 5.5% ] 5.10% | 118,080 | 6.9% |
[ 5.0% - 5.5% ] 5.38% | 86,025 | 18.6% |
[ 5.5% - 6.0% ] 5.56% | 237,284 | 9.4% |
[ 5.5% - 6.0% ] 5.75% | 268,537 | 9.7% |
[ 5.5% - 6.0% ] 6.00% | 349,684 | 10.9% |
[ 6.0% - 6.5% ] 6.13% | 36,322 | 7.9% |
[ 6.0% - 6.5% ] 6.43% | 175,145 | 12.3% |
[ 6.5% - 7.0% ] 6.69% | 351,998 | 9.4% |
[ 6.5% - 7.0% ] 6.84% | 102,494 | 11.4% |
[ 7.0% - 7.5% ] 7.19% | 224,915 | 11.3% |
[ 7.0% - 7.5% ] 7.35% | 66,239 | 20.1% |
[ 7.5% - 8.0% ] 7.62% | 6,335 | 24.2% |
[ 7.5% - 8.0% ] 7.82% | 79,230 | 10.3% |
[ 8.0% - 8.5% ] 8.09% | 130,085 | 10.5% |
[ 8.0% - 8.5% ] 8.33% | 133,957 | 2.5% |
[ 8.0% - 8.5% ] 8.49% | 195,624 | 14.3% |
[ 8.5% - 9.0% ] 8.68% | 98,611 | 17.8% |
[ 8.5% - 9.0% ] 8.93% | 107,194 | 8.4% |
[ 9.0% - 9.5% ] 9.24% | 19,016 | 8.5% |
[ 9.5% - 10.0% ] 9.65% | 37,829 | 29.0% |
[ 9.5% - 10.0% ] 9.78% | 134,144 | 8.8% |
[ 10.0% - 10.5% ] 10.09% | 51,808 | 2.7% |
[ 10.0% - 10.5% ] 10.28% | 58,396 | 3.8% |
[ 10.5% - 11.0% ] 10.51% | 121,057 | 2.7% |
[ 10.5% - 11.0% ] 10.84% | 38,865 | 14.3% |
[ 10.5% - 11.0% ] 10.99% | 72,684 | 10.4% |
[ 11.0% - 11.5% ] 11.22% | 71,749 | 1.6% |
[ 11.5% - 12.0% ] 11.84% | 135,158 | 6.3% |
[ 12.0% - 12.5% ] 12.46% | 35,082 | 12.1% |
[ 12.5% - 13.0% ] 12.70% | 13,781 | 30.0% |
[ 14.0% - 14.5% ] 14.23% | 78,506 | 4.8% |
[ 14.0% - 14.5% ] 14.45% | 68,182 | 11.4% |
[ 14.5% - 15.0% ] 14.65% | 13,479 | 4.6% |
[ 14.5% - 15.0% ] 14.77% | 27,845 | 5.0% |
[ 16.0% - 16.5% ] 16.42% | 100,082 | 4.4% |
[ 17.5% - 18.0% ] 17.62% | 104,158 | 10.6% |
[ 17.5% - 18.0% ] 17.71% | 72,817 | 9.4% |
[ 19.0% - 19.5% ] 19.16% | 62,232 | 7.3% |
[ 19.0% - 19.5% ] 19.31% | 44,635 | 7.6% |
[ 19.5% - 20.0% ] 19.85% | 72,273 | 11.7% |
[ 20.0% - 20.5% ] 20.02% | 52,792 | 6.8% |
[ 20.0% - 20.5% ] 20.24% | 40,593 | 3.0% |
[ 21.0% - 21.5% ] 21.47% | 35,914 | 42.8% |
[ 22.5% - 23.0% ] 22.90% | 118,819 | 10.1% |
[ 23.5% - 24.0% ] 23.79% | 52,000 | 12.7% |
[ 24.0% - 24.5% ] 24.06% | 10,526 | 55.7% |