Jamaican College, 1 year or more
COMPARE
Jamaican
Select to Compare
College, 1 year or more
Jamaican College, 1 year or more
54.9%
COLLEGE, 1 YEAR OR MORE
0.3/ 100
METRIC RATING
260th/ 347
METRIC RANK
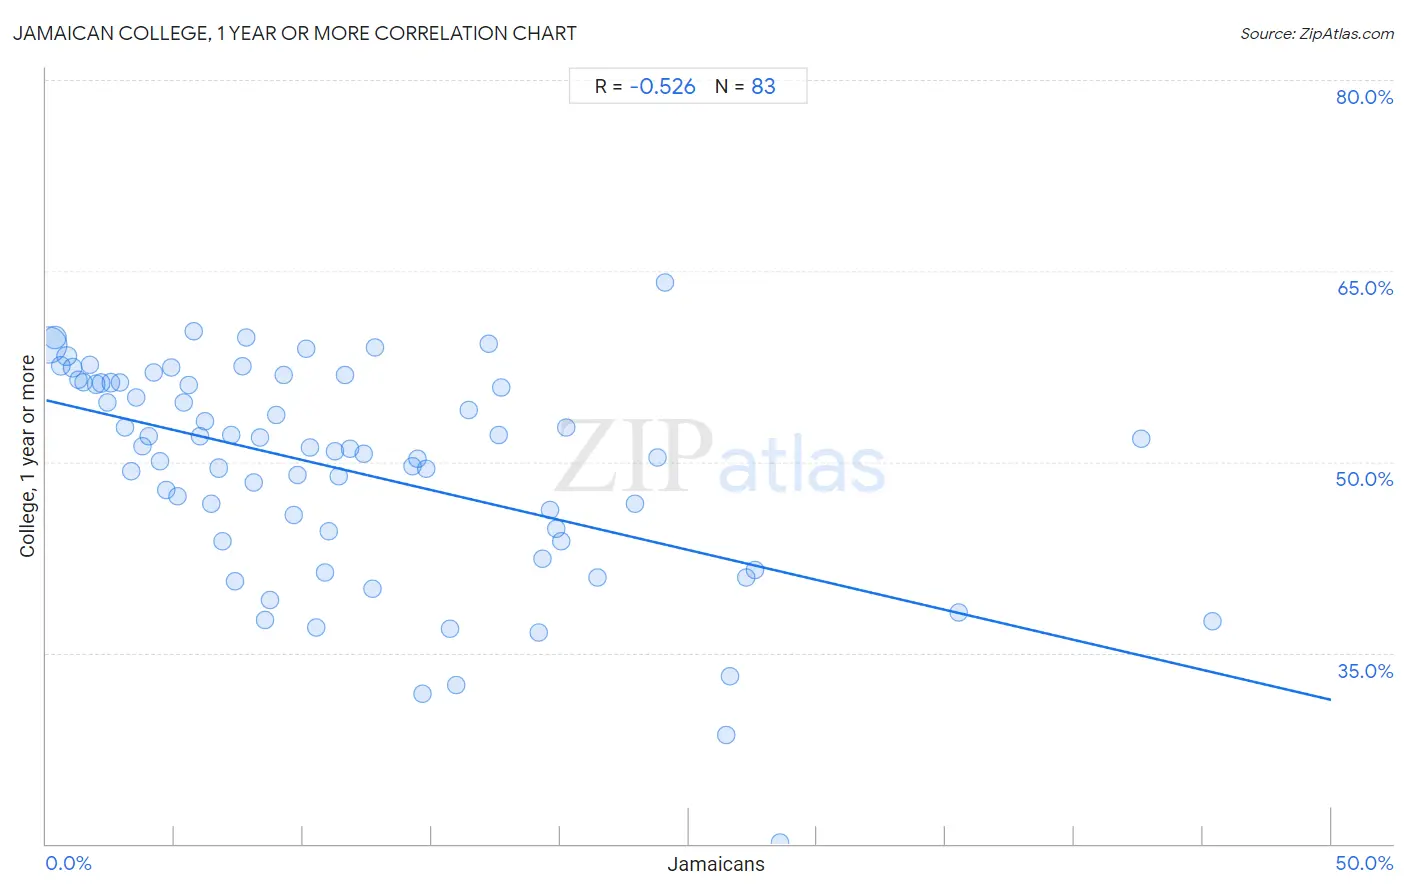
Jamaican College, 1 year or more Correlation Chart
The statistical analysis conducted on geographies consisting of 368,077,485 people shows a substantial negative correlation between the proportion of Jamaicans and percentage of population with at least college, 1 year or more education in the United States with a correlation coefficient (R) of -0.526 and weighted average of 54.9%. On average, for every 1% (one percent) increase in Jamaicans within a typical geography, there is a decrease of 0.47% in percentage of population with at least college, 1 year or more education.
It is essential to understand that the correlation between the percentage of Jamaicans and percentage of population with at least college, 1 year or more education does not imply a direct cause-and-effect relationship. It remains uncertain whether the presence of Jamaicans influences an upward or downward trend in the level of percentage of population with at least college, 1 year or more education within an area, or if Jamaicans simply ended up residing in those areas with higher or lower levels of percentage of population with at least college, 1 year or more education due to other factors.
Demographics Similar to Jamaicans by College, 1 year or more
In terms of college, 1 year or more, the demographic groups most similar to Jamaicans are Ottawa (54.9%, a difference of 0.030%), Nepalese (54.9%, a difference of 0.10%), Immigrants from St. Vincent and the Grenadines (54.8%, a difference of 0.11%), U.S. Virgin Islander (54.8%, a difference of 0.13%), and African (55.0%, a difference of 0.16%).
| Demographics | Rating | Rank | College, 1 year or more |
| Immigrants from Barbados | 0.6 /100 | #253 | Tragic 55.4% |
| Japanese | 0.5 /100 | #254 | Tragic 55.2% |
| Immigrants from Bahamas | 0.5 /100 | #255 | Tragic 55.2% |
| Immigrants from West Indies | 0.5 /100 | #256 | Tragic 55.2% |
| Indonesians | 0.4 /100 | #257 | Tragic 55.1% |
| Africans | 0.4 /100 | #258 | Tragic 55.0% |
| Nepalese | 0.3 /100 | #259 | Tragic 54.9% |
| Jamaicans | 0.3 /100 | #260 | Tragic 54.9% |
| Ottawa | 0.3 /100 | #261 | Tragic 54.9% |
| Immigrants from St. Vincent and the Grenadines | 0.3 /100 | #262 | Tragic 54.8% |
| U.S. Virgin Islanders | 0.3 /100 | #263 | Tragic 54.8% |
| Immigrants from Micronesia | 0.3 /100 | #264 | Tragic 54.8% |
| Immigrants from Laos | 0.2 /100 | #265 | Tragic 54.7% |
| Potawatomi | 0.2 /100 | #266 | Tragic 54.6% |
| Blackfeet | 0.2 /100 | #267 | Tragic 54.6% |
Jamaican College, 1 year or more Correlation Summary
| Measurement | Jamaican Data | College, 1 year or more Data |
| Minimum | 0.098% | 20.1% |
| Maximum | 45.4% | 64.1% |
| Range | 45.3% | 44.0% |
| Mean | 11.8% | 49.3% |
| Median | 9.6% | 51.0% |
| Interquartile 25% (IQ1) | 4.7% | 43.8% |
| Interquartile 75% (IQ3) | 17.2% | 56.2% |
| Interquartile Range (IQR) | 12.6% | 12.4% |
| Standard Deviation (Sample) | 9.5% | 8.5% |
| Standard Deviation (Population) | 9.4% | 8.4% |
Correlation Details
| Jamaican Percentile | Sample Size | College, 1 year or more |
[ 0.0% - 0.5% ] 0.098% | 212,853,191 | 59.2% |
[ 0.0% - 0.5% ] 0.32% | 56,821,158 | 59.8% |
[ 0.5% - 1.0% ] 0.57% | 24,476,729 | 57.5% |
[ 0.5% - 1.0% ] 0.79% | 17,496,620 | 58.3% |
[ 1.0% - 1.5% ] 1.02% | 10,180,674 | 57.4% |
[ 1.0% - 1.5% ] 1.24% | 6,752,413 | 56.5% |
[ 1.0% - 1.5% ] 1.46% | 5,432,981 | 56.3% |
[ 1.5% - 2.0% ] 1.71% | 3,918,294 | 57.6% |
[ 1.5% - 2.0% ] 1.93% | 3,087,357 | 56.1% |
[ 2.0% - 2.5% ] 2.15% | 2,534,495 | 56.2% |
[ 2.0% - 2.5% ] 2.40% | 1,293,748 | 54.7% |
[ 2.5% - 3.0% ] 2.52% | 10,262,609 | 56.2% |
[ 2.5% - 3.0% ] 2.85% | 928,079 | 56.2% |
[ 3.0% - 3.5% ] 3.04% | 1,391,319 | 52.7% |
[ 3.0% - 3.5% ] 3.32% | 1,264,004 | 49.2% |
[ 3.5% - 4.0% ] 3.52% | 635,344 | 55.0% |
[ 3.5% - 4.0% ] 3.76% | 674,261 | 51.2% |
[ 3.5% - 4.0% ] 3.98% | 511,884 | 52.0% |
[ 4.0% - 4.5% ] 4.16% | 341,038 | 57.0% |
[ 4.0% - 4.5% ] 4.44% | 584,124 | 50.0% |
[ 4.5% - 5.0% ] 4.65% | 540,500 | 47.8% |
[ 4.5% - 5.0% ] 4.85% | 418,368 | 57.4% |
[ 5.0% - 5.5% ] 5.10% | 153,077 | 47.3% |
[ 5.0% - 5.5% ] 5.35% | 201,661 | 54.7% |
[ 5.5% - 6.0% ] 5.56% | 314,089 | 56.0% |
[ 5.5% - 6.0% ] 5.75% | 370,061 | 60.3% |
[ 6.0% - 6.5% ] 6.00% | 358,301 | 52.1% |
[ 6.0% - 6.5% ] 6.19% | 67,821 | 53.2% |
[ 6.0% - 6.5% ] 6.43% | 183,080 | 46.7% |
[ 6.5% - 7.0% ] 6.69% | 427,938 | 49.5% |
[ 6.5% - 7.0% ] 6.86% | 156,040 | 43.8% |
[ 7.0% - 7.5% ] 7.20% | 346,080 | 52.1% |
[ 7.0% - 7.5% ] 7.33% | 140,396 | 40.6% |
[ 7.5% - 8.0% ] 7.62% | 7,418 | 57.6% |
[ 7.5% - 8.0% ] 7.80% | 162,063 | 59.7% |
[ 8.0% - 8.5% ] 8.09% | 150,471 | 48.4% |
[ 8.0% - 8.5% ] 8.33% | 138,522 | 51.9% |
[ 8.0% - 8.5% ] 8.49% | 197,052 | 37.6% |
[ 8.5% - 9.0% ] 8.69% | 101,391 | 39.1% |
[ 8.5% - 9.0% ] 8.96% | 154,467 | 53.7% |
[ 9.0% - 9.5% ] 9.25% | 40,619 | 56.8% |
[ 9.5% - 10.0% ] 9.64% | 43,733 | 45.9% |
[ 9.5% - 10.0% ] 9.78% | 139,481 | 48.9% |
[ 10.0% - 10.5% ] 10.13% | 81,502 | 58.9% |
[ 10.0% - 10.5% ] 10.28% | 63,088 | 51.1% |
[ 10.5% - 11.0% ] 10.51% | 124,075 | 36.9% |
[ 10.5% - 11.0% ] 10.84% | 39,495 | 41.3% |
[ 10.5% - 11.0% ] 10.99% | 75,215 | 44.6% |
[ 11.0% - 11.5% ] 11.24% | 94,486 | 50.8% |
[ 11.0% - 11.5% ] 11.38% | 43,517 | 48.8% |
[ 11.5% - 12.0% ] 11.64% | 739 | 56.8% |
[ 11.5% - 12.0% ] 11.84% | 135,158 | 51.0% |
[ 12.0% - 12.5% ] 12.38% | 80,728 | 50.7% |
[ 12.5% - 13.0% ] 12.70% | 14,549 | 40.0% |
[ 12.5% - 13.0% ] 12.81% | 640 | 59.0% |
[ 14.0% - 14.5% ] 14.23% | 78,506 | 49.7% |
[ 14.0% - 14.5% ] 14.45% | 68,431 | 50.3% |
[ 14.5% - 15.0% ] 14.65% | 13,479 | 31.8% |
[ 14.5% - 15.0% ] 14.77% | 27,845 | 49.5% |
[ 15.5% - 16.0% ] 15.69% | 2,039 | 36.9% |
[ 15.5% - 16.0% ] 15.95% | 163 | 32.5% |
[ 16.0% - 16.5% ] 16.43% | 121,912 | 54.0% |
[ 17.0% - 17.5% ] 17.21% | 22,486 | 59.3% |
[ 17.5% - 18.0% ] 17.62% | 104,158 | 52.1% |
[ 17.5% - 18.0% ] 17.71% | 72,817 | 55.9% |
[ 19.0% - 19.5% ] 19.16% | 62,232 | 36.6% |
[ 19.0% - 19.5% ] 19.31% | 47,516 | 42.4% |
[ 19.5% - 20.0% ] 19.62% | 40,073 | 46.2% |
[ 19.5% - 20.0% ] 19.85% | 72,581 | 44.7% |
[ 20.0% - 20.5% ] 20.02% | 52,951 | 43.7% |
[ 20.0% - 20.5% ] 20.24% | 40,593 | 52.7% |
[ 21.0% - 21.5% ] 21.47% | 35,914 | 40.9% |
[ 22.5% - 23.0% ] 22.90% | 118,819 | 46.7% |
[ 23.5% - 24.0% ] 23.79% | 52,000 | 50.3% |
[ 24.0% - 24.5% ] 24.06% | 10,526 | 64.1% |
[ 26.0% - 26.5% ] 26.47% | 170 | 28.6% |
[ 26.5% - 27.0% ] 26.59% | 21,977 | 33.2% |
[ 27.0% - 27.5% ] 27.26% | 543 | 40.9% |
[ 27.5% - 28.0% ] 27.58% | 562 | 41.5% |
[ 28.5% - 29.0% ] 28.55% | 641 | 20.1% |
[ 35.5% - 36.0% ] 35.52% | 2,224 | 38.2% |
[ 42.5% - 43.0% ] 42.59% | 54 | 51.9% |
[ 45.0% - 45.5% ] 45.38% | 130 | 37.5% |