Jamaican Disability Age 5 to 17
COMPARE
Jamaican
Select to Compare
Disability Age 5 to 17
Jamaican Disability Age 5 to 17
6.2%
DISABILITY | AGE 5 TO 17
0.0/ 100
METRIC RATING
288th/ 347
METRIC RANK
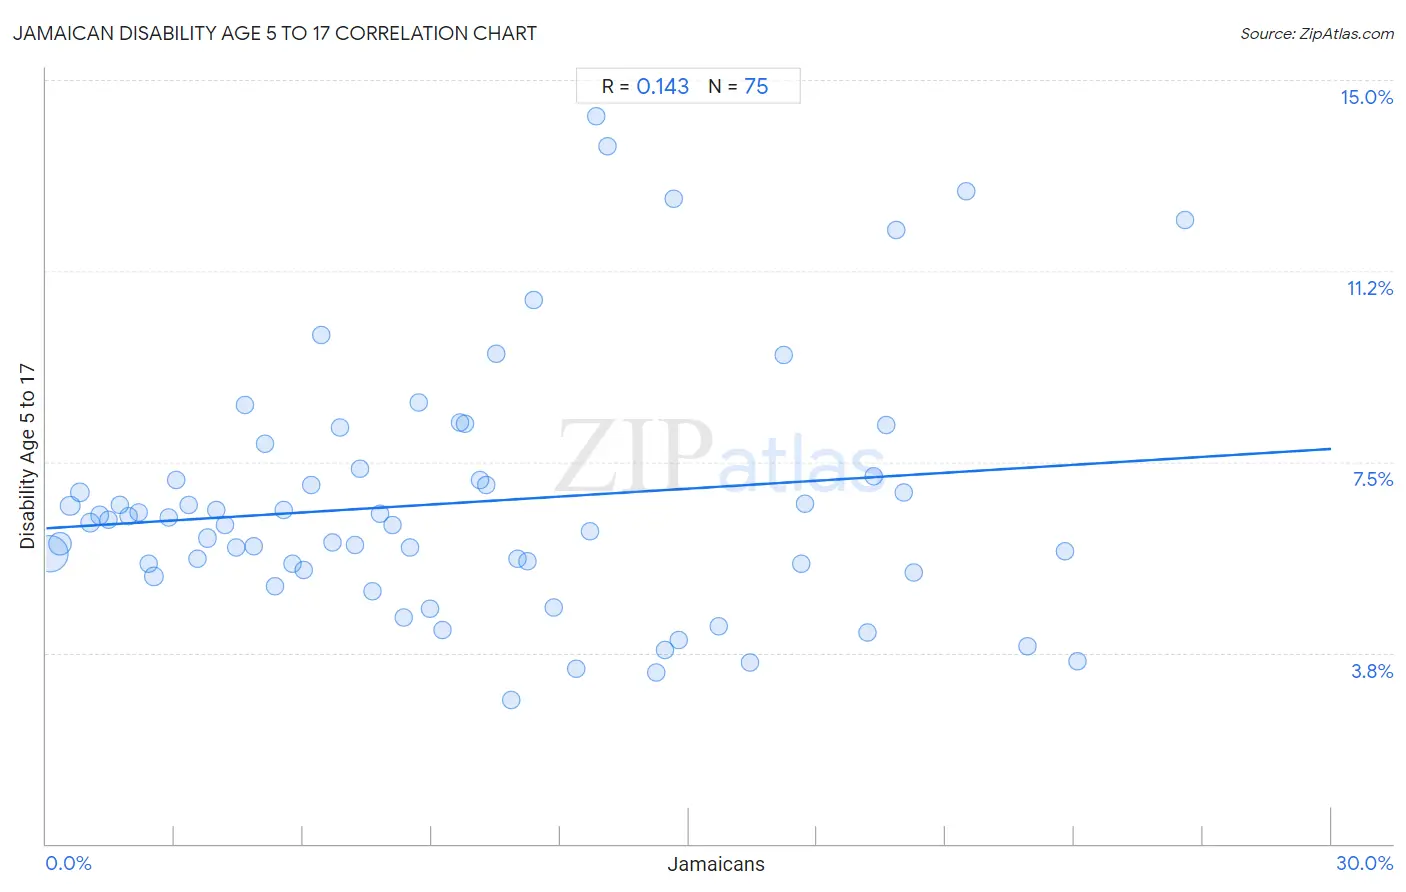
Jamaican Disability Age 5 to 17 Correlation Chart
The statistical analysis conducted on geographies consisting of 365,362,529 people shows a poor positive correlation between the proportion of Jamaicans and percentage of population with a disability between the ages 5 and 17 in the United States with a correlation coefficient (R) of 0.143 and weighted average of 6.2%. On average, for every 1% (one percent) increase in Jamaicans within a typical geography, there is an increase of 0.052% in percentage of population with a disability between the ages 5 and 17.
It is essential to understand that the correlation between the percentage of Jamaicans and percentage of population with a disability between the ages 5 and 17 does not imply a direct cause-and-effect relationship. It remains uncertain whether the presence of Jamaicans influences an upward or downward trend in the level of percentage of population with a disability between the ages 5 and 17 within an area, or if Jamaicans simply ended up residing in those areas with higher or lower levels of percentage of population with a disability between the ages 5 and 17 due to other factors.
Demographics Similar to Jamaicans by Disability Age 5 to 17
In terms of disability age 5 to 17, the demographic groups most similar to Jamaicans are Yaqui (6.2%, a difference of 0.010%), Immigrants from Congo (6.2%, a difference of 0.010%), White/Caucasian (6.2%, a difference of 0.15%), Pima (6.2%, a difference of 0.26%), and Immigrants from Senegal (6.2%, a difference of 0.40%).
| Demographics | Rating | Rank | Disability Age 5 to 17 |
| Scottish | 0.0 /100 | #281 | Tragic 6.1% |
| Germans | 0.0 /100 | #282 | Tragic 6.1% |
| Ugandans | 0.0 /100 | #283 | Tragic 6.2% |
| Sub-Saharan Africans | 0.0 /100 | #284 | Tragic 6.2% |
| English | 0.0 /100 | #285 | Tragic 6.2% |
| Colville | 0.0 /100 | #286 | Tragic 6.2% |
| Pima | 0.0 /100 | #287 | Tragic 6.2% |
| Jamaicans | 0.0 /100 | #288 | Tragic 6.2% |
| Yaqui | 0.0 /100 | #289 | Tragic 6.2% |
| Immigrants from Congo | 0.0 /100 | #290 | Tragic 6.2% |
| Whites/Caucasians | 0.0 /100 | #291 | Tragic 6.2% |
| Immigrants from Senegal | 0.0 /100 | #292 | Tragic 6.2% |
| Central American Indians | 0.0 /100 | #293 | Tragic 6.2% |
| Irish | 0.0 /100 | #294 | Tragic 6.2% |
| Cree | 0.0 /100 | #295 | Tragic 6.2% |
Jamaican Disability Age 5 to 17 Correlation Summary
| Measurement | Jamaican Data | Disability Age 5 to 17 Data |
| Minimum | 0.098% | 2.8% |
| Maximum | 26.6% | 14.3% |
| Range | 26.5% | 11.5% |
| Mean | 9.7% | 6.7% |
| Median | 8.5% | 6.3% |
| Interquartile 25% (IQ1) | 4.2% | 5.4% |
| Interquartile 75% (IQ3) | 14.5% | 7.2% |
| Interquartile Range (IQR) | 10.3% | 1.8% |
| Standard Deviation (Sample) | 6.7% | 2.4% |
| Standard Deviation (Population) | 6.7% | 2.4% |
Correlation Details
| Jamaican Percentile | Sample Size | Disability Age 5 to 17 |
[ 0.0% - 0.5% ] 0.098% | 212,042,835 | 5.7% |
[ 0.0% - 0.5% ] 0.32% | 56,217,470 | 5.9% |
[ 0.5% - 1.0% ] 0.57% | 24,109,266 | 6.6% |
[ 0.5% - 1.0% ] 0.79% | 17,210,526 | 6.9% |
[ 1.0% - 1.5% ] 1.02% | 10,073,063 | 6.3% |
[ 1.0% - 1.5% ] 1.24% | 6,683,860 | 6.4% |
[ 1.0% - 1.5% ] 1.46% | 5,342,694 | 6.4% |
[ 1.5% - 2.0% ] 1.71% | 3,857,641 | 6.7% |
[ 1.5% - 2.0% ] 1.93% | 3,061,689 | 6.4% |
[ 2.0% - 2.5% ] 2.15% | 2,502,947 | 6.5% |
[ 2.0% - 2.5% ] 2.40% | 1,228,518 | 5.5% |
[ 2.5% - 3.0% ] 2.52% | 10,224,601 | 5.2% |
[ 2.5% - 3.0% ] 2.85% | 907,898 | 6.4% |
[ 3.0% - 3.5% ] 3.04% | 1,374,960 | 7.1% |
[ 3.0% - 3.5% ] 3.32% | 1,246,589 | 6.6% |
[ 3.5% - 4.0% ] 3.52% | 625,157 | 5.6% |
[ 3.5% - 4.0% ] 3.77% | 656,172 | 6.0% |
[ 3.5% - 4.0% ] 3.98% | 506,741 | 6.5% |
[ 4.0% - 4.5% ] 4.16% | 339,543 | 6.3% |
[ 4.0% - 4.5% ] 4.44% | 583,193 | 5.8% |
[ 4.5% - 5.0% ] 4.65% | 535,935 | 8.6% |
[ 4.5% - 5.0% ] 4.85% | 414,141 | 5.8% |
[ 5.0% - 5.5% ] 5.10% | 147,799 | 7.8% |
[ 5.0% - 5.5% ] 5.35% | 193,390 | 5.1% |
[ 5.5% - 6.0% ] 5.56% | 311,925 | 6.6% |
[ 5.5% - 6.0% ] 5.75% | 367,221 | 5.5% |
[ 6.0% - 6.5% ] 6.00% | 357,390 | 5.4% |
[ 6.0% - 6.5% ] 6.18% | 60,260 | 7.0% |
[ 6.0% - 6.5% ] 6.43% | 183,080 | 10.0% |
[ 6.5% - 7.0% ] 6.69% | 424,040 | 5.9% |
[ 6.5% - 7.0% ] 6.86% | 153,738 | 8.2% |
[ 7.0% - 7.5% ] 7.20% | 344,225 | 5.9% |
[ 7.0% - 7.5% ] 7.33% | 140,396 | 7.4% |
[ 7.5% - 8.0% ] 7.62% | 6,388 | 5.0% |
[ 7.5% - 8.0% ] 7.80% | 161,235 | 6.5% |
[ 8.0% - 8.5% ] 8.09% | 150,421 | 6.3% |
[ 8.0% - 8.5% ] 8.33% | 133,957 | 4.5% |
[ 8.0% - 8.5% ] 8.49% | 197,052 | 5.8% |
[ 8.5% - 9.0% ] 8.69% | 100,844 | 8.7% |
[ 8.5% - 9.0% ] 8.96% | 147,545 | 4.6% |
[ 9.0% - 9.5% ] 9.25% | 40,619 | 4.2% |
[ 9.5% - 10.0% ] 9.65% | 41,764 | 8.3% |
[ 9.5% - 10.0% ] 9.78% | 138,789 | 8.3% |
[ 10.0% - 10.5% ] 10.13% | 81,253 | 7.2% |
[ 10.0% - 10.5% ] 10.28% | 63,088 | 7.0% |
[ 10.5% - 11.0% ] 10.51% | 123,924 | 9.6% |
[ 10.5% - 11.0% ] 10.84% | 38,865 | 2.8% |
[ 10.5% - 11.0% ] 10.99% | 74,916 | 5.6% |
[ 11.0% - 11.5% ] 11.24% | 94,486 | 5.5% |
[ 11.0% - 11.5% ] 11.38% | 43,517 | 10.7% |
[ 11.5% - 12.0% ] 11.84% | 135,158 | 4.6% |
[ 12.0% - 12.5% ] 12.38% | 78,440 | 3.4% |
[ 12.5% - 13.0% ] 12.70% | 13,781 | 6.1% |
[ 12.5% - 13.0% ] 12.84% | 483 | 14.3% |
[ 13.0% - 13.5% ] 13.11% | 1,900 | 13.7% |
[ 14.0% - 14.5% ] 14.23% | 78,506 | 3.4% |
[ 14.0% - 14.5% ] 14.45% | 68,182 | 3.8% |
[ 14.5% - 15.0% ] 14.65% | 13,479 | 12.7% |
[ 14.5% - 15.0% ] 14.77% | 27,845 | 4.0% |
[ 15.5% - 16.0% ] 15.69% | 1,950 | 4.3% |
[ 16.0% - 16.5% ] 16.43% | 121,912 | 3.6% |
[ 17.0% - 17.5% ] 17.22% | 21,329 | 9.6% |
[ 17.5% - 18.0% ] 17.62% | 104,158 | 5.5% |
[ 17.5% - 18.0% ] 17.71% | 72,817 | 6.7% |
[ 19.0% - 19.5% ] 19.16% | 62,232 | 4.2% |
[ 19.0% - 19.5% ] 19.31% | 47,516 | 7.2% |
[ 19.5% - 20.0% ] 19.62% | 40,073 | 8.2% |
[ 19.5% - 20.0% ] 19.85% | 72,581 | 12.1% |
[ 20.0% - 20.5% ] 20.02% | 52,792 | 6.9% |
[ 20.0% - 20.5% ] 20.24% | 40,593 | 5.3% |
[ 21.0% - 21.5% ] 21.47% | 35,914 | 12.8% |
[ 22.5% - 23.0% ] 22.90% | 118,819 | 3.9% |
[ 23.5% - 24.0% ] 23.79% | 52,000 | 5.7% |
[ 24.0% - 24.5% ] 24.06% | 10,526 | 3.6% |
[ 26.5% - 27.0% ] 26.59% | 21,977 | 12.2% |